| Param | Original file | Final file |
|---|---|---|
| Filename | modeM0/AS1G05_021T01_9000000624_04933cztM0_level2.evt | modeM0/AS1G05_021T01_9000000624_04933cztM0_level2_quad_clean.evt |
| Size (bytes) | 517,371,840 | 97,891,200 |
| Size | 493.4 MB | 93.4 MB |
| Events in quadrant A | 3,211,093 | 651,719 |
| Events in quadrant B | 2,867,823 | 663,043 |
| Events in quadrant C | 5,754,301 | 608,635 |
| Events in quadrant D | 3,437,206 | 630,643 |
| Mode M9 | |||
|---|---|---|---|
| Quadrant | BADHDUFLAG | Total packets | Discarded packets |
| A | 0 | 12 | 0 |
| B | 0 | 12 | 0 |
| C | 0 | 12 | 0 |
| D | 0 | 12 | 0 |
| Mode M0 | |||
|---|---|---|---|
| Quadrant | BADHDUFLAG | Total packets | Discarded packets |
| A | 0 | 13535 | 2 |
| B | 0 | 12391 | 1 |
| C | 0 | 21069 | 1 |
| D | 0 | 14058 | 1 |
| Mode SS | |||
|---|---|---|---|
| Quadrant | BADHDUFLAG | Total packets | Discarded packets |
| A | 0 | 120 | 0 |
| B | 0 | 120 | 0 |
| C | 0 | 120 | 0 |
| D | 0 | 120 | 0 |
| Quadrant | Total seconds | Saturated seconds | Saturation percentage |
|---|---|---|---|
| A | 5865 | 247 | 4.211424% |
| B | 5865 | 59 | 1.005968% |
| C | 5865 | 937 | 15.976130% |
| D | 5865 | 148 | 2.523444% |
Noise dominated data is calculated using 1-second bins in cleaned event files. If a bin has >2000 counts, and if more than 50% of those come from <1% of pixels, then it is considered to be noise-dominated and hence unusable.
| Quadrant | # 1 sec bins | Bins with >0 counts | Bins with >2000 counts | High rate bins dominated by noise | Noise dominated (total time) | Noise dominated (detector-on time) | Marked lightcurve |
|---|---|---|---|---|---|---|---|
| A | 7045 | 5865 | 183 | 183 | 2.60% | 3.12% | 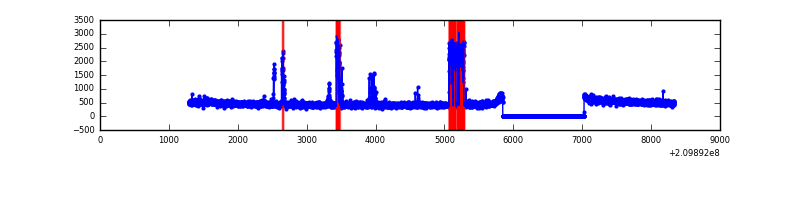 |
| B | 7045 | 5865 | 1 | 1 | 0.01% | 0.02% | 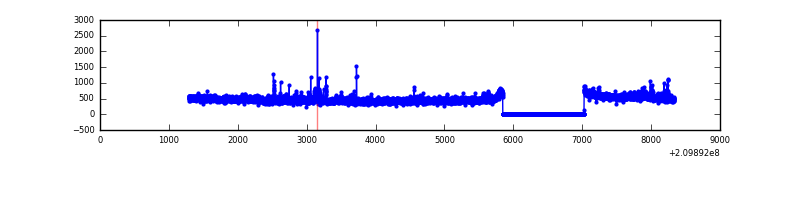 |
| C | 7045 | 5865 | 813 | 813 | 11.54% | 13.86% | 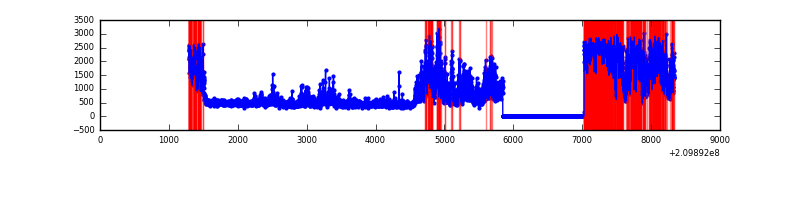 |
| D | 7045 | 5865 | 100 | 100 | 1.42% | 1.71% | 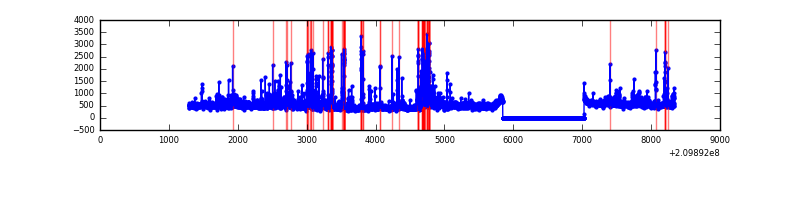 |
Top three noisy pixels from each quadrant. If the there are fewer than three noisy pixels in the level2.evt file, extra rows are filled as -1
| Pixel properties | Quadrant properties | ||||||
|---|---|---|---|---|---|---|---|
| Quadrant | DetID | PixID | Counts | Sigma | Mean | Median | Sigma |
| A | 0 | 31 | 510046 | 3670.39 | 693 | 679 | 138.8 |
| A | 0 | 50 | 16748 | 115.79 | 693 | 679 | 138.8 |
| A | 12 | 194 | 6953 | 45.21 | 693 | 679 | 138.8 |
| B | 15 | 204 | 56025 | 416.57 | 700 | 685 | 132.8 |
| B | 0 | 219 | 31919 | 235.12 | 700 | 685 | 132.8 |
| B | 15 | 54 | 30623 | 225.36 | 700 | 685 | 132.8 |
| C | 9 | 247 | 3255767 | 22480.5 | 634 | 638 | 144.8 |
| C | 1 | 16 | 24464 | 164.55 | 634 | 638 | 144.8 |
| C | 13 | 61 | 5239 | 31.78 | 634 | 638 | 144.8 |
| D | 2 | 33 | 334032 | 2056.04 | 677 | 657 | 162.1 |
| D | 13 | 53 | 157222 | 965.59 | 677 | 657 | 162.1 |
| D | 7 | 67 | 74540 | 455.66 | 677 | 657 | 162.1 |
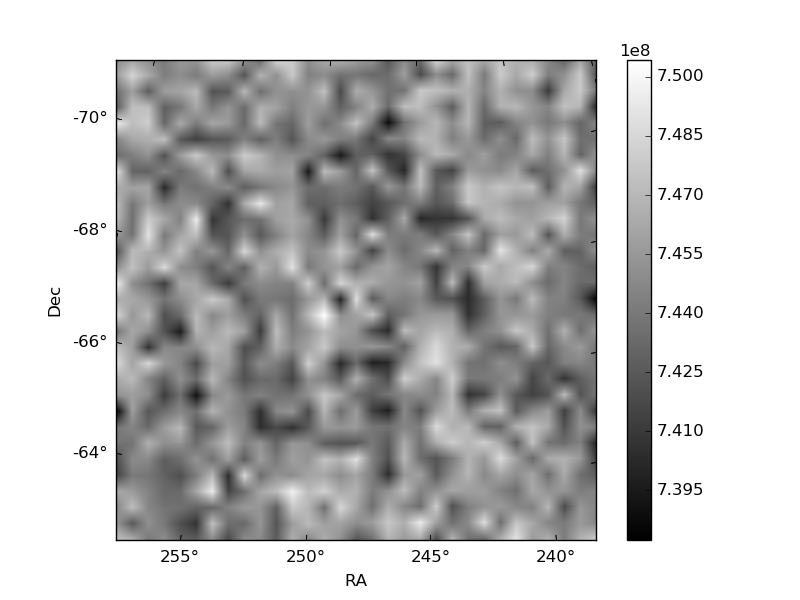
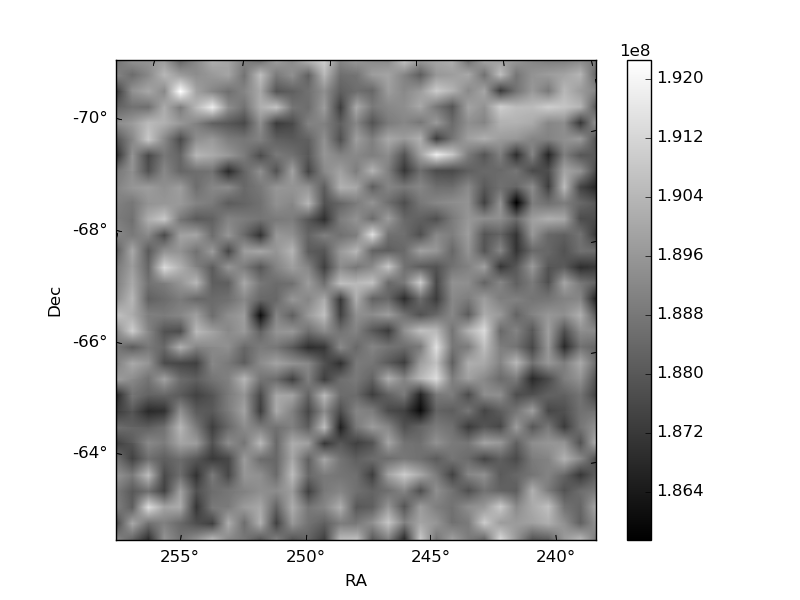
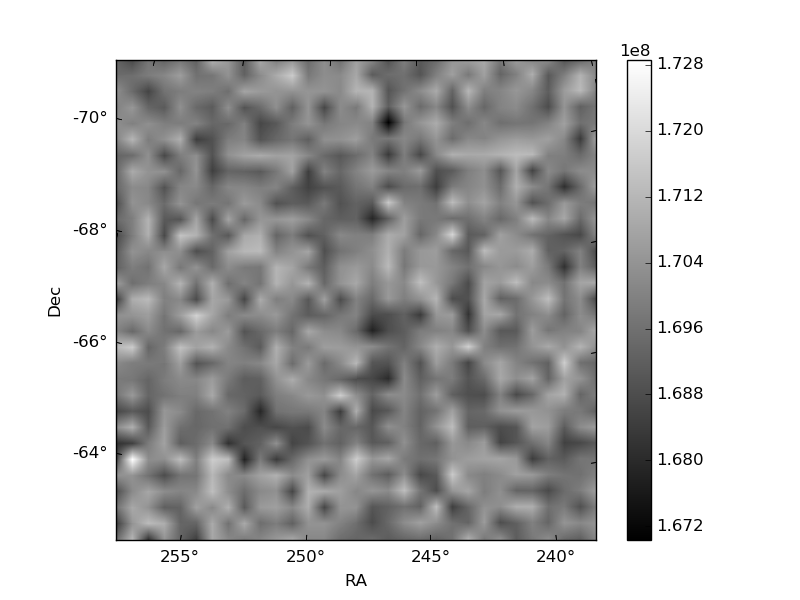
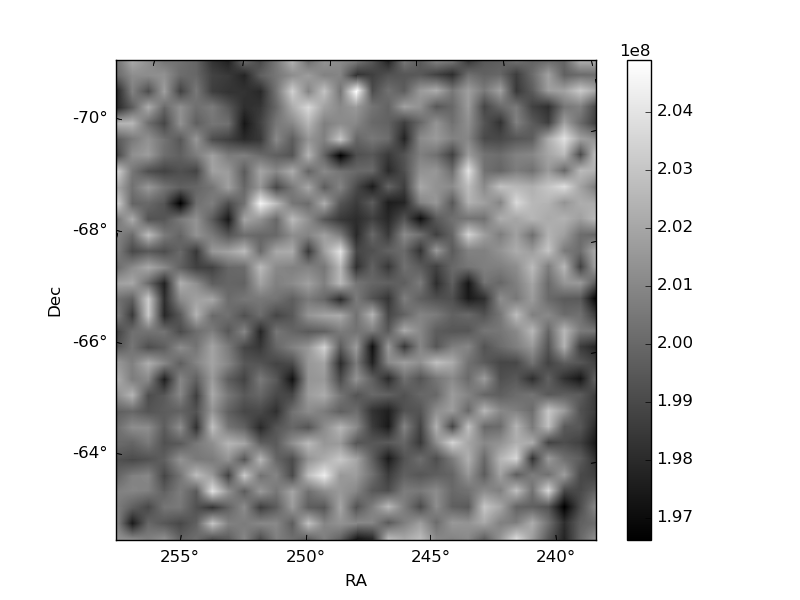
Histogram calculated using DETX and DETY for each event in the final _common_clean file
| Quadrant A | 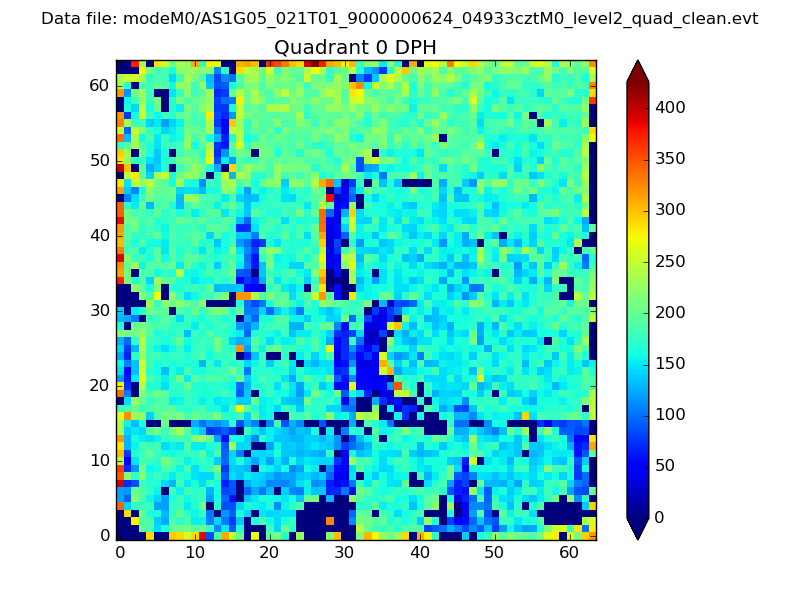 |
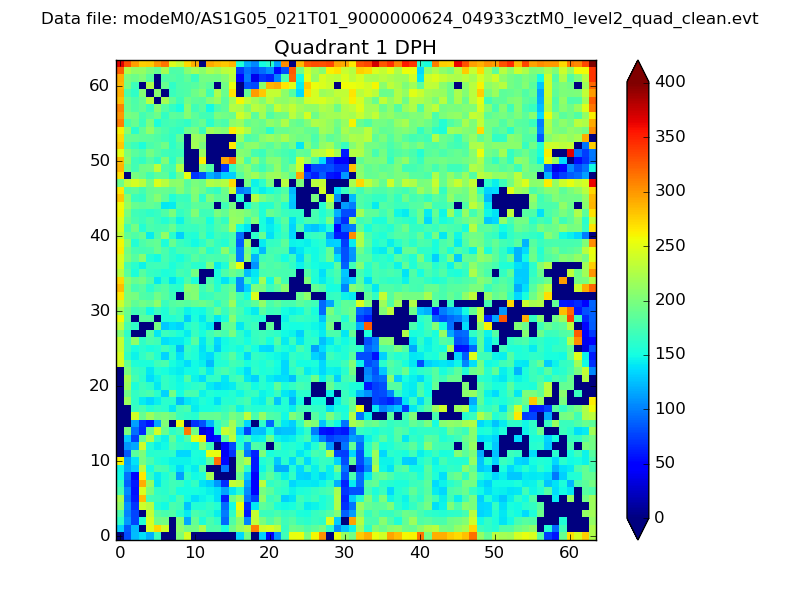 |
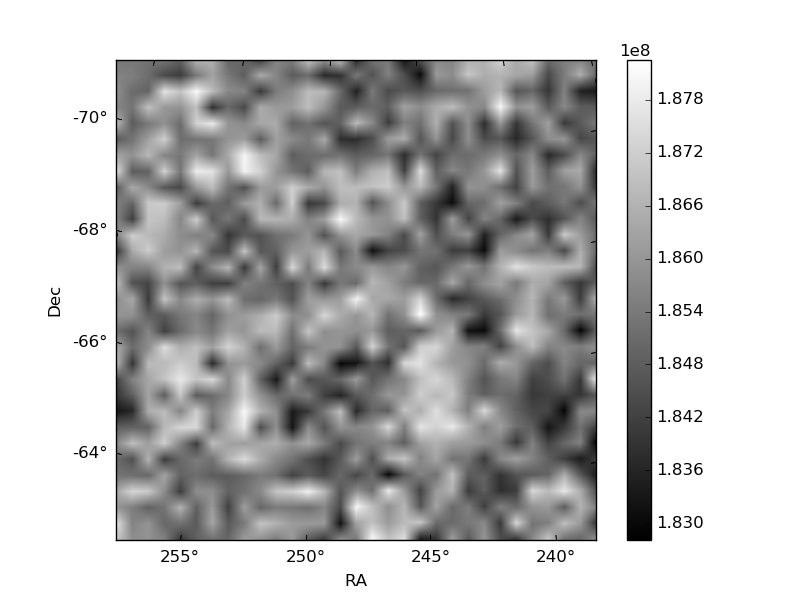
Quadrant B |
|---|---|---|---|
| Quadrant D | 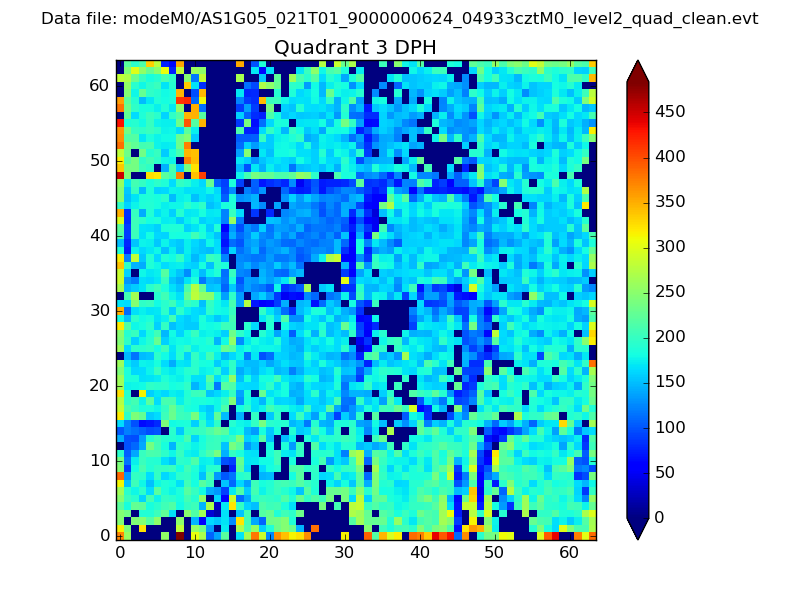 |
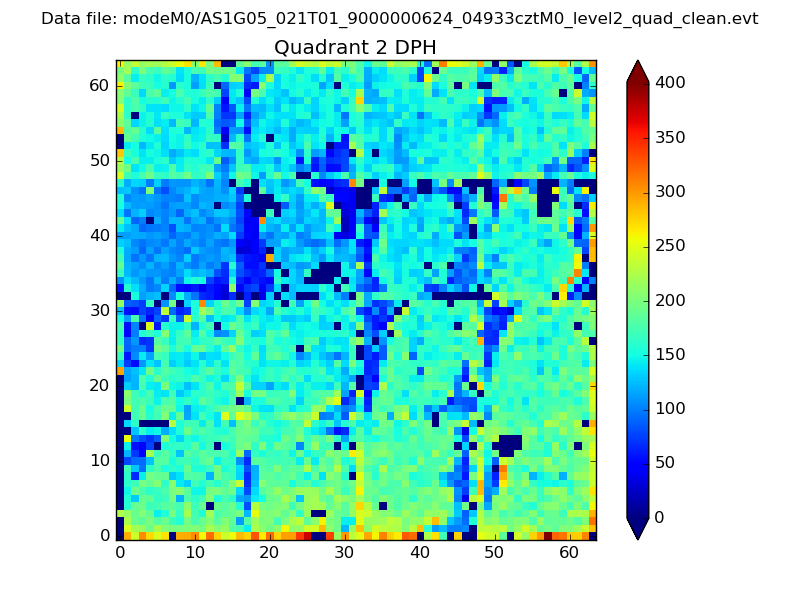 |
Quadrant C |
| Plot type | Count rate plots | Images |
|---|---|---|
| Comparison with Poisson distribution Blue bars denote a histogram of data divided into 1 sec bins. Red curve is a Poisson curve with rate = median count rate of data. |
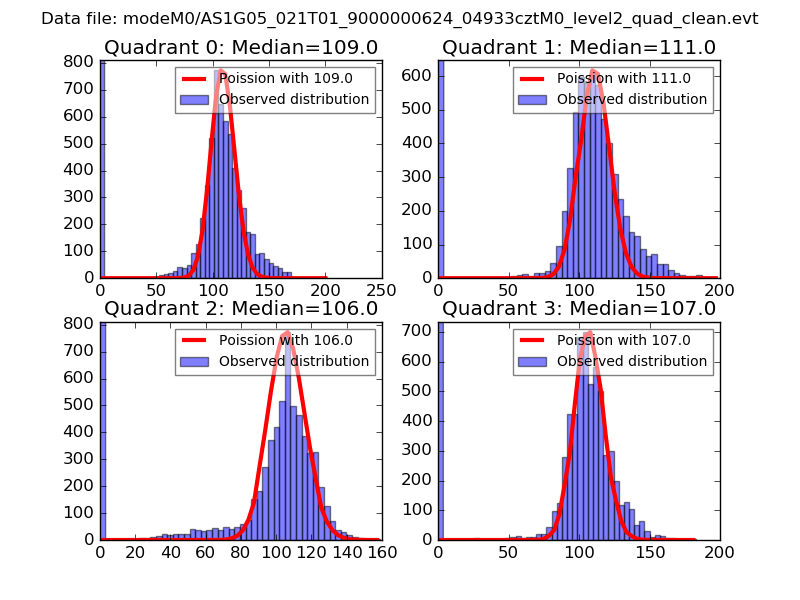 |
 |
| Quadrant-wise count rates Data is divided into 100 sec bins |
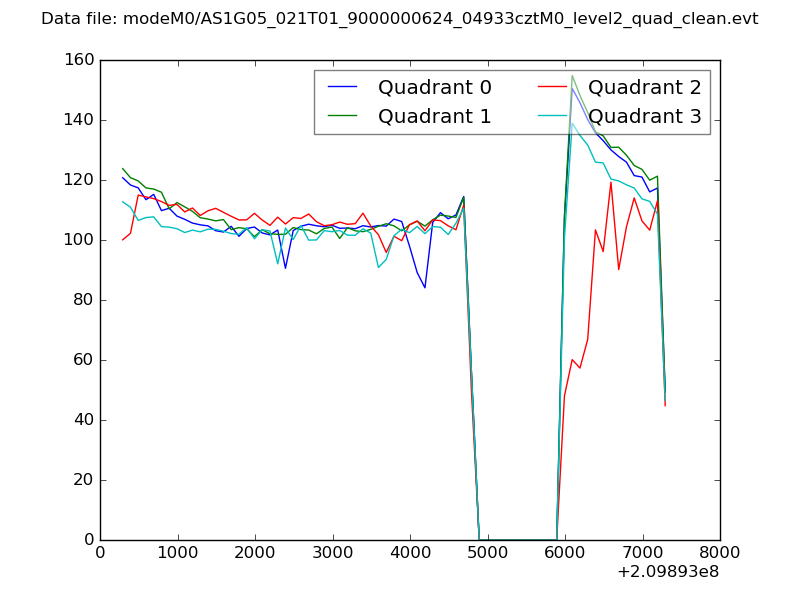 |
|
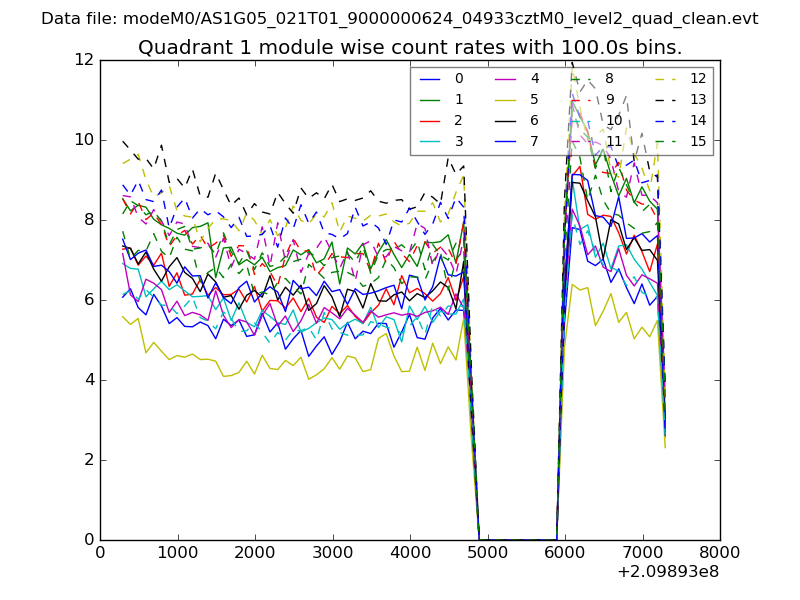
| Module-wise count rates for Quadrant A Data is divided into 100 sec bins |
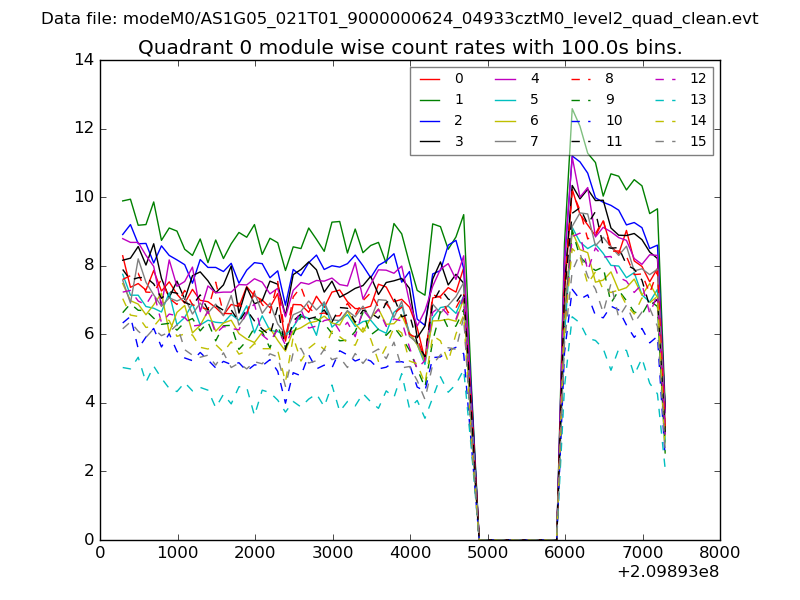 |
 |
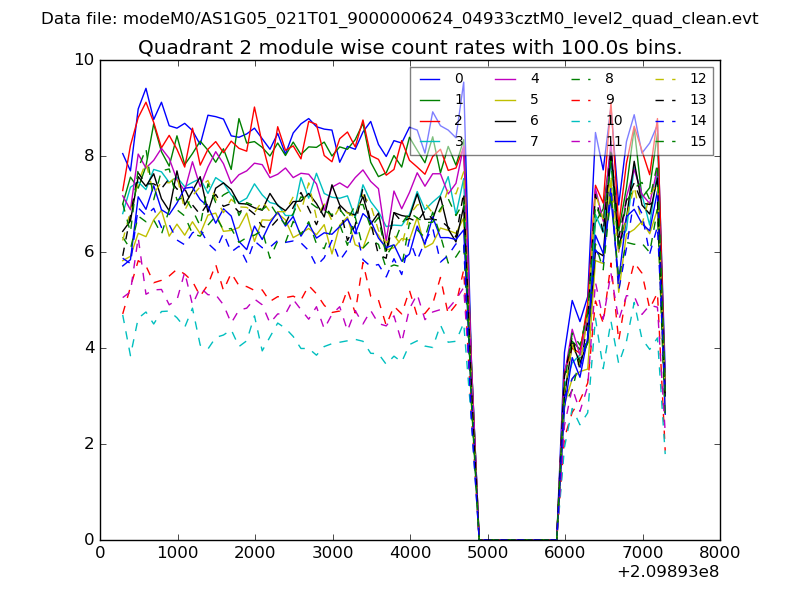
| Module-wise count rates for Quadrant B Data is divided into 100 sec bins |
 |
 |
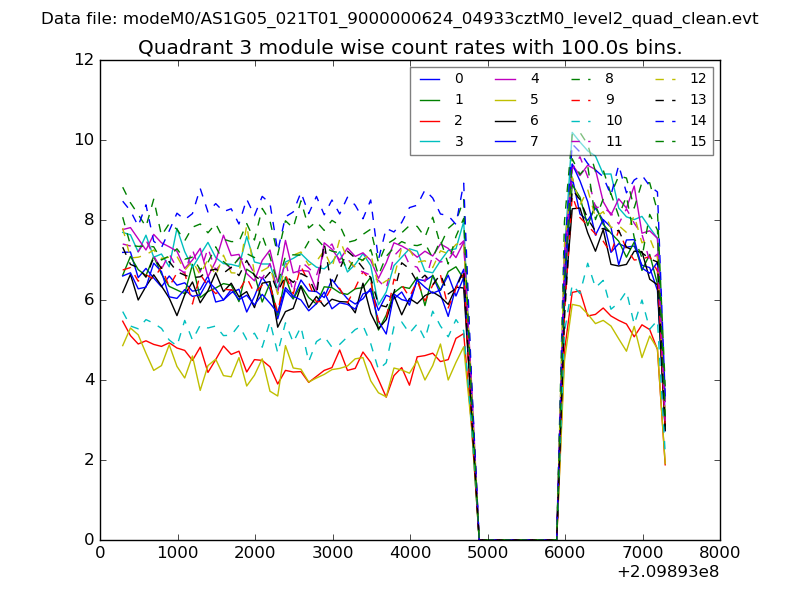
| Module-wise count rates for Quadrant C Data is divided into 100 sec bins |
 |
 |
| Module-wise count rates for Quadrant D Data is divided into 100 sec bins |
 |
 |
| Parameter | Plot |
|---|---|
| CZT HV Monitor | 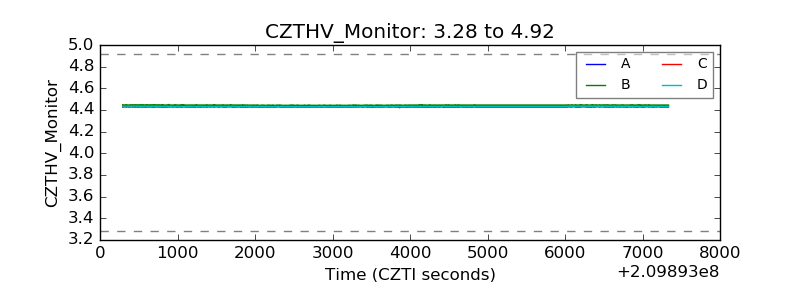 |
| D_VDD |  |
| Temperature 1 | 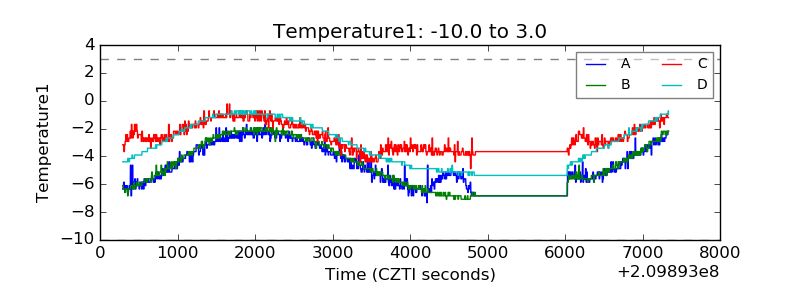 |
| Veto HV Monitor | 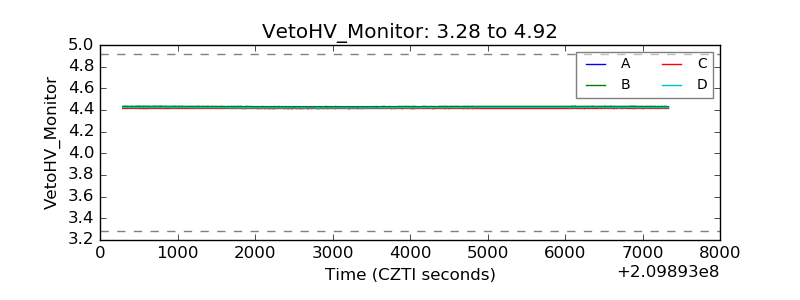 |
| Veto LLD | 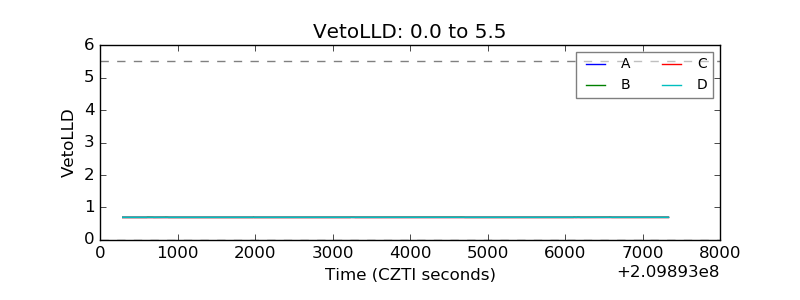 |
| Alpha Counter | 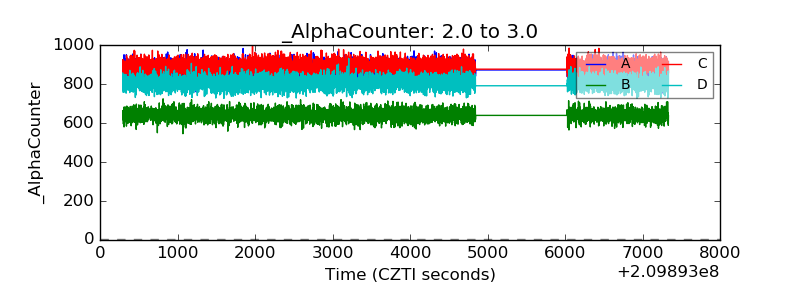 |
| _CPM_Rate | 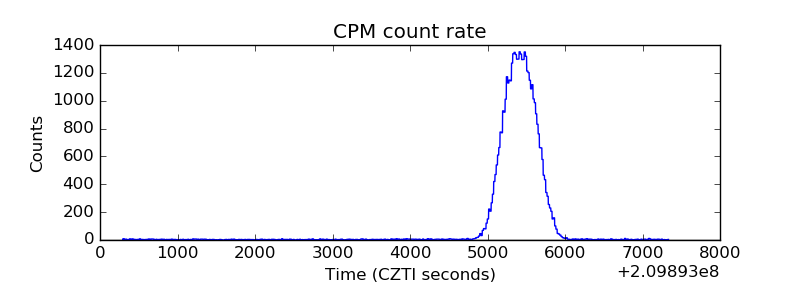 |
| CZT Counter | 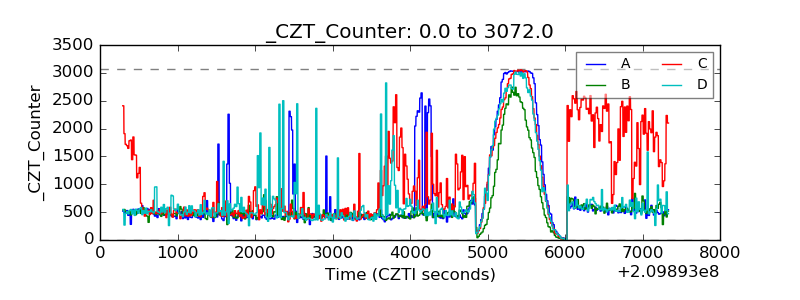 |
| +2.5 Volts monitor |  |
| +5 Volts monitor |  |
| _ROLL_ROT | 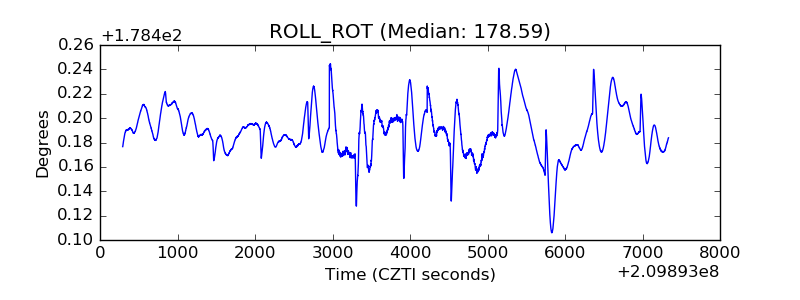 |
| _Roll_DEC | 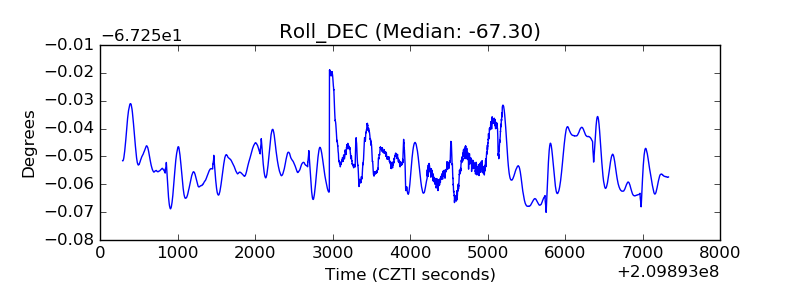 |
| _Roll_RA | 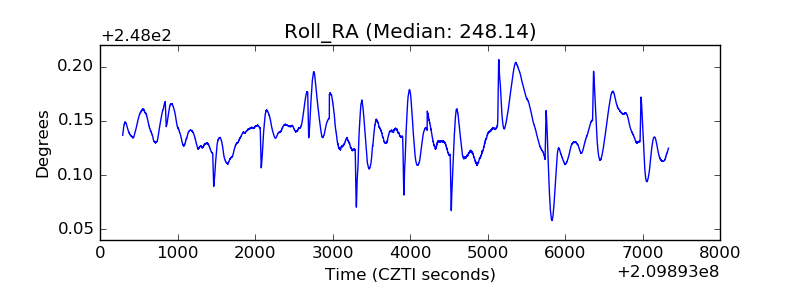 |
| Veto Counter | 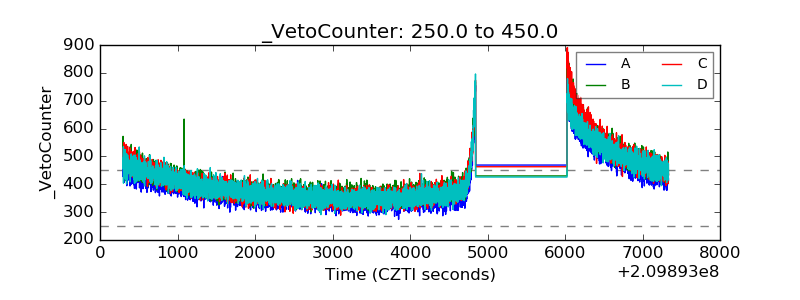 |