| Param | Original file | Final file |
|---|---|---|
| Filename | modeM0/AS1G05_021T01_9000000624_04934cztM0_level2.evt | modeM0/AS1G05_021T01_9000000624_04934cztM0_level2_quad_clean.evt |
| Size (bytes) | 756,509,760 | 108,578,880 |
| Size | 721.5 MB | 103.5 MB |
| Events in quadrant A | 3,236,344 | 752,946 |
| Events in quadrant B | 3,242,473 | 758,077 |
| Events in quadrant C | 12,080,827 | 609,937 |
| Events in quadrant D | 3,919,189 | 719,784 |
| Mode M9 | |||
|---|---|---|---|
| Quadrant | BADHDUFLAG | Total packets | Discarded packets |
| A | 0 | 12 | 0 |
| B | 0 | 12 | 0 |
| C | 0 | 12 | 0 |
| D | 0 | 12 | 0 |
| Mode M0 | |||
|---|---|---|---|
| Quadrant | BADHDUFLAG | Total packets | Discarded packets |
| A | 0 | 13782 | 2 |
| B | 0 | 13818 | 1 |
| C | 0 | 40294 | 1 |
| D | 0 | 16061 | 1 |
| Mode SS | |||
|---|---|---|---|
| Quadrant | BADHDUFLAG | Total packets | Discarded packets |
| A | 0 | 130 | 0 |
| B | 0 | 130 | 0 |
| C | 0 | 130 | 0 |
| D | 0 | 130 | 0 |
| Quadrant | Total seconds | Saturated seconds | Saturation percentage |
|---|---|---|---|
| A | 6393 | 126 | 1.970906% |
| B | 6393 | 68 | 1.063663% |
| C | 6393 | 3032 | 47.426873% |
| D | 6393 | 181 | 2.831222% |
Noise dominated data is calculated using 1-second bins in cleaned event files. If a bin has >2000 counts, and if more than 50% of those come from <1% of pixels, then it is considered to be noise-dominated and hence unusable.
| Quadrant | # 1 sec bins | Bins with >0 counts | Bins with >2000 counts | High rate bins dominated by noise | Noise dominated (total time) | Noise dominated (detector-on time) | Marked lightcurve |
|---|---|---|---|---|---|---|---|
| A | 7627 | 6392 | 51 | 51 | 0.67% | 0.80% | 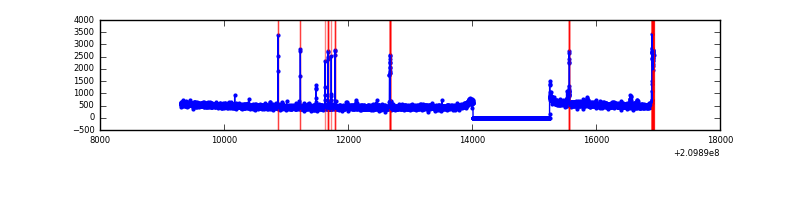 |
| B | 7628 | 6393 | 2 | 2 | 0.03% | 0.03% | 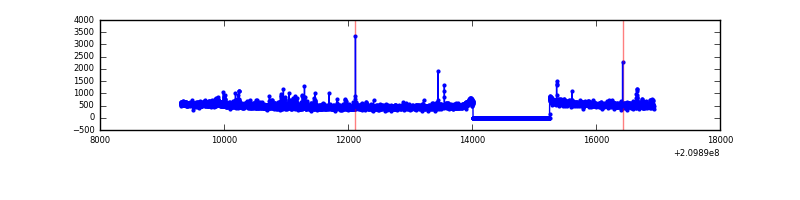 |
| C | 7628 | 6393 | 2987 | 2987 | 39.16% | 46.72% | 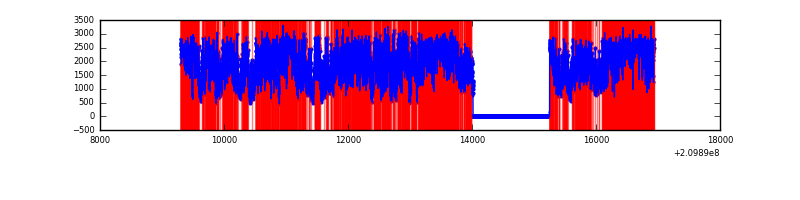 |
| D | 7628 | 6393 | 108 | 108 | 1.42% | 1.69% | 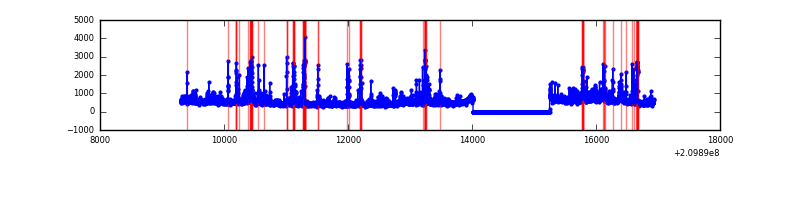 |
Top three noisy pixels from each quadrant. If the there are fewer than three noisy pixels in the level2.evt file, extra rows are filled as -1
| Pixel properties | Quadrant properties | ||||||
|---|---|---|---|---|---|---|---|
| Quadrant | DetID | PixID | Counts | Sigma | Mean | Median | Sigma |
| A | 0 | 31 | 132009 | 833.14 | 783 | 766 | 157.5 |
| A | 0 | 50 | 39119 | 243.47 | 783 | 766 | 157.5 |
| A | 13 | 251 | 36143 | 224.58 | 783 | 766 | 157.5 |
| B | 4 | 80 | 55095 | 371.9 | 784 | 768 | 146.1 |
| B | 15 | 204 | 54566 | 368.28 | 784 | 768 | 146.1 |
| B | 0 | 219 | 33109 | 221.39 | 784 | 768 | 146.1 |
| C | 9 | 247 | 9494988 | 64461.03 | 651 | 655 | 147.3 |
| C | 1 | 16 | 38115 | 254.33 | 651 | 655 | 147.3 |
| C | 13 | 61 | 5393 | 32.17 | 651 | 655 | 147.3 |
| D | 2 | 33 | 237744 | 1307.98 | 759 | 738 | 181.2 |
| D | 13 | 53 | 218692 | 1202.84 | 759 | 738 | 181.2 |
| D | 12 | 233 | 160216 | 880.12 | 759 | 738 | 181.2 |
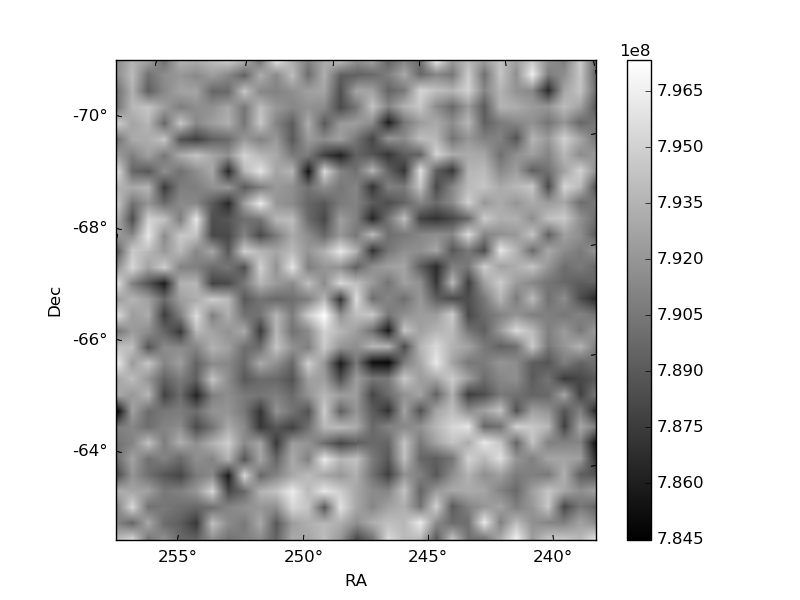
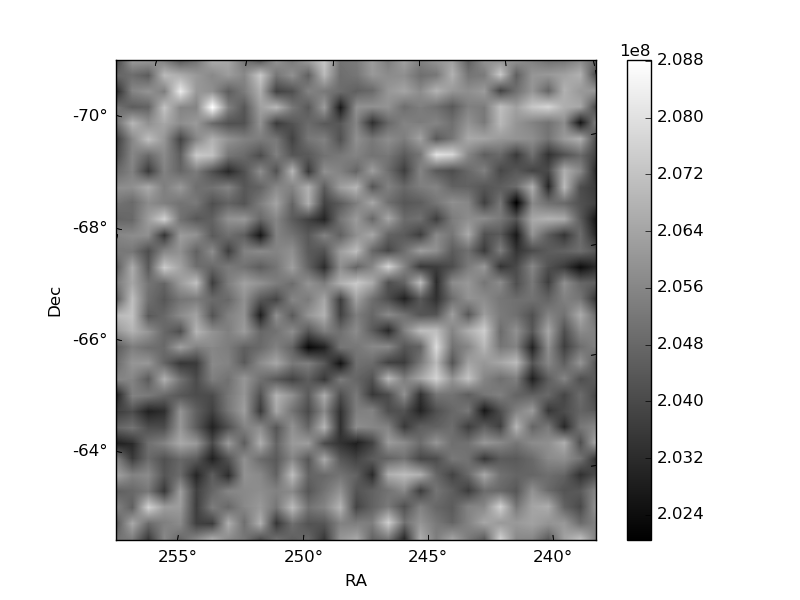
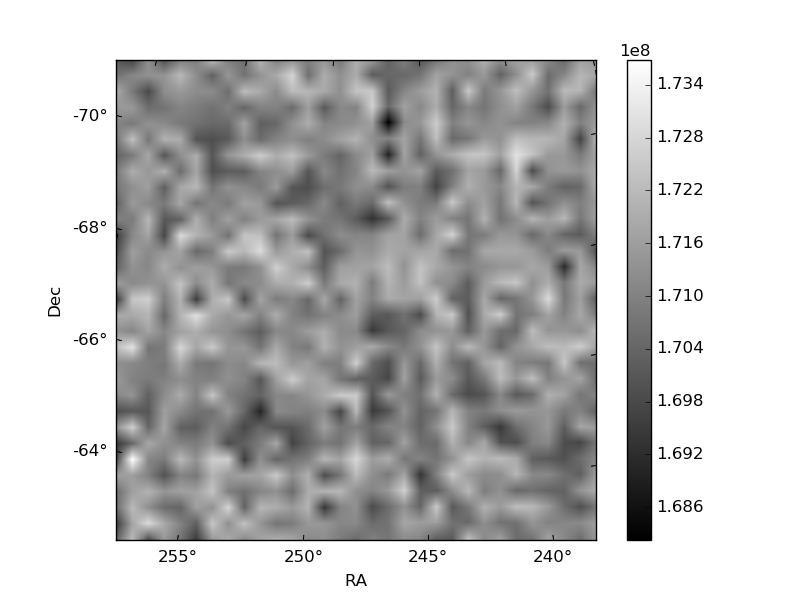
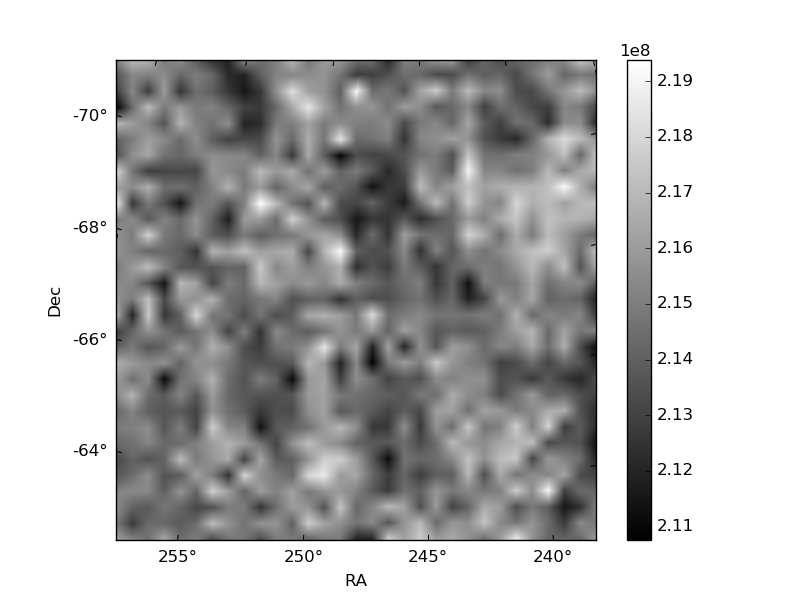
Histogram calculated using DETX and DETY for each event in the final _common_clean file
| Quadrant A | 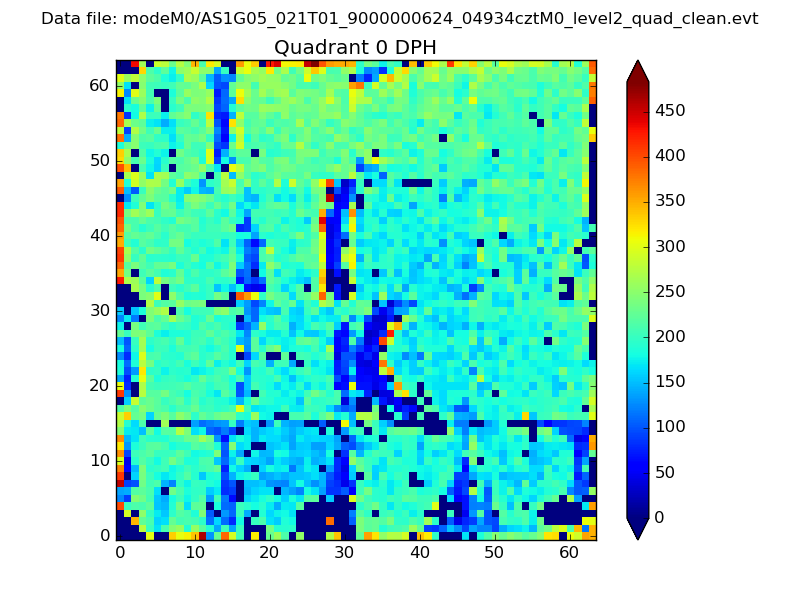 |
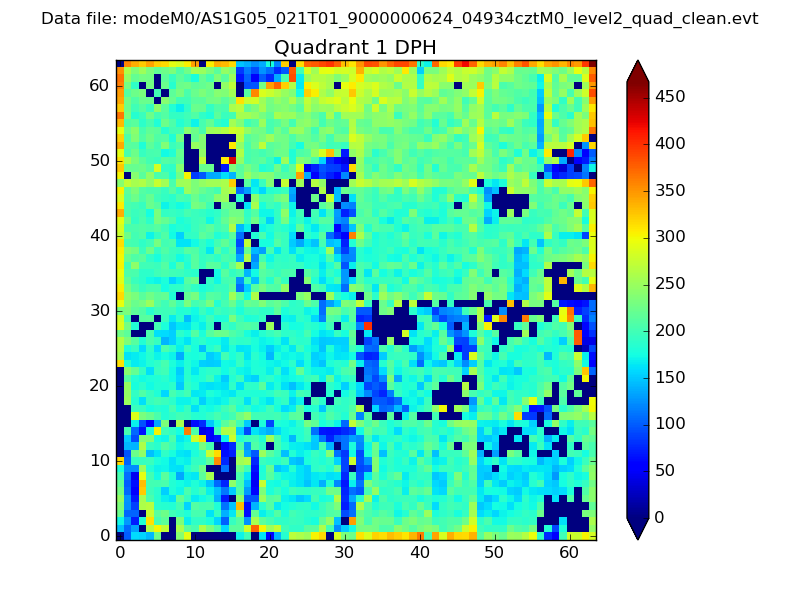 |
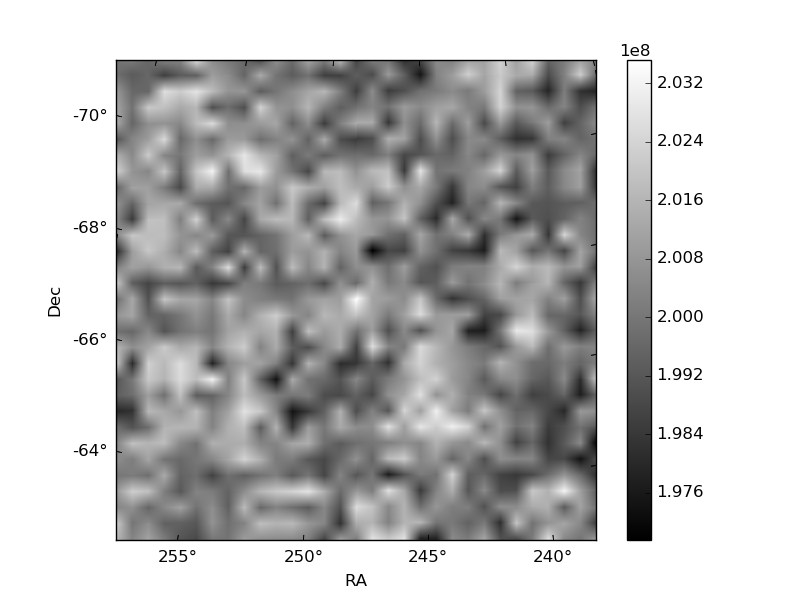
Quadrant B |
|---|---|---|---|
| Quadrant D | 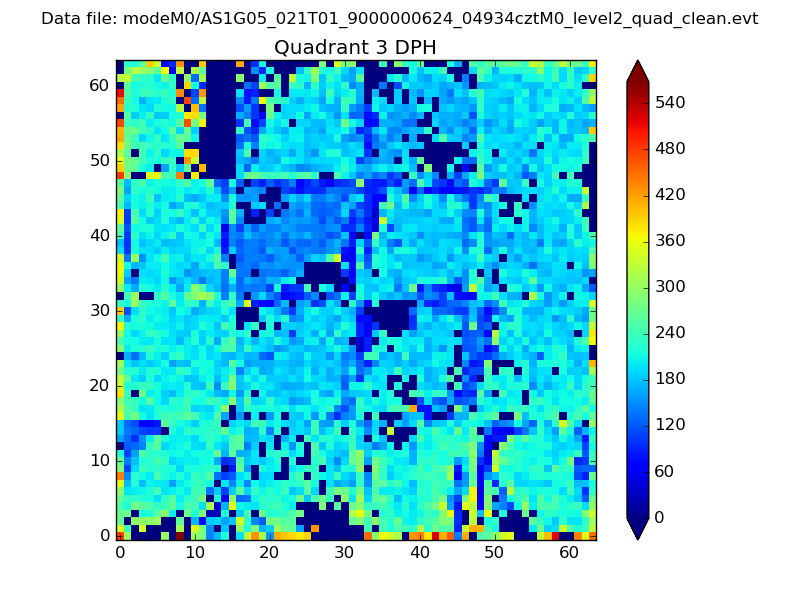 |
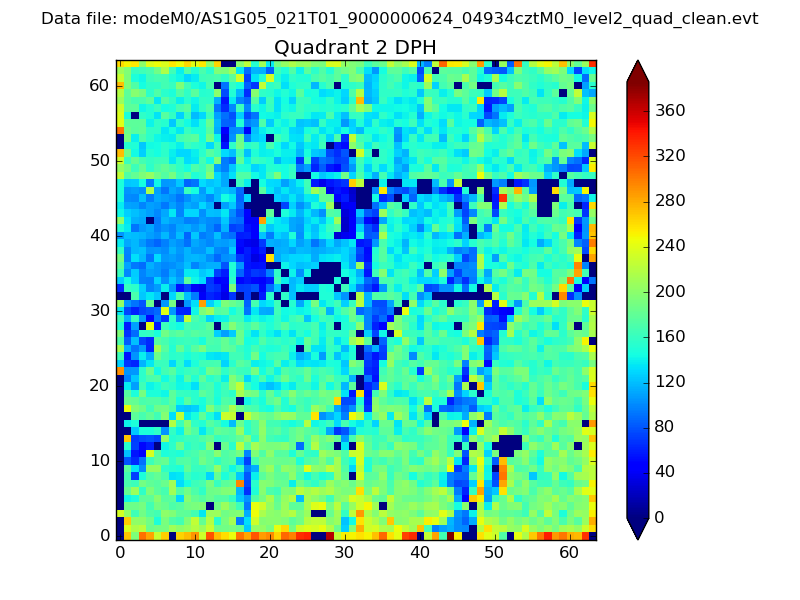 |
Quadrant C |
| Plot type | Count rate plots | Images |
|---|---|---|
| Comparison with Poisson distribution Blue bars denote a histogram of data divided into 1 sec bins. Red curve is a Poisson curve with rate = median count rate of data. |
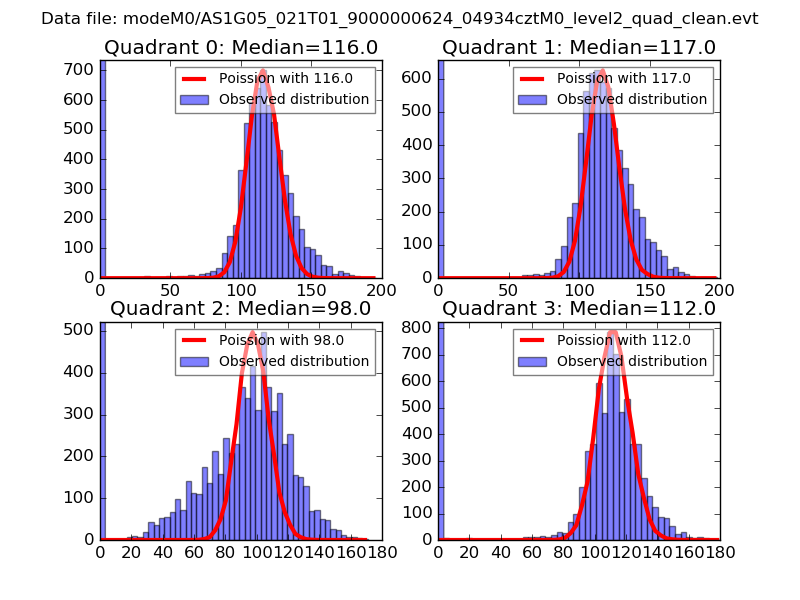 |
 |
| Quadrant-wise count rates Data is divided into 100 sec bins |
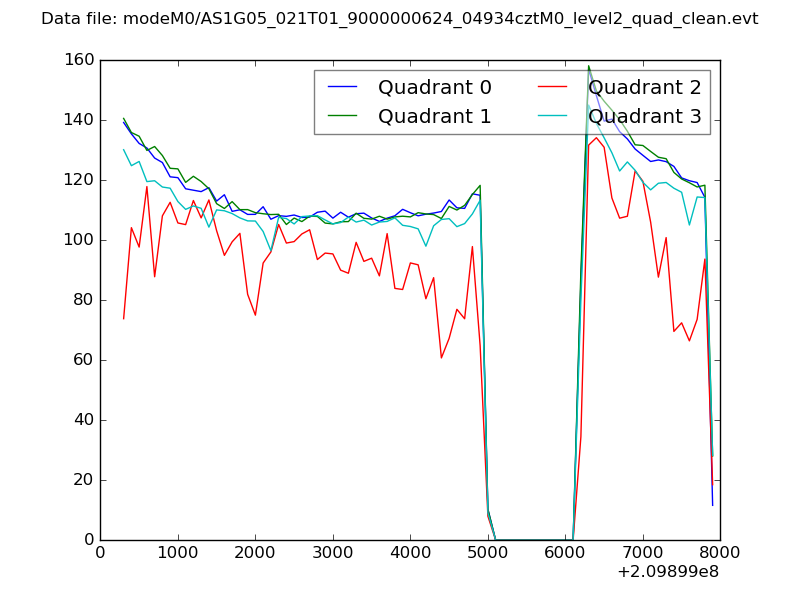 |
|
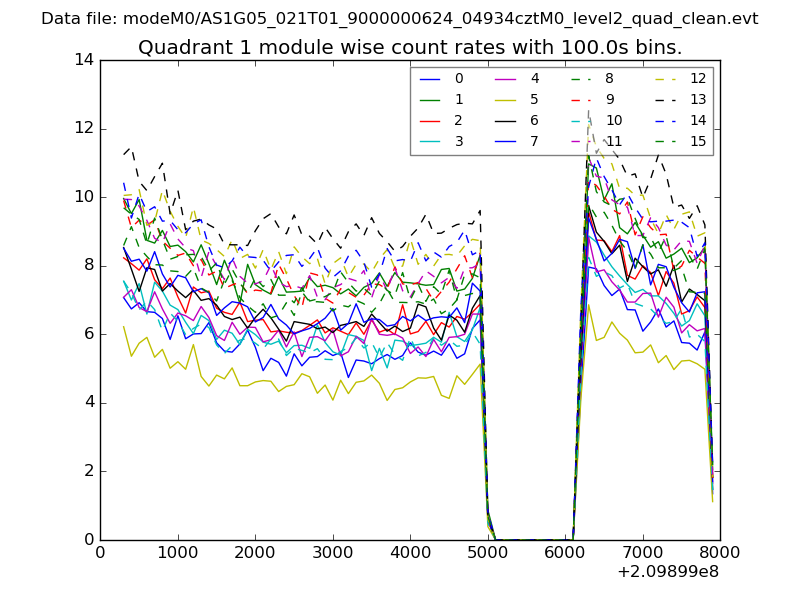
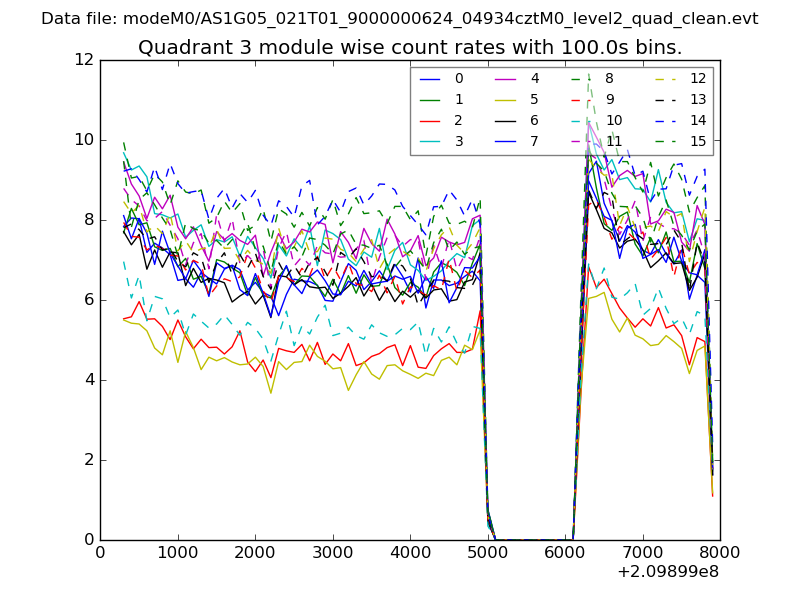
| Module-wise count rates for Quadrant A Data is divided into 100 sec bins |
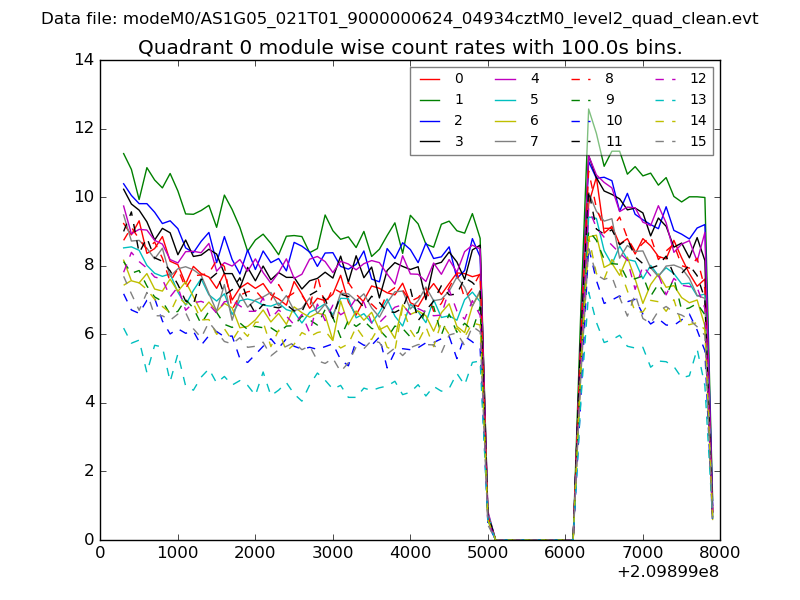 |
 |
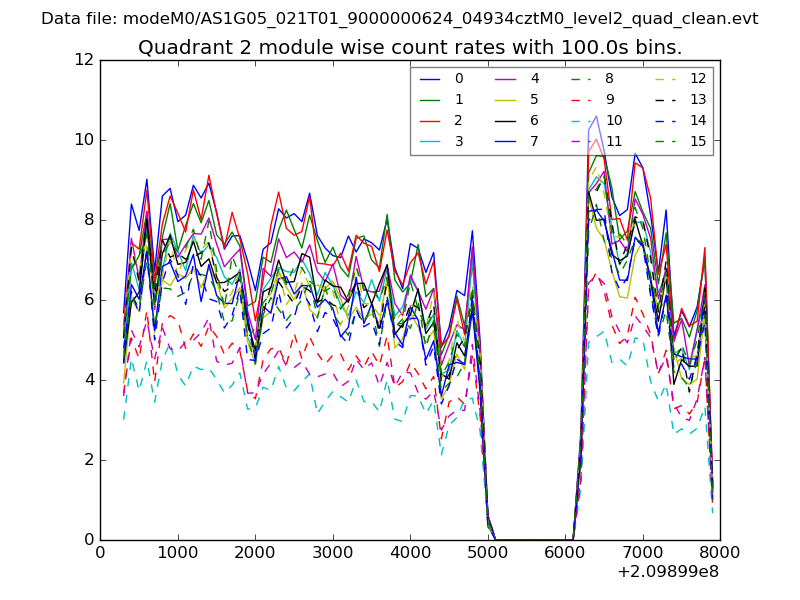
| Module-wise count rates for Quadrant B Data is divided into 100 sec bins |
 |
 |
| Module-wise count rates for Quadrant C Data is divided into 100 sec bins |
 |
 |
| Module-wise count rates for Quadrant D Data is divided into 100 sec bins |
 |
 |
| Parameter | Plot |
|---|---|
| CZT HV Monitor | 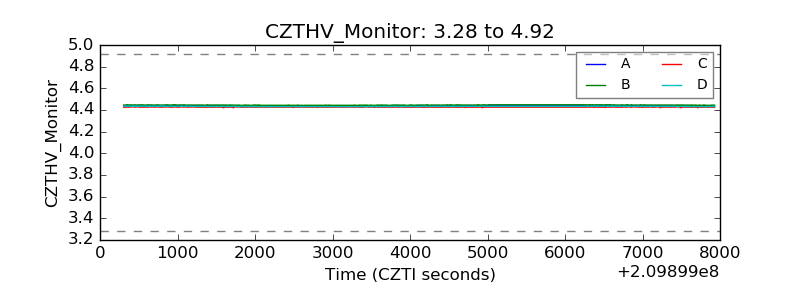 |
| D_VDD |  |
| Temperature 1 | 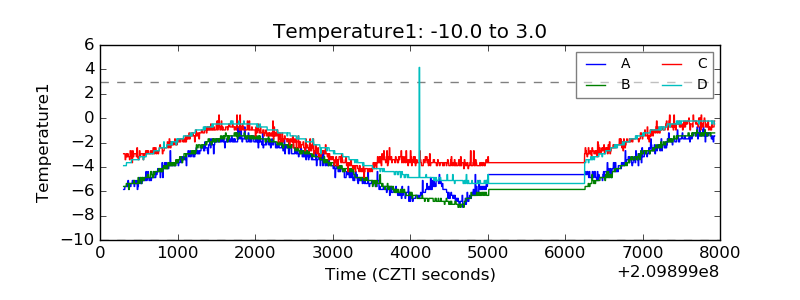 |
| Veto HV Monitor | 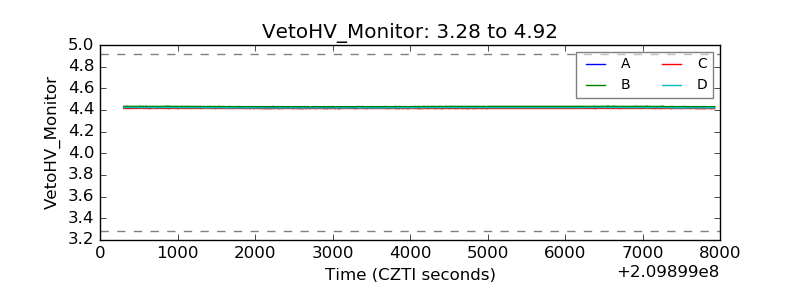 |
| Veto LLD | 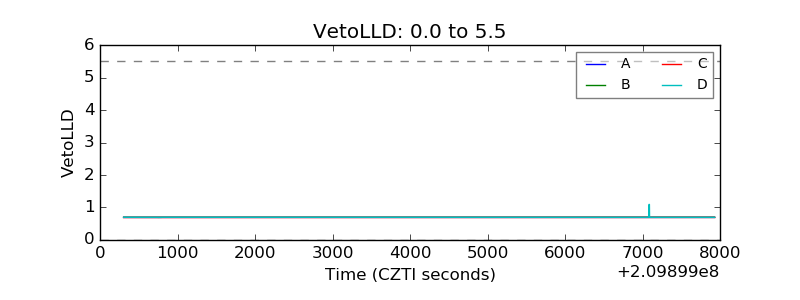 |
| Alpha Counter | 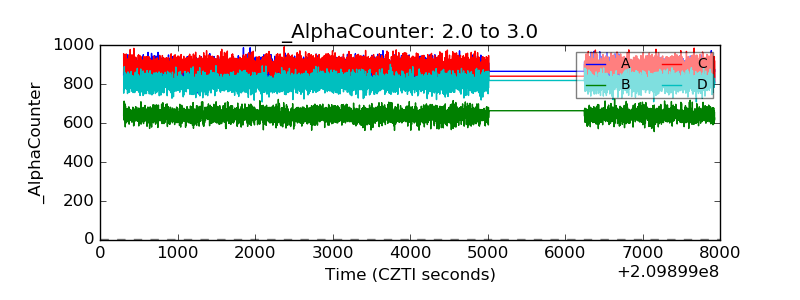 |
| _CPM_Rate | 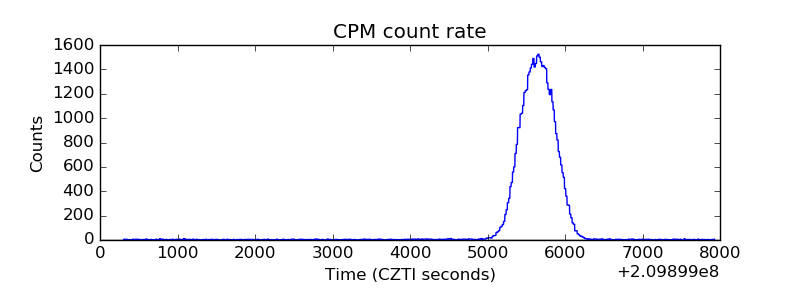 |
| CZT Counter | 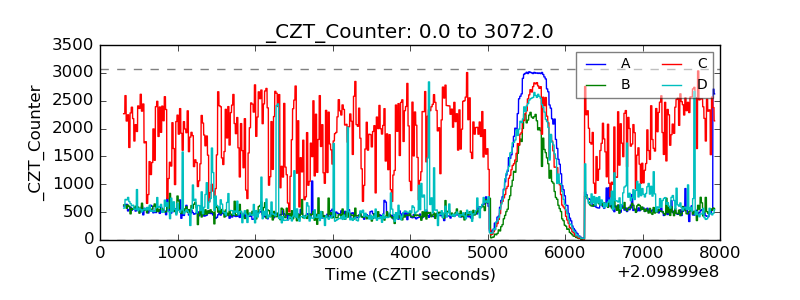 |
| +2.5 Volts monitor |  |
| +5 Volts monitor |  |
| _ROLL_ROT | 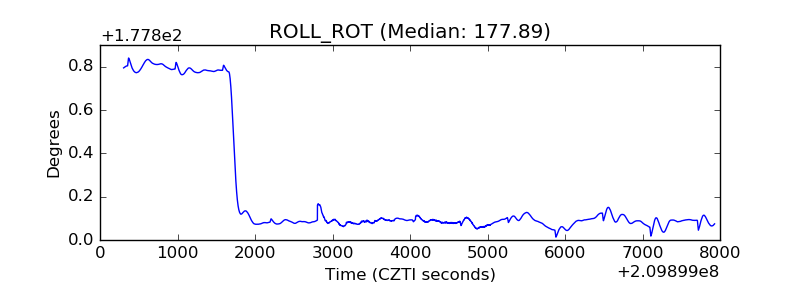 |
| _Roll_DEC | 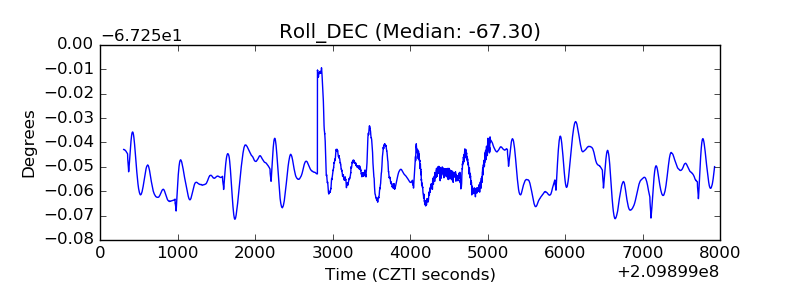 |
| _Roll_RA | 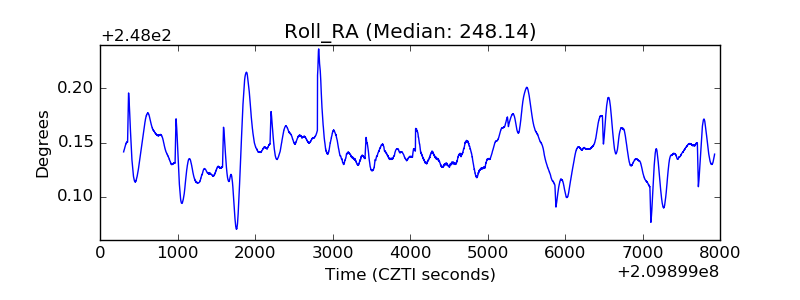 |
| Veto Counter | 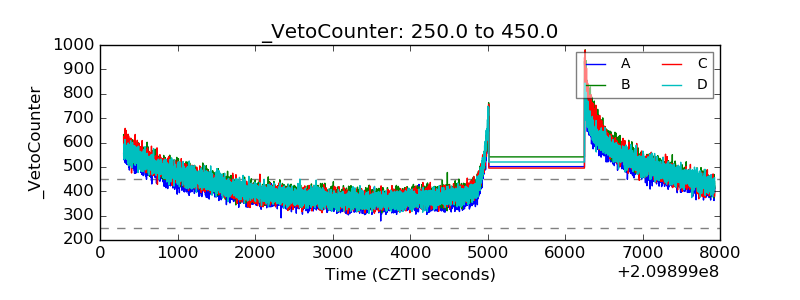 |