| Param | Original file | Final file |
|---|---|---|
| Filename | modeM0/AS1G05_021T01_9000000624_04935cztM0_level2.evt | modeM0/AS1G05_021T01_9000000624_04935cztM0_level2_quad_clean.evt |
| Size (bytes) | 837,544,320 | 97,009,920 |
| Size | 798.7 MB | 92.5 MB |
| Events in quadrant A | 7,685,560 | 509,982 |
| Events in quadrant B | 3,055,666 | 717,860 |
| Events in quadrant C | 10,081,960 | 602,151 |
| Events in quadrant D | 4,130,752 | 679,796 |
| Mode M9 | |||
|---|---|---|---|
| Quadrant | BADHDUFLAG | Total packets | Discarded packets |
| A | 0 | 13 | 0 |
| B | 0 | 13 | 0 |
| C | 0 | 13 | 0 |
| D | 0 | 13 | 0 |
| Mode M0 | |||
|---|---|---|---|
| Quadrant | BADHDUFLAG | Total packets | Discarded packets |
| A | 0 | 26939 | 2 |
| B | 0 | 13009 | 1 |
| C | 0 | 34171 | 1 |
| D | 0 | 16446 | 1 |
| Mode SS | |||
|---|---|---|---|
| Quadrant | BADHDUFLAG | Total packets | Discarded packets |
| A | 0 | 124 | 0 |
| B | 0 | 124 | 0 |
| C | 0 | 124 | 0 |
| D | 0 | 124 | 0 |
| Quadrant | Total seconds | Saturated seconds | Saturation percentage |
|---|---|---|---|
| A | 6101 | 2175 | 35.649893% |
| B | 6101 | 63 | 1.032618% |
| C | 6101 | 2191 | 35.912146% |
| D | 6101 | 242 | 3.966563% |
Noise dominated data is calculated using 1-second bins in cleaned event files. If a bin has >2000 counts, and if more than 50% of those come from <1% of pixels, then it is considered to be noise-dominated and hence unusable.
| Quadrant | # 1 sec bins | Bins with >0 counts | Bins with >2000 counts | High rate bins dominated by noise | Noise dominated (total time) | Noise dominated (detector-on time) | Marked lightcurve |
|---|---|---|---|---|---|---|---|
| A | 7405 | 6100 | 2078 | 2078 | 28.06% | 34.07% | 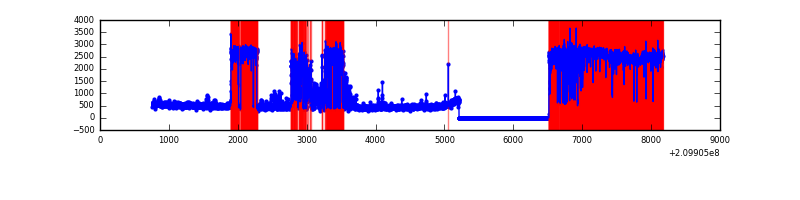 |
| B | 7406 | 6101 | 7 | 7 | 0.09% | 0.11% | 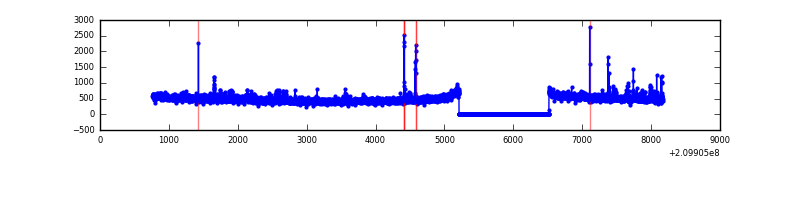 |
| C | 7406 | 6101 | 2183 | 2183 | 29.48% | 35.78% | 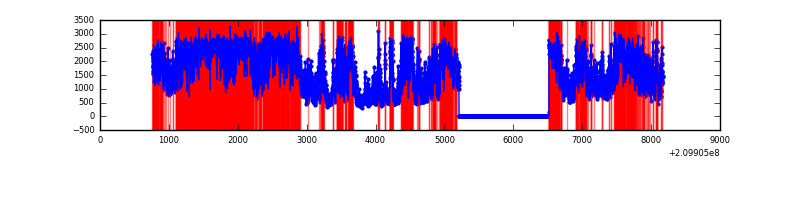 |
| D | 7406 | 6101 | 194 | 194 | 2.62% | 3.18% | 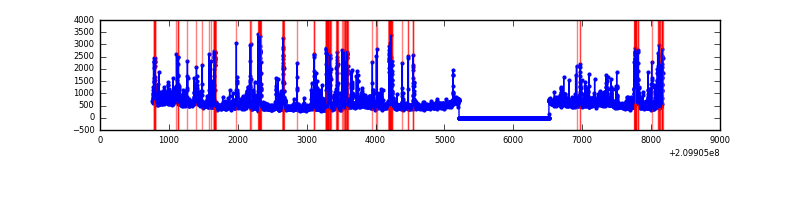 |
Top three noisy pixels from each quadrant. If the there are fewer than three noisy pixels in the level2.evt file, extra rows are filled as -1
| Pixel properties | Quadrant properties | ||||||
|---|---|---|---|---|---|---|---|
| Quadrant | DetID | PixID | Counts | Sigma | Mean | Median | Sigma |
| A | 0 | 31 | 5529002 | 50502.23 | 543 | 531 | 109.5 |
| A | 13 | 251 | 26229 | 234.75 | 543 | 531 | 109.5 |
| A | 0 | 50 | 19484 | 173.13 | 543 | 531 | 109.5 |
| B | 15 | 204 | 44262 | 312.19 | 739 | 723 | 139.5 |
| B | 4 | 80 | 38504 | 270.9 | 739 | 723 | 139.5 |
| B | 0 | 219 | 36279 | 254.95 | 739 | 723 | 139.5 |
| C | 9 | 247 | 7609767 | 53492.84 | 628 | 630 | 142.2 |
| C | 1 | 16 | 12458 | 83.15 | 628 | 630 | 142.2 |
| C | 12 | 4 | 5326 | 33.01 | 628 | 630 | 142.2 |
| D | 2 | 33 | 760223 | 4356.25 | 710 | 688 | 174.4 |
| D | 13 | 53 | 219254 | 1253.57 | 710 | 688 | 174.4 |
| D | 7 | 67 | 103509 | 589.72 | 710 | 688 | 174.4 |
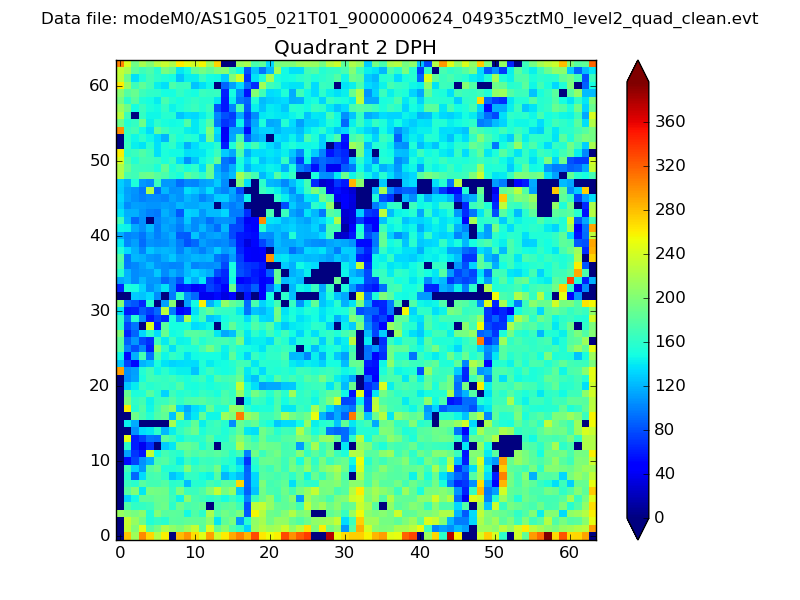
Histogram calculated using DETX and DETY for each event in the final _common_clean file
| Quadrant A | 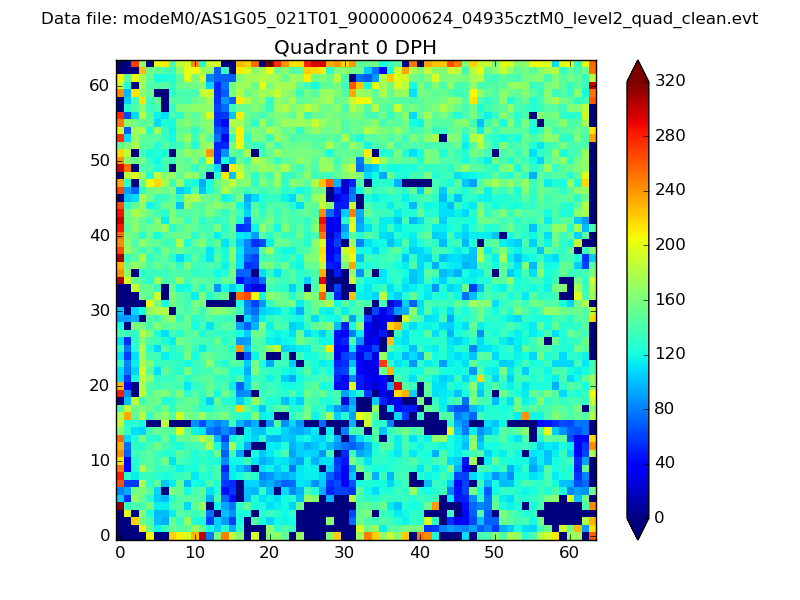 |
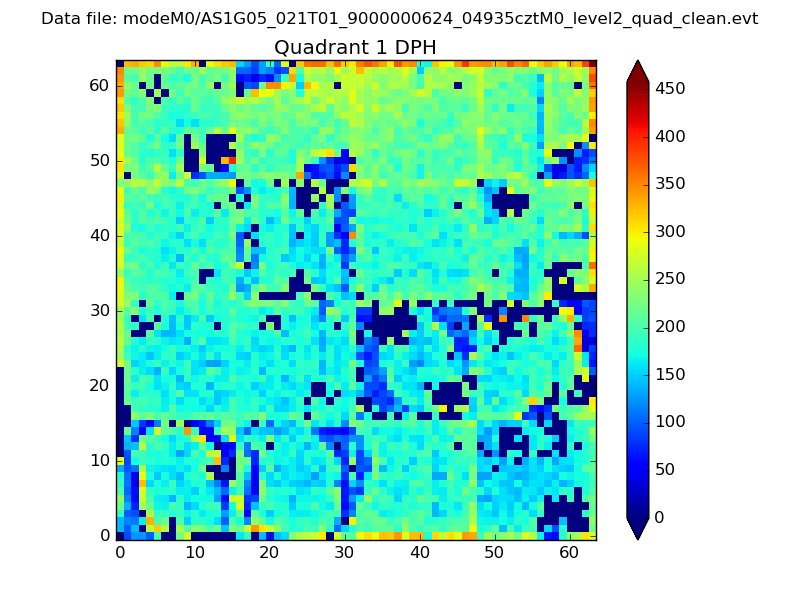 |
Quadrant B |
|---|---|---|---|
| Quadrant D | 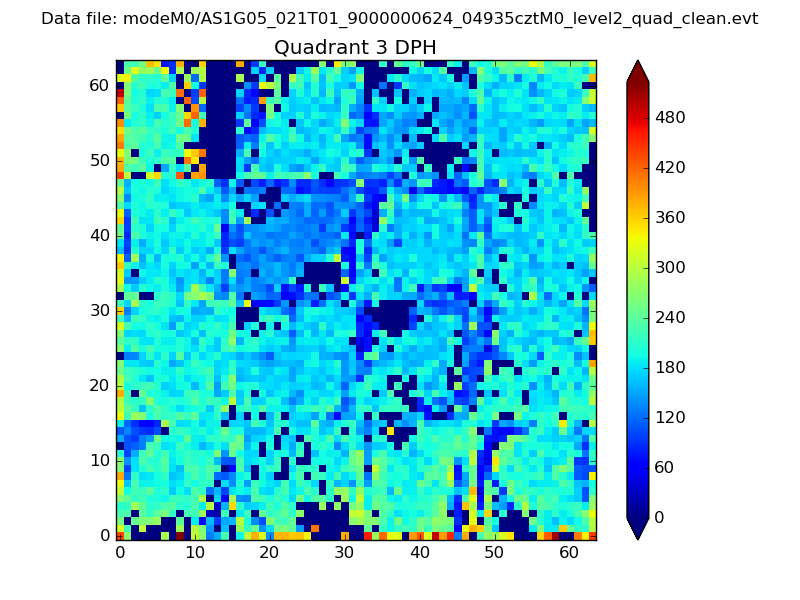 |
 |
Quadrant C |
| Plot type | Count rate plots | Images |
|---|---|---|
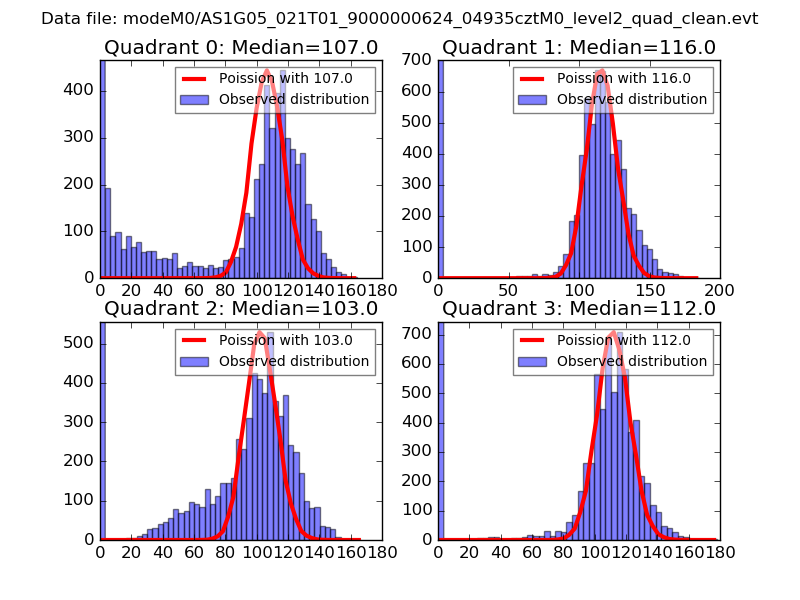
| Comparison with Poisson distribution Blue bars denote a histogram of data divided into 1 sec bins. Red curve is a Poisson curve with rate = median count rate of data. |
 |
 |
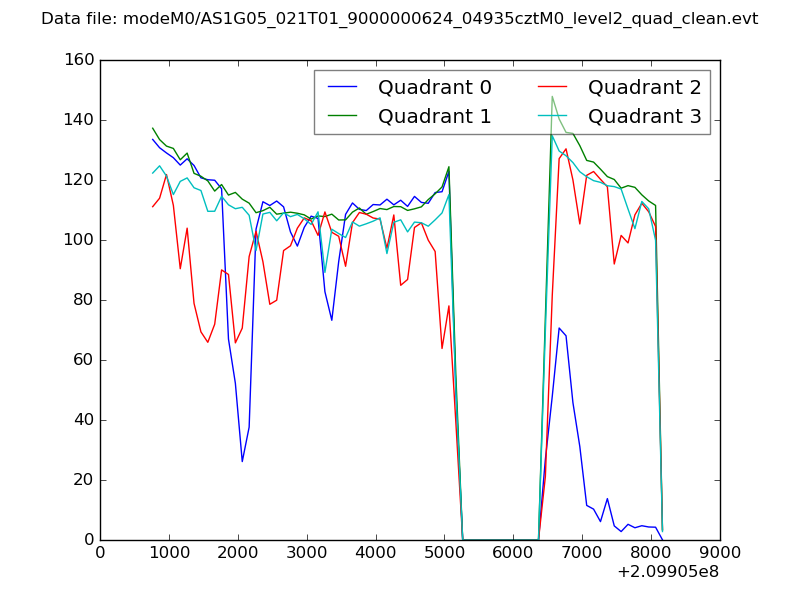
| Quadrant-wise count rates Data is divided into 100 sec bins |
 |
|
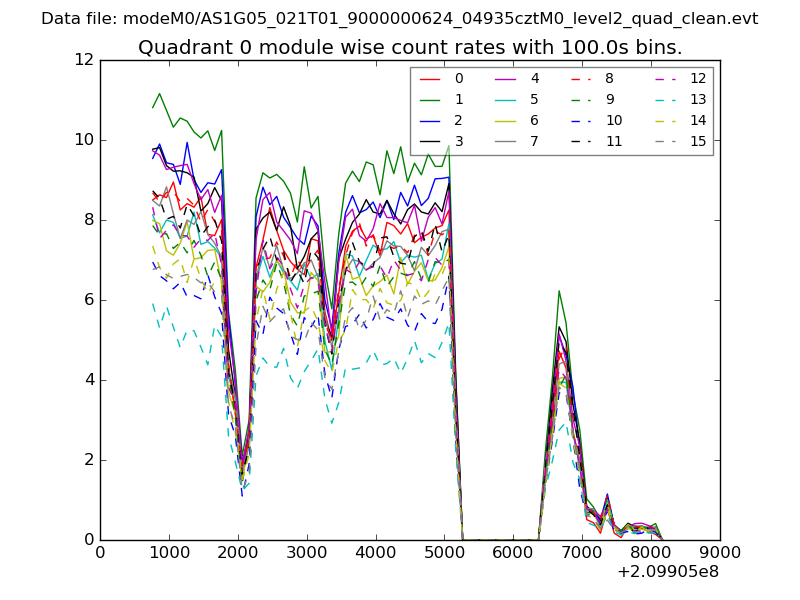
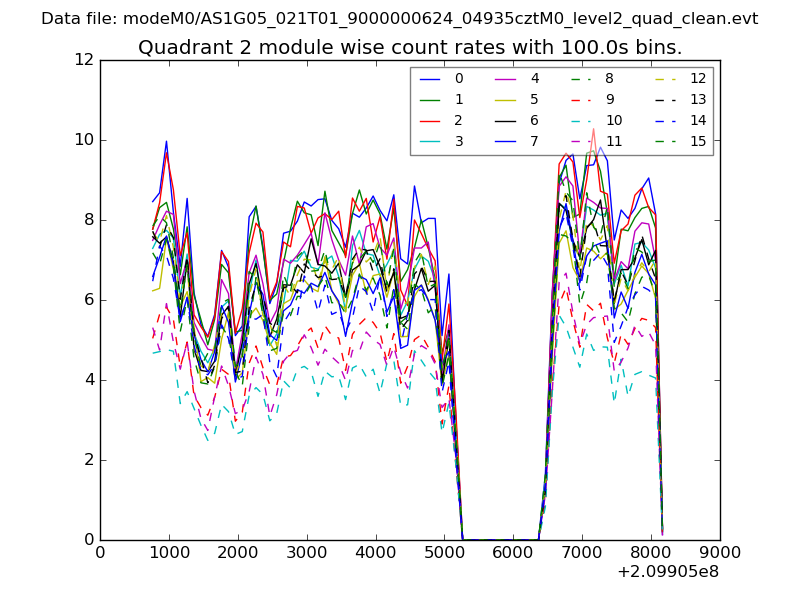
| Module-wise count rates for Quadrant A Data is divided into 100 sec bins |
 |
 |
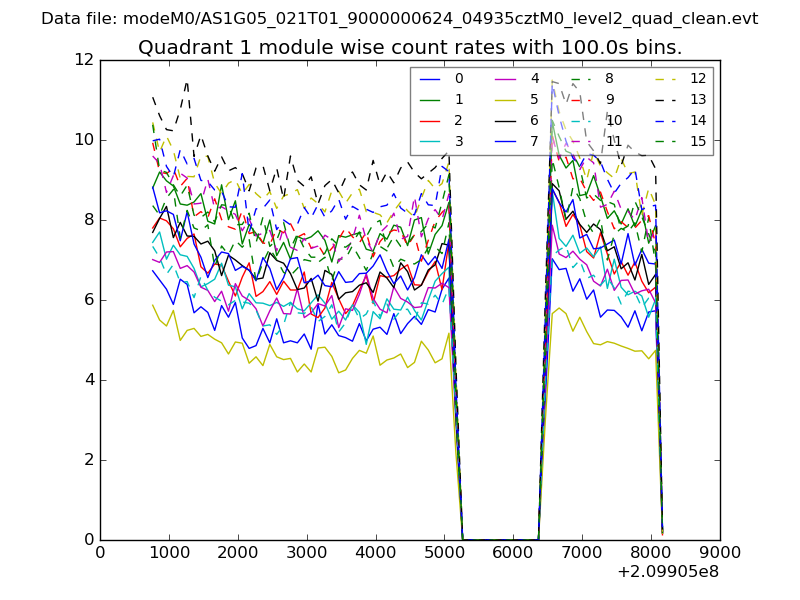
| Module-wise count rates for Quadrant B Data is divided into 100 sec bins |
 |
 |
| Module-wise count rates for Quadrant C Data is divided into 100 sec bins |
 |
 |
| Module-wise count rates for Quadrant D Data is divided into 100 sec bins |
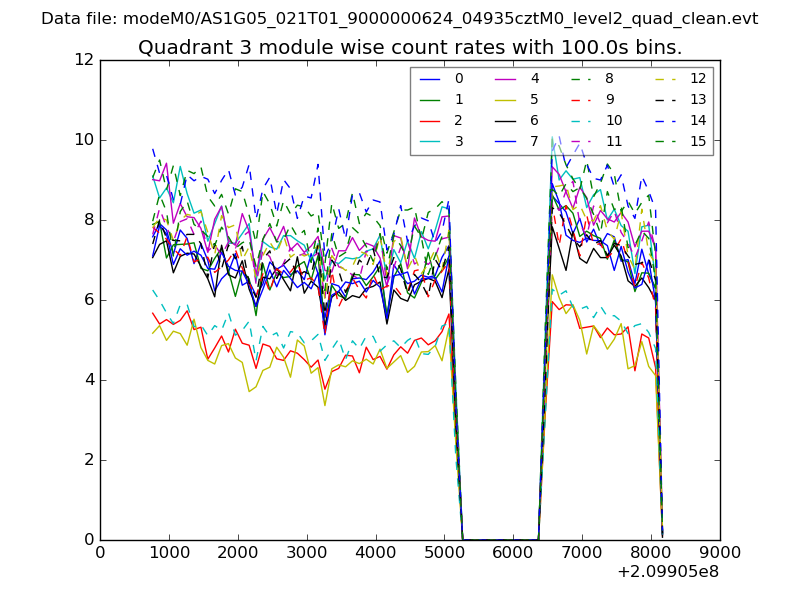 |
 |
| Parameter | Plot |
|---|---|
| CZT HV Monitor | 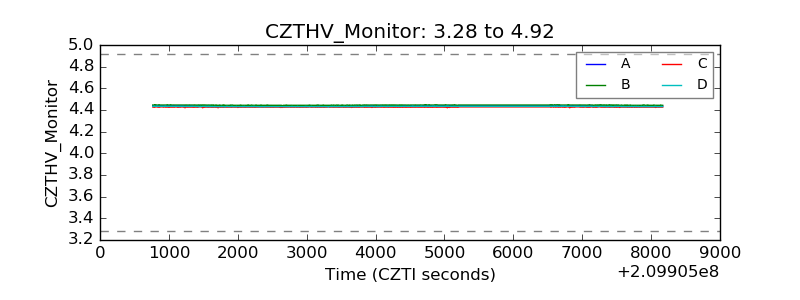 |
| D_VDD | 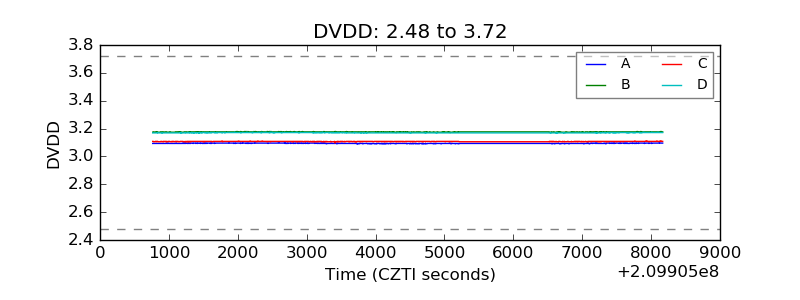 |
| Temperature 1 | 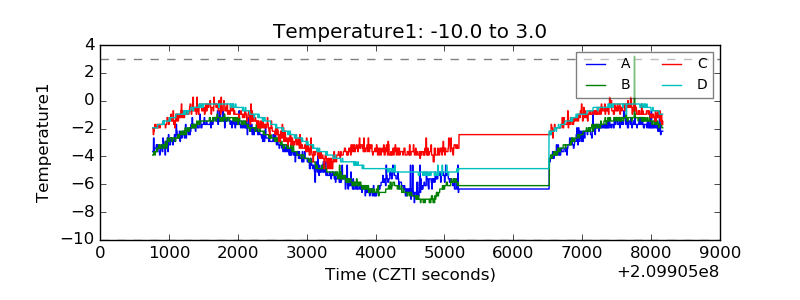 |
| Veto HV Monitor | 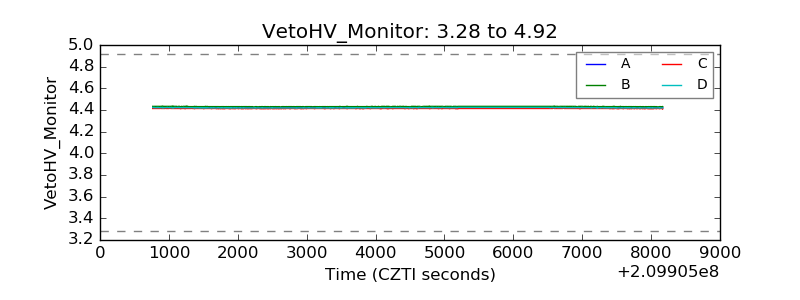 |
| Veto LLD | 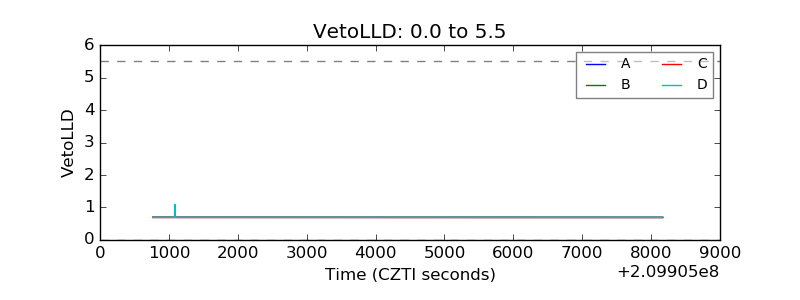 |
| Alpha Counter | 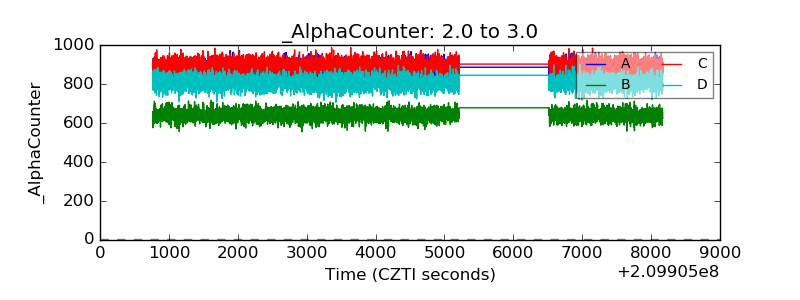 |
| _CPM_Rate |  |
| CZT Counter | 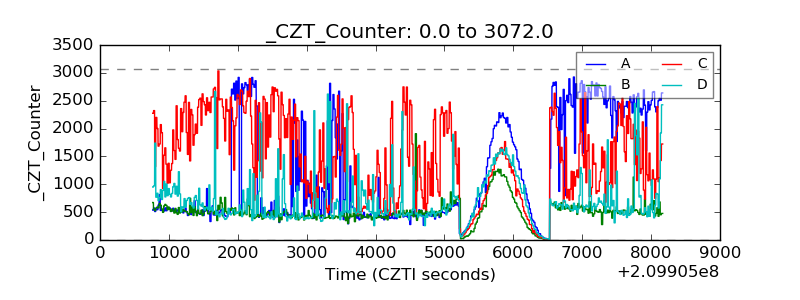 |
| +2.5 Volts monitor |  |
| +5 Volts monitor |  |
| _ROLL_ROT | 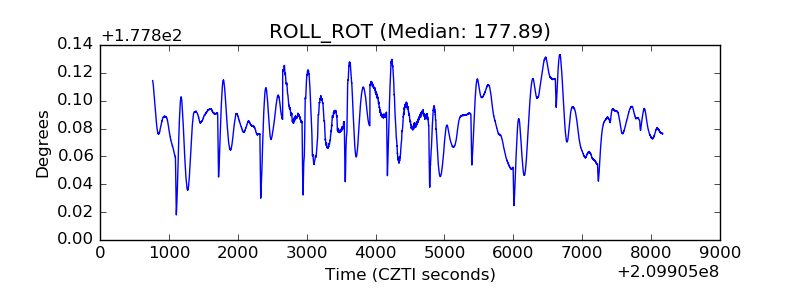 |
| _Roll_DEC | 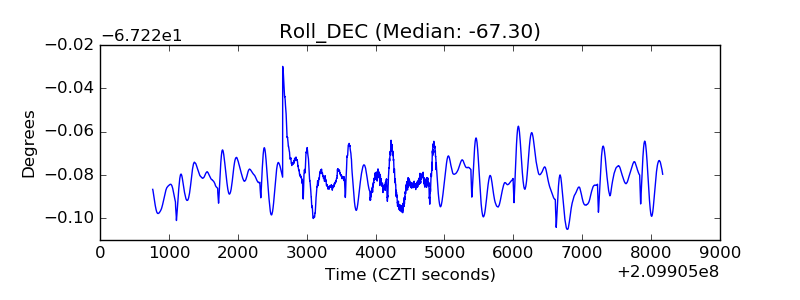 |
| _Roll_RA | 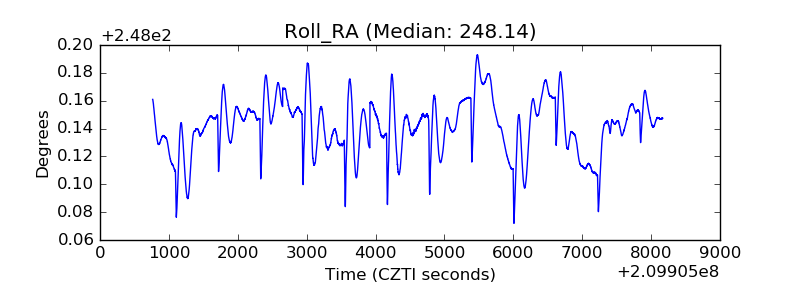 |
| Veto Counter | 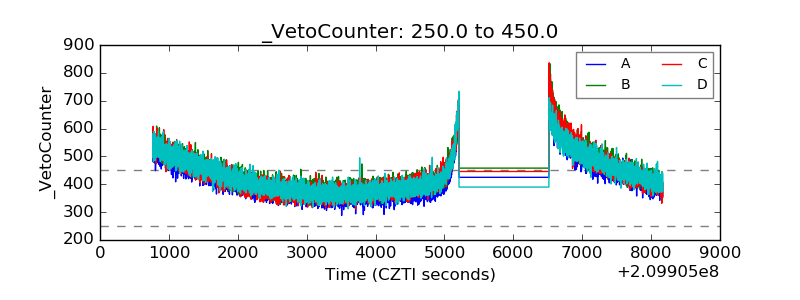 |