| Param | Original file | Final file |
|---|---|---|
| Filename | modeM0/AS1G05_021T01_9000000624_04937cztM0_level2.evt | modeM0/AS1G05_021T01_9000000624_04937cztM0_level2_quad_clean.evt |
| Size (bytes) | 908,720,640 | 85,838,400 |
| Size | 866.6 MB | 81.9 MB |
| Events in quadrant A | 9,950,107 | 387,814 |
| Events in quadrant B | 2,940,973 | 656,132 |
| Events in quadrant C | 10,310,795 | 504,735 |
| Events in quadrant D | 3,909,690 | 623,973 |
| Mode M9 | |||
|---|---|---|---|
| Quadrant | BADHDUFLAG | Total packets | Discarded packets |
| A | 0 | 11 | 0 |
| B | 0 | 11 | 0 |
| C | 0 | 11 | 0 |
| D | 0 | 11 | 0 |
| Mode M0 | |||
|---|---|---|---|
| Quadrant | BADHDUFLAG | Total packets | Discarded packets |
| A | 0 | 33701 | 2 |
| B | 0 | 12837 | 1 |
| C | 0 | 34818 | 1 |
| D | 0 | 15930 | 1 |
| Mode SS | |||
|---|---|---|---|
| Quadrant | BADHDUFLAG | Total packets | Discarded packets |
| A | 0 | 122 | 0 |
| B | 0 | 122 | 0 |
| C | 0 | 122 | 0 |
| D | 0 | 122 | 0 |
| Quadrant | Total seconds | Saturated seconds | Saturation percentage |
|---|---|---|---|
| A | 6072 | 3348 | 55.138340% |
| B | 6072 | 57 | 0.938735% |
| C | 6072 | 2865 | 47.183794% |
| D | 6072 | 243 | 4.001976% |
Noise dominated data is calculated using 1-second bins in cleaned event files. If a bin has >2000 counts, and if more than 50% of those come from <1% of pixels, then it is considered to be noise-dominated and hence unusable.
| Quadrant | # 1 sec bins | Bins with >0 counts | Bins with >2000 counts | High rate bins dominated by noise | Noise dominated (total time) | Noise dominated (detector-on time) | Marked lightcurve |
|---|---|---|---|---|---|---|---|
| A | 7172 | 6072 | 2890 | 2890 | 40.30% | 47.60% | 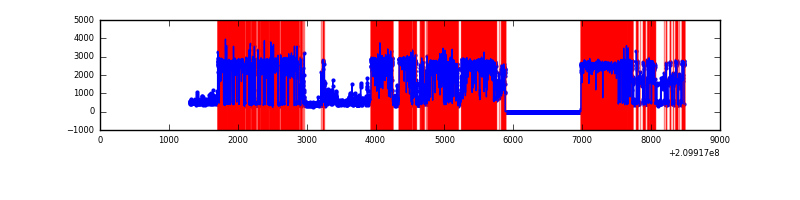 |
| B | 7172 | 6073 | 3 | 3 | 0.04% | 0.05% | 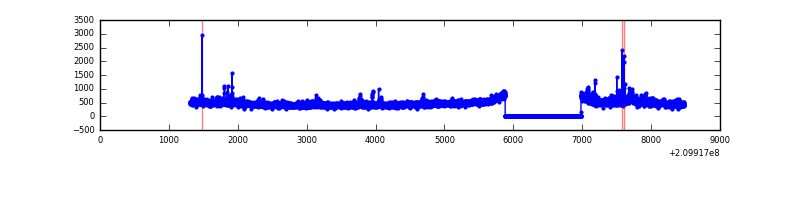 |
| C | 7172 | 6072 | 2861 | 2861 | 39.89% | 47.12% | 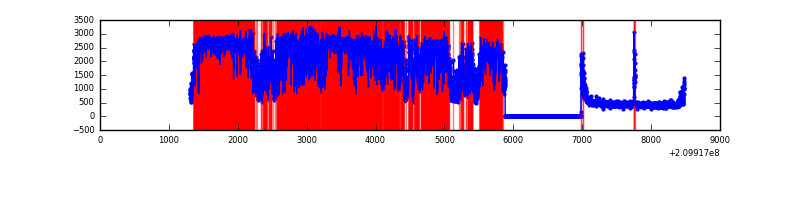 |
| D | 7172 | 6072 | 214 | 214 | 2.98% | 3.52% | 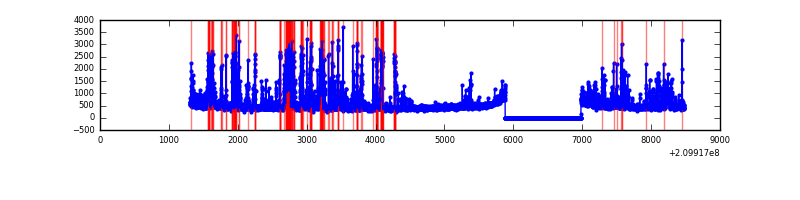 |
Top three noisy pixels from each quadrant. If the there are fewer than three noisy pixels in the level2.evt file, extra rows are filled as -1
| Pixel properties | Quadrant properties | ||||||
|---|---|---|---|---|---|---|---|
| Quadrant | DetID | PixID | Counts | Sigma | Mean | Median | Sigma |
| A | 0 | 31 | 8208121 | 91224.63 | 433 | 425 | 90.0 |
| A | 13 | 251 | 30064 | 329.42 | 433 | 425 | 90.0 |
| A | 0 | 50 | 19767 | 214.98 | 433 | 425 | 90.0 |
| B | 15 | 204 | 109183 | 812.63 | 701 | 685 | 133.5 |
| B | 0 | 219 | 45499 | 335.65 | 701 | 685 | 133.5 |
| B | 0 | 183 | 24672 | 179.66 | 701 | 685 | 133.5 |
| C | 9 | 247 | 8107625 | 64279.41 | 548 | 550 | 126.1 |
| C | 1 | 16 | 52834 | 414.55 | 548 | 550 | 126.1 |
| C | 14 | 67 | 7350 | 53.92 | 548 | 550 | 126.1 |
| D | 2 | 33 | 736167 | 4559.69 | 662 | 642 | 161.3 |
| D | 2 | 136 | 291468 | 1802.9 | 662 | 642 | 161.3 |
| D | 12 | 110 | 152700 | 942.64 | 662 | 642 | 161.3 |
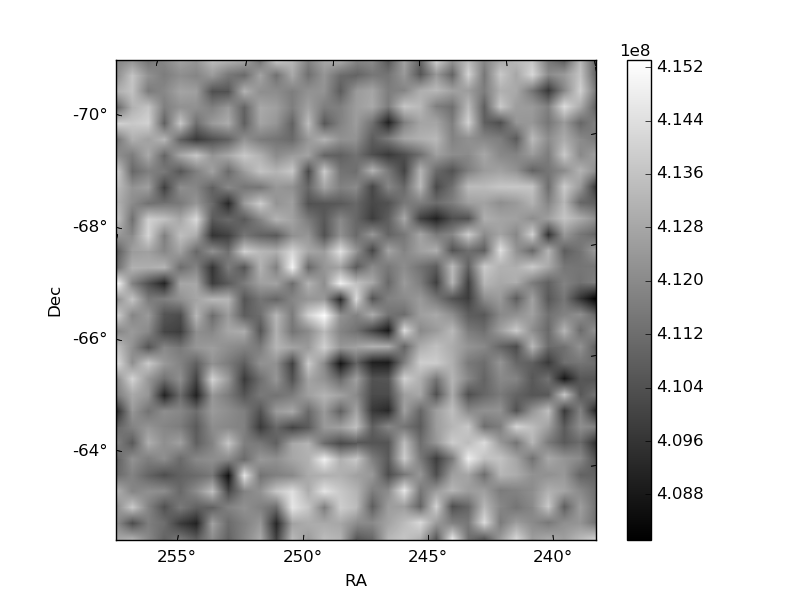
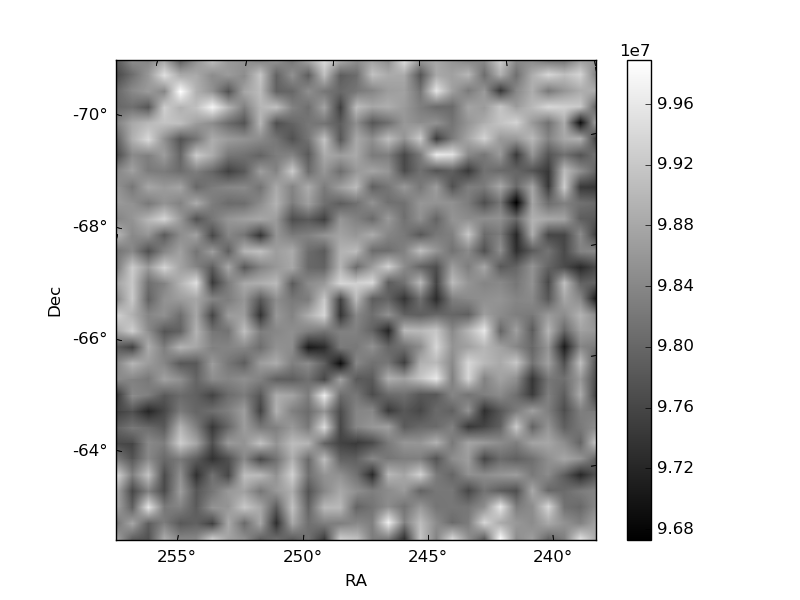
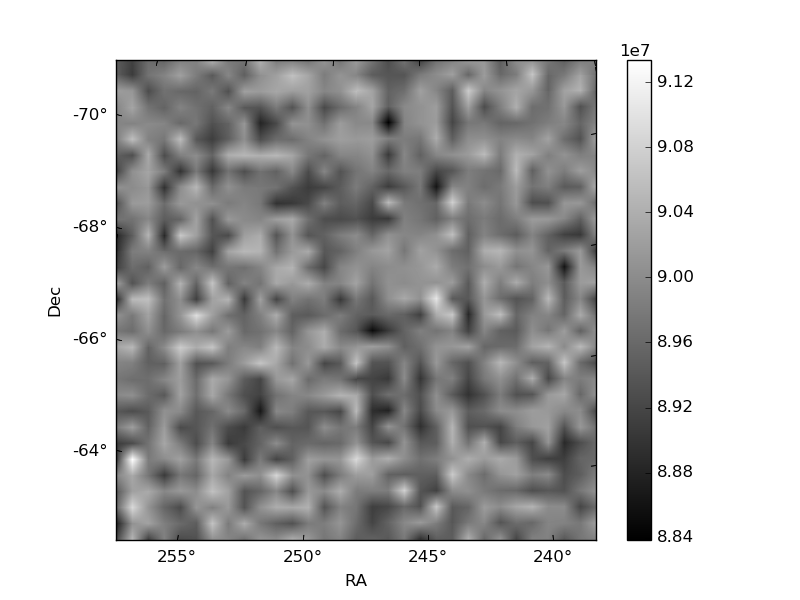
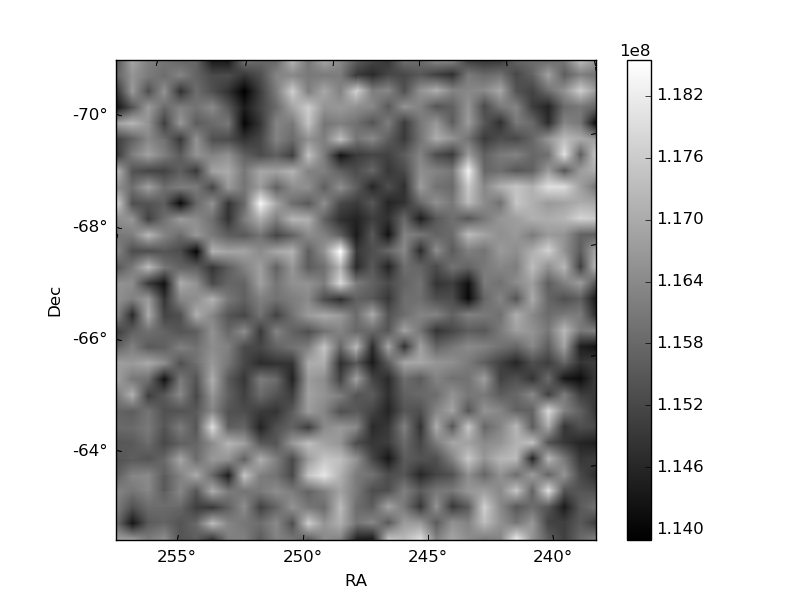
Histogram calculated using DETX and DETY for each event in the final _common_clean file
| Quadrant A | 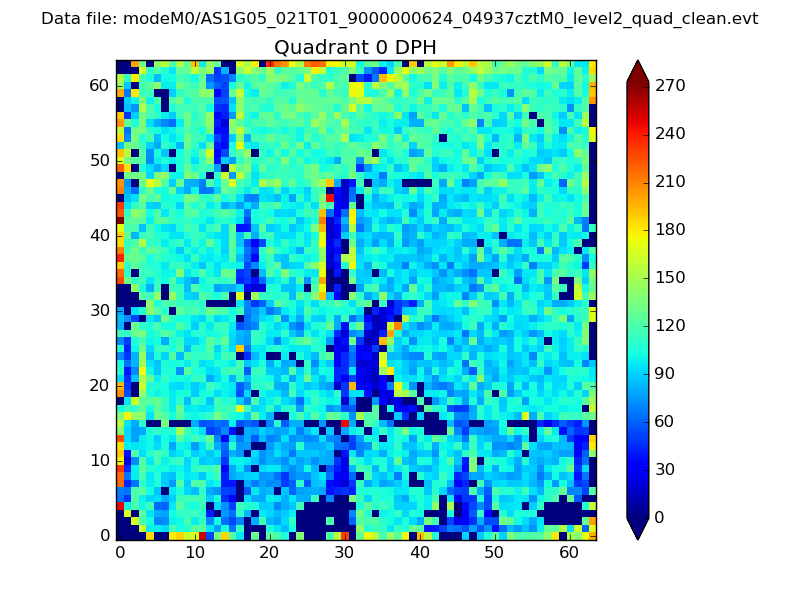 |
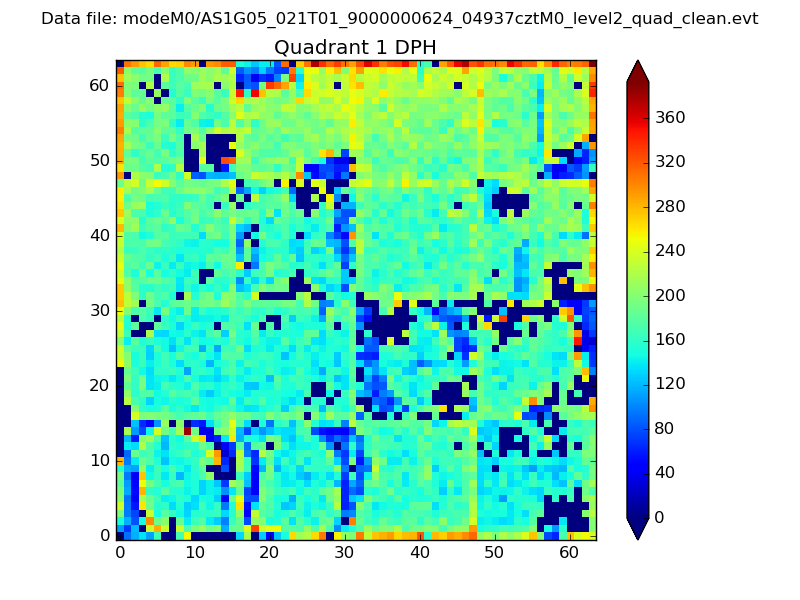 |
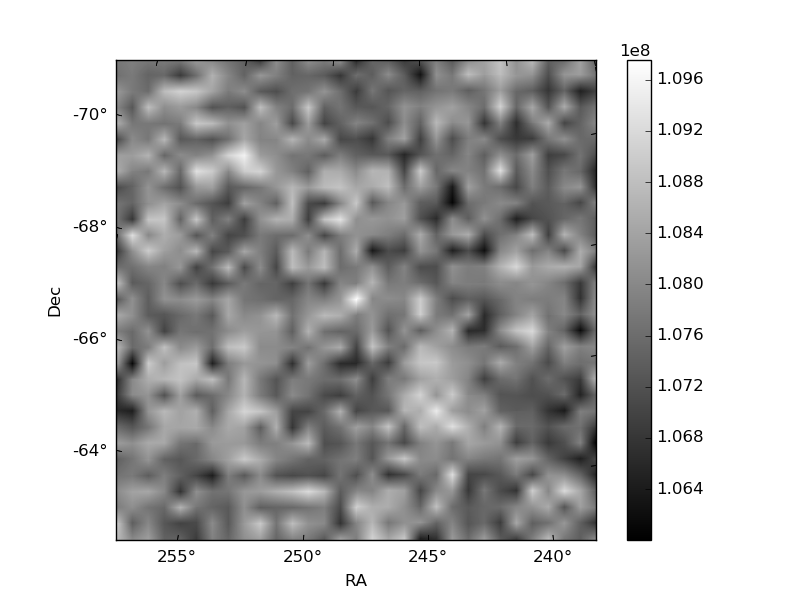
Quadrant B |
|---|---|---|---|
| Quadrant D | 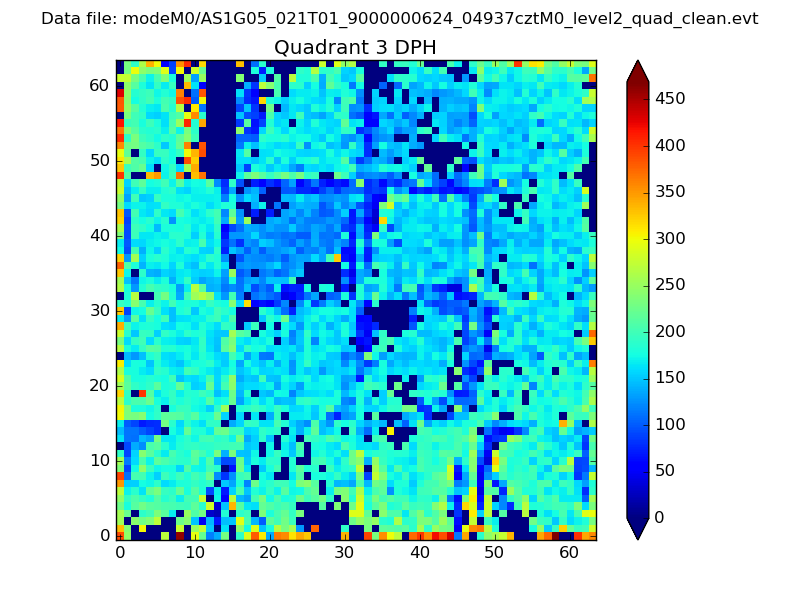 |
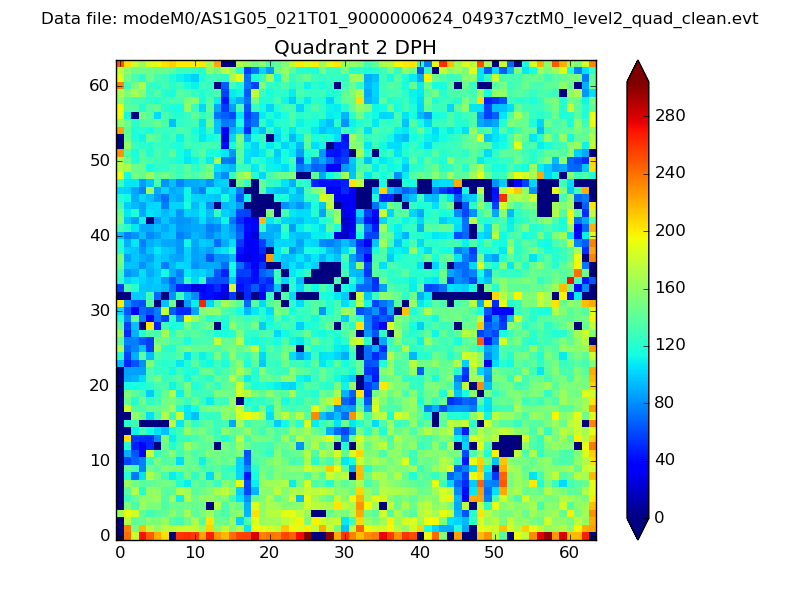 |
Quadrant C |
| Plot type | Count rate plots | Images |
|---|---|---|
| Comparison with Poisson distribution Blue bars denote a histogram of data divided into 1 sec bins. Red curve is a Poisson curve with rate = median count rate of data. |
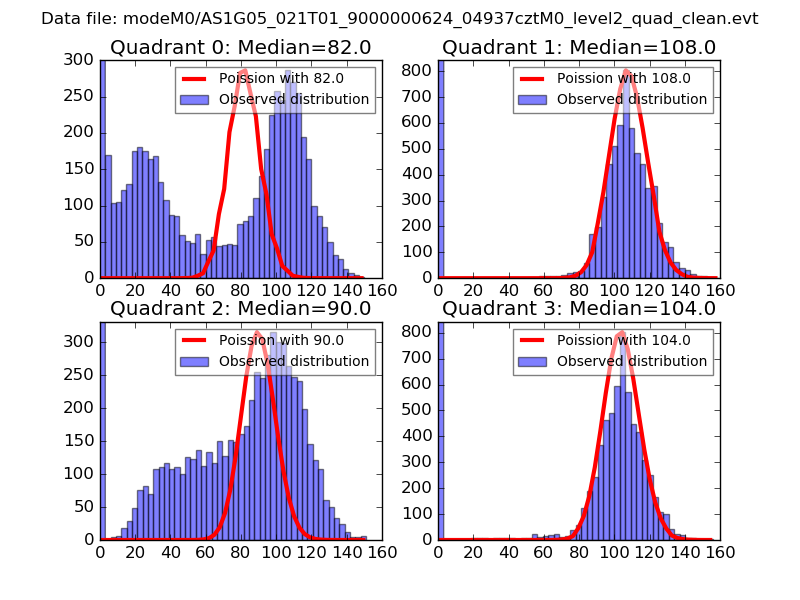 |
 |
| Quadrant-wise count rates Data is divided into 100 sec bins |
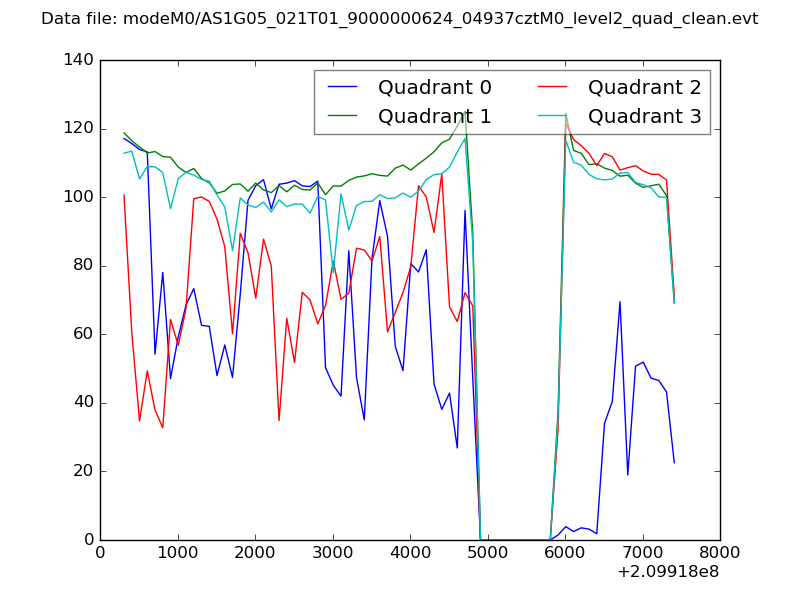 |
|
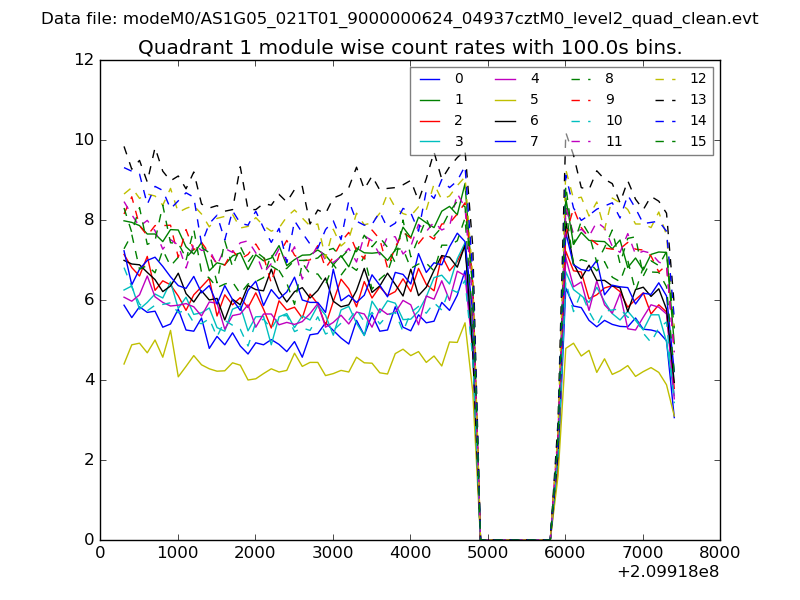
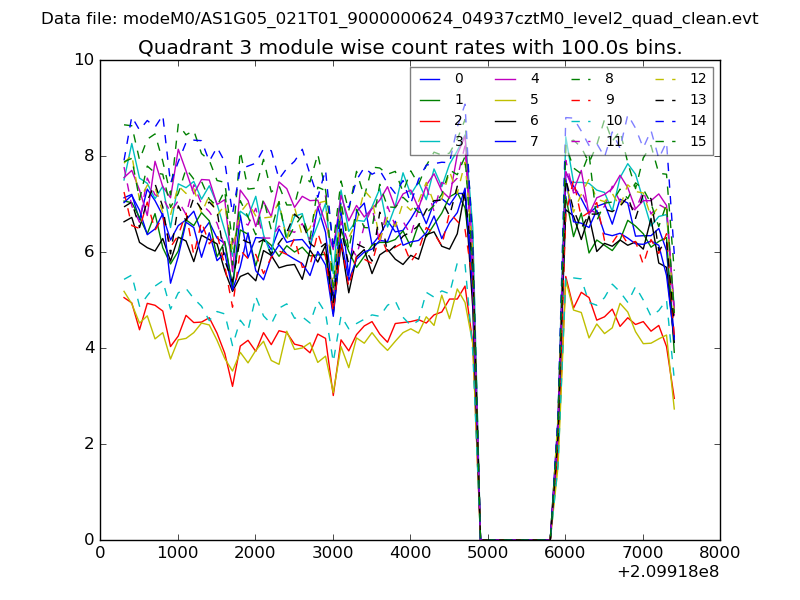
| Module-wise count rates for Quadrant A Data is divided into 100 sec bins |
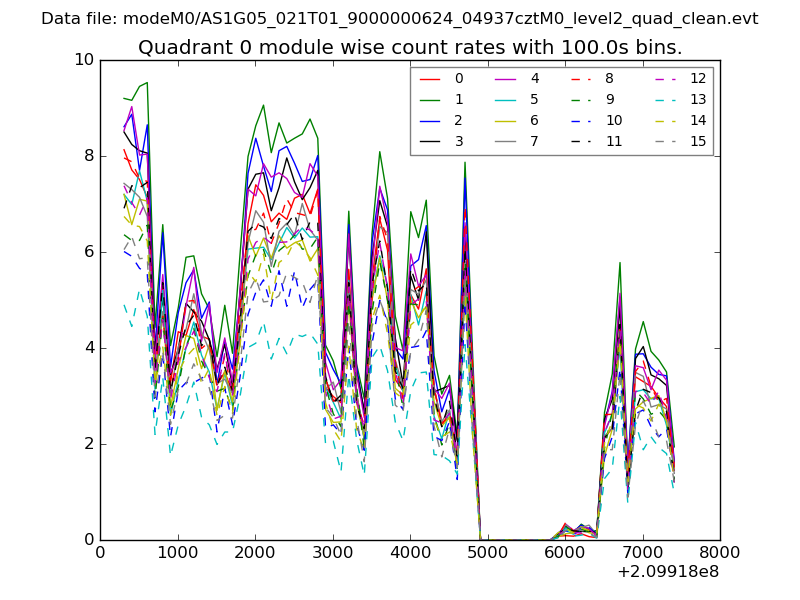 |
 |
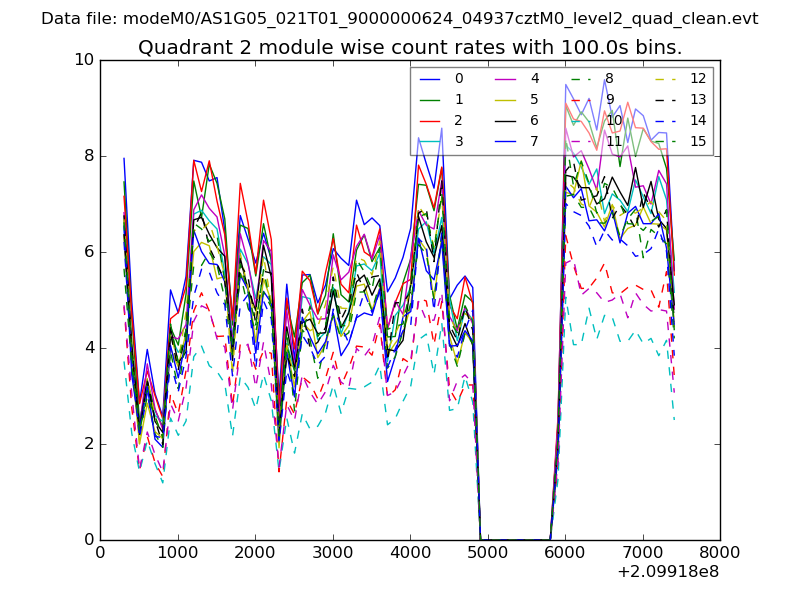
| Module-wise count rates for Quadrant B Data is divided into 100 sec bins |
 |
 |
| Module-wise count rates for Quadrant C Data is divided into 100 sec bins |
 |
 |
| Module-wise count rates for Quadrant D Data is divided into 100 sec bins |
 |
 |
| Parameter | Plot |
|---|---|
| CZT HV Monitor | 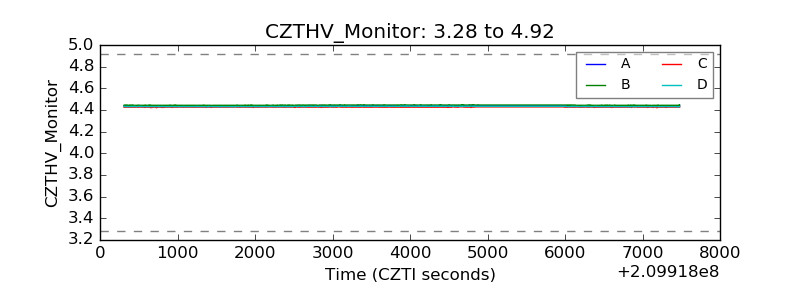 |
| D_VDD | 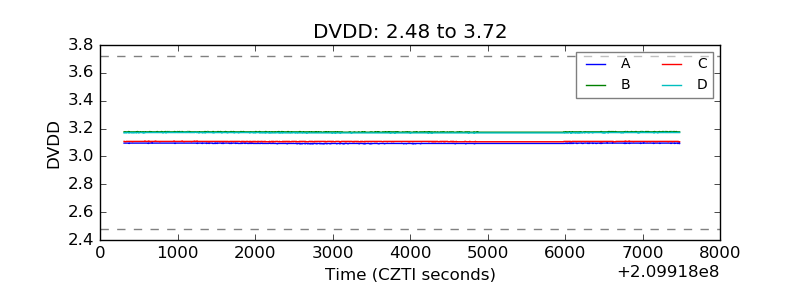 |
| Temperature 1 | 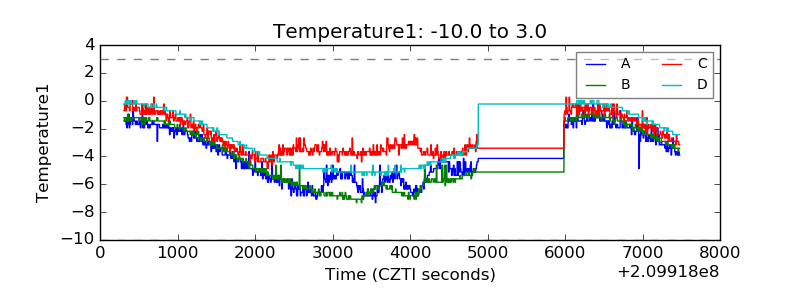 |
| Veto HV Monitor | 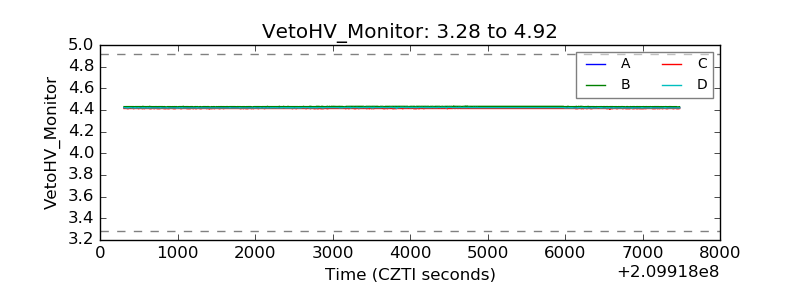 |
| Veto LLD | 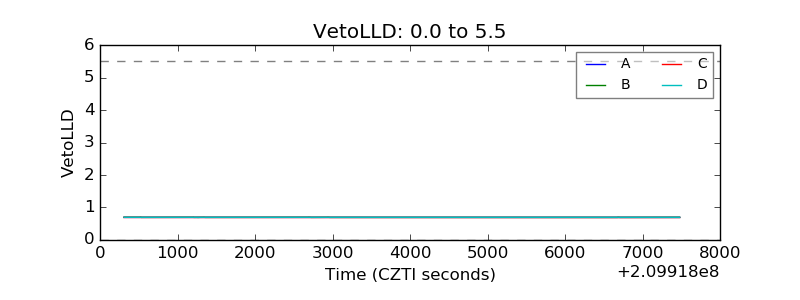 |
| Alpha Counter | 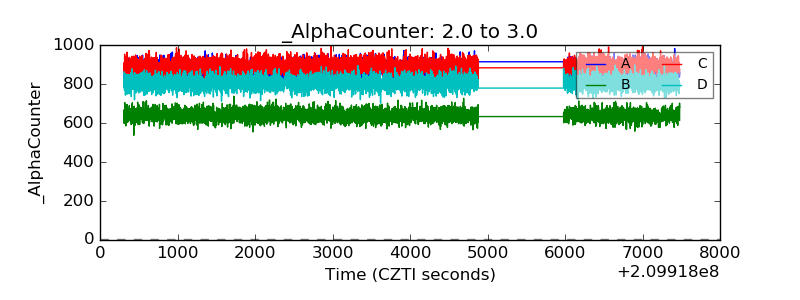 |
| _CPM_Rate | 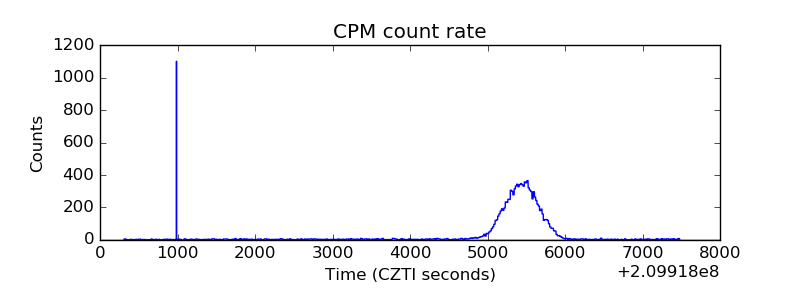 |
| CZT Counter | 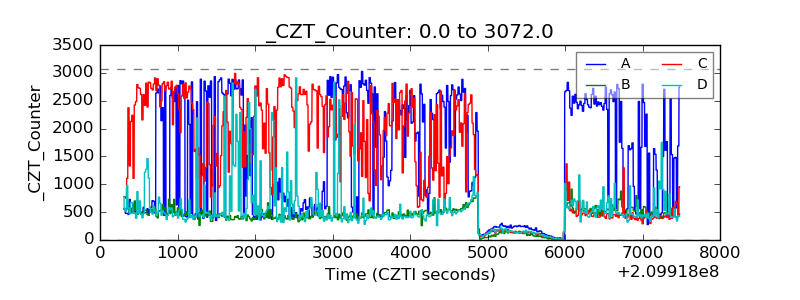 |
| +2.5 Volts monitor | 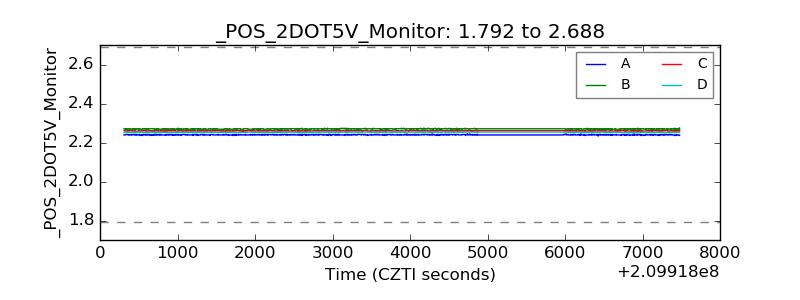 |
| +5 Volts monitor | 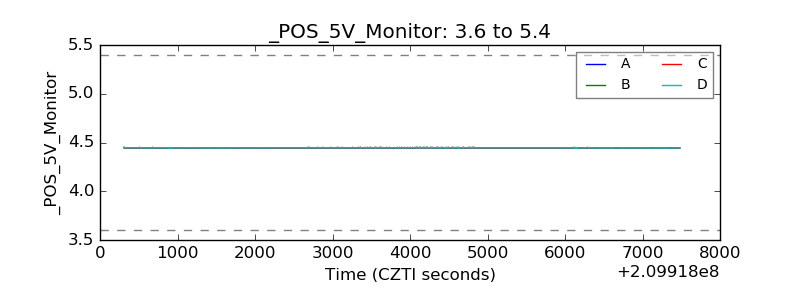 |
| _ROLL_ROT | 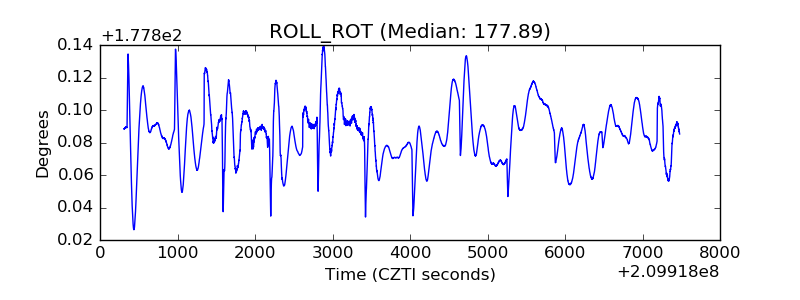 |
| _Roll_DEC | 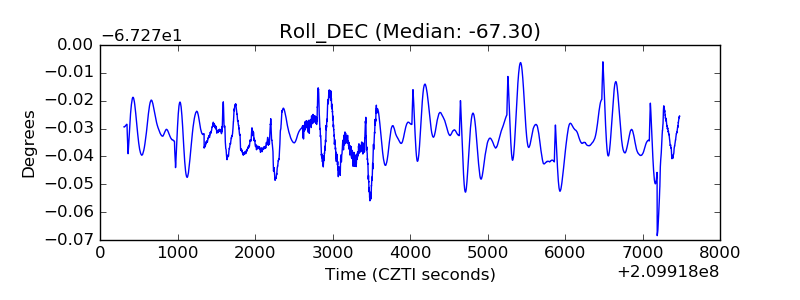 |
| _Roll_RA | 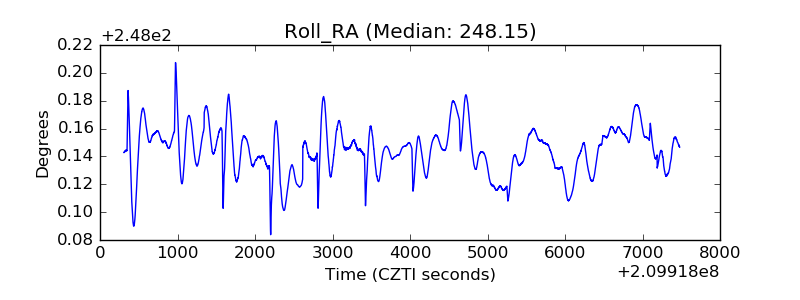 |
| Veto Counter | 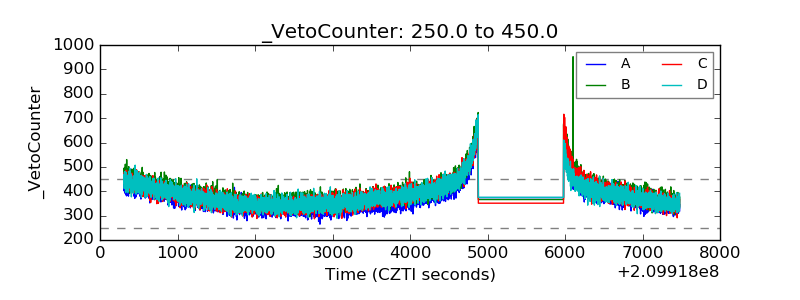 |