| Param | Original file | Final file |
|---|---|---|
| Filename | modeM0/AS1G05_021T01_9000000624_04938cztM0_level2.evt | modeM0/AS1G05_021T01_9000000624_04938cztM0_level2_quad_clean.evt |
| Size (bytes) | 573,621,120 | 98,691,840 |
| Size | 547.0 MB | 94.1 MB |
| Events in quadrant A | 5,857,104 | 547,905 |
| Events in quadrant B | 3,194,282 | 676,580 |
| Events in quadrant C | 4,143,358 | 663,647 |
| Events in quadrant D | 3,738,338 | 648,568 |
| Mode M9 | |||
|---|---|---|---|
| Quadrant | BADHDUFLAG | Total packets | Discarded packets |
| A | 0 | 8 | 0 |
| B | 0 | 8 | 0 |
| C | 0 | 8 | 0 |
| D | 0 | 8 | 0 |
| Mode M0 | |||
|---|---|---|---|
| Quadrant | BADHDUFLAG | Total packets | Discarded packets |
| A | 0 | 21761 | 2 |
| B | 0 | 13907 | 1 |
| C | 0 | 16865 | 1 |
| D | 0 | 15817 | 1 |
| Mode SS | |||
|---|---|---|---|
| Quadrant | BADHDUFLAG | Total packets | Discarded packets |
| A | 0 | 132 | 0 |
| B | 0 | 132 | 0 |
| C | 0 | 132 | 0 |
| D | 0 | 132 | 0 |
| Quadrant | Total seconds | Saturated seconds | Saturation percentage |
|---|---|---|---|
| A | 6469 | 1379 | 21.317051% |
| B | 6469 | 41 | 0.633792% |
| C | 6469 | 276 | 4.266502% |
| D | 6469 | 141 | 2.179626% |
Noise dominated data is calculated using 1-second bins in cleaned event files. If a bin has >2000 counts, and if more than 50% of those come from <1% of pixels, then it is considered to be noise-dominated and hence unusable.
| Quadrant | # 1 sec bins | Bins with >0 counts | Bins with >2000 counts | High rate bins dominated by noise | Noise dominated (total time) | Noise dominated (detector-on time) | Marked lightcurve |
|---|---|---|---|---|---|---|---|
| A | 7274 | 6470 | 933 | 933 | 12.83% | 14.42% | 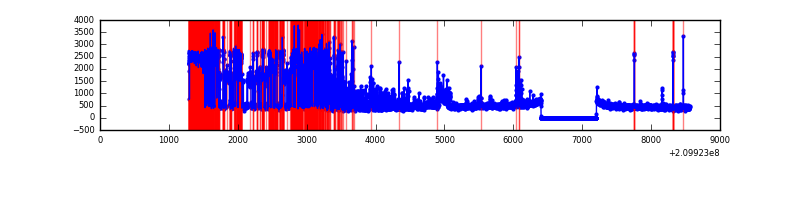 |
| B | 7274 | 6470 | 12 | 12 | 0.16% | 0.19% | 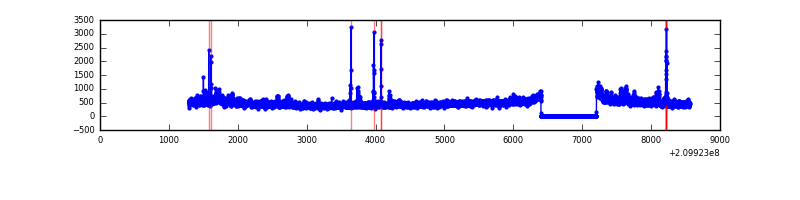 |
| C | 7274 | 6470 | 171 | 171 | 2.35% | 2.64% | 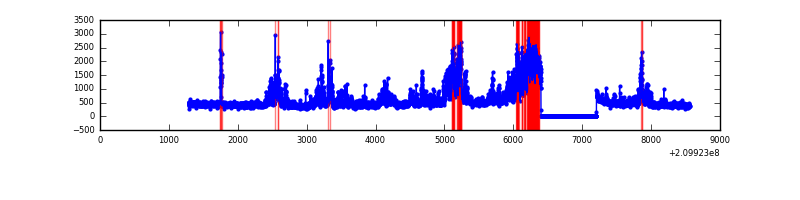 |
| D | 7274 | 6470 | 135 | 135 | 1.86% | 2.09% | 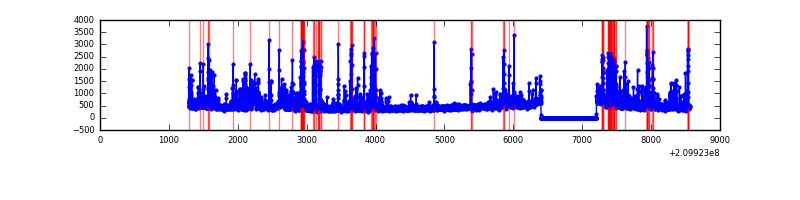 |
Top three noisy pixels from each quadrant. If the there are fewer than three noisy pixels in the level2.evt file, extra rows are filled as -1
| Pixel properties | Quadrant properties | ||||||
|---|---|---|---|---|---|---|---|
| Quadrant | DetID | PixID | Counts | Sigma | Mean | Median | Sigma |
| A | 0 | 31 | 3372116 | 27094.83 | 600 | 586 | 124.4 |
| A | 0 | 50 | 127443 | 1019.46 | 600 | 586 | 124.4 |
| A | 13 | 251 | 26039 | 204.55 | 600 | 586 | 124.4 |
| B | 15 | 204 | 162326 | 1163.82 | 731 | 714 | 138.9 |
| B | 0 | 219 | 102308 | 731.61 | 731 | 714 | 138.9 |
| B | 4 | 48 | 29704 | 208.77 | 731 | 714 | 138.9 |
| C | 9 | 247 | 1392208 | 8757.46 | 690 | 693 | 158.9 |
| C | 1 | 16 | 47565 | 294.99 | 690 | 693 | 158.9 |
| C | 12 | 4 | 7383 | 42.1 | 690 | 693 | 158.9 |
| D | 2 | 33 | 317499 | 1869.89 | 695 | 674 | 169.4 |
| D | 12 | 110 | 251575 | 1480.81 | 695 | 674 | 169.4 |
| D | 2 | 136 | 111165 | 652.11 | 695 | 674 | 169.4 |
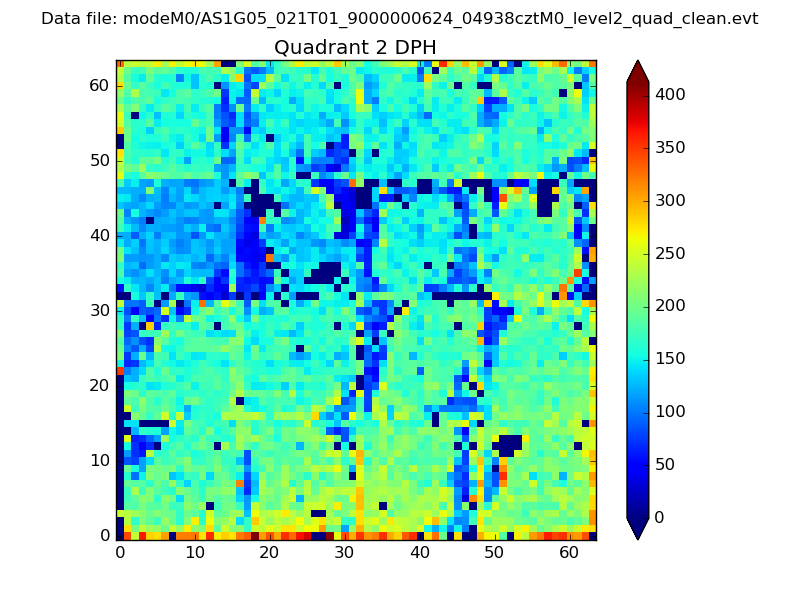
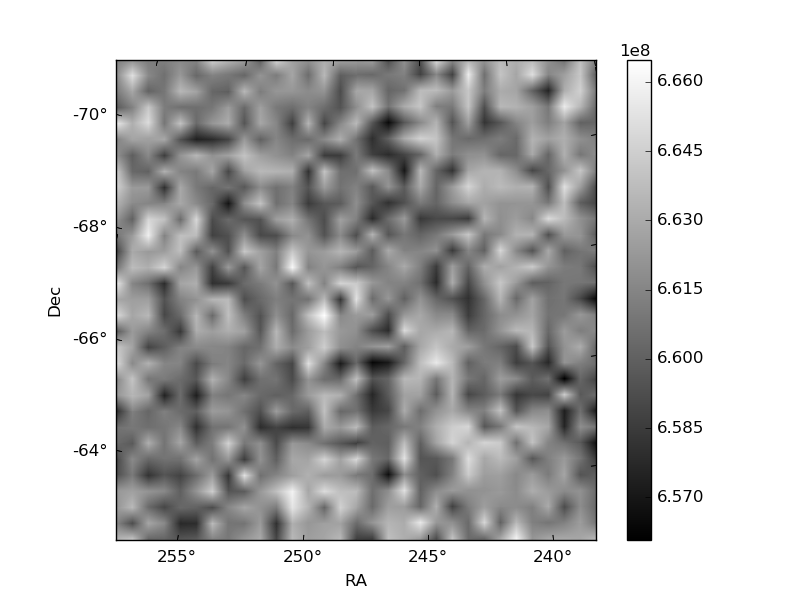
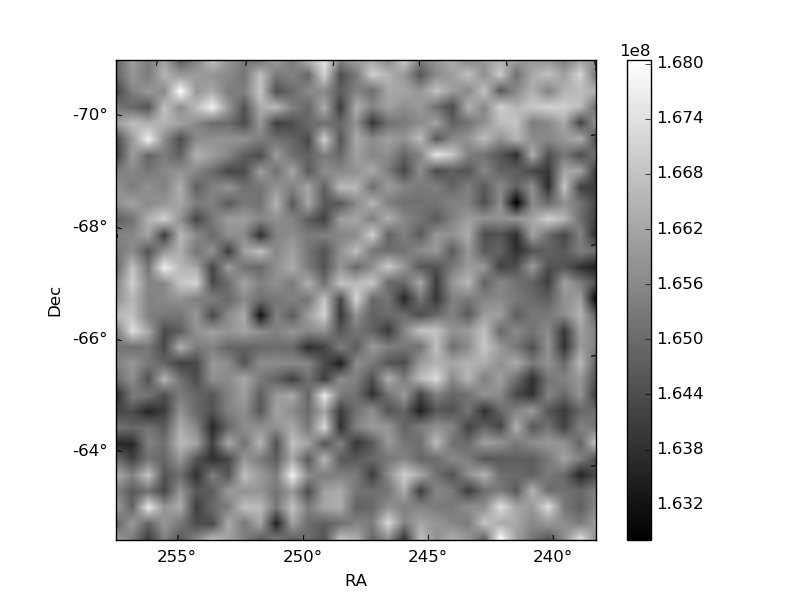
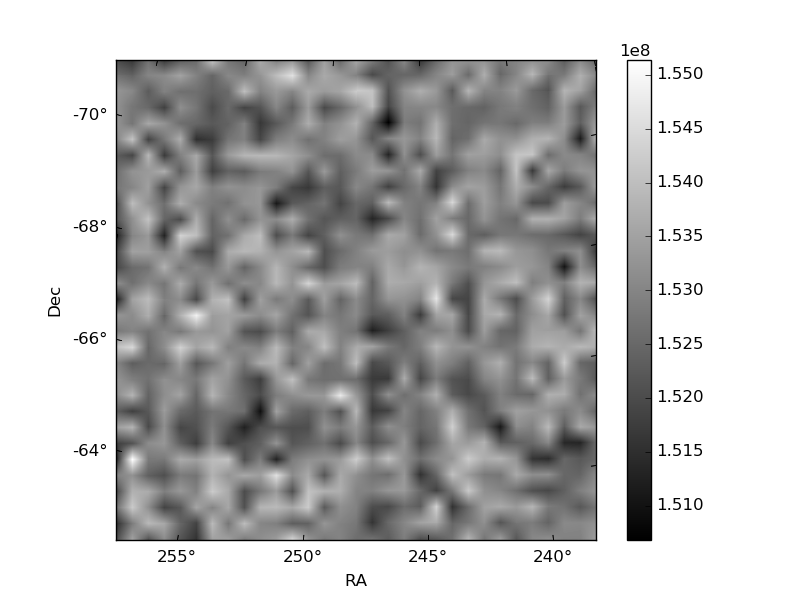
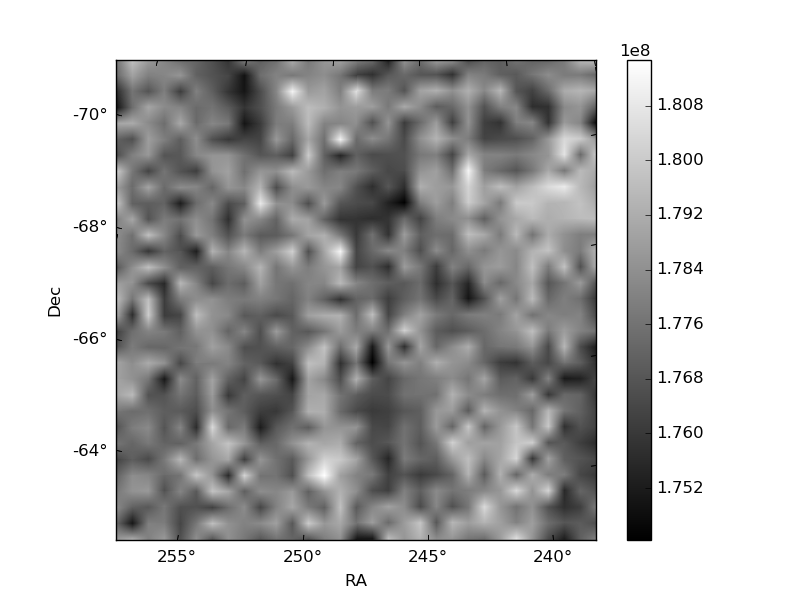
Histogram calculated using DETX and DETY for each event in the final _common_clean file
| Quadrant A | 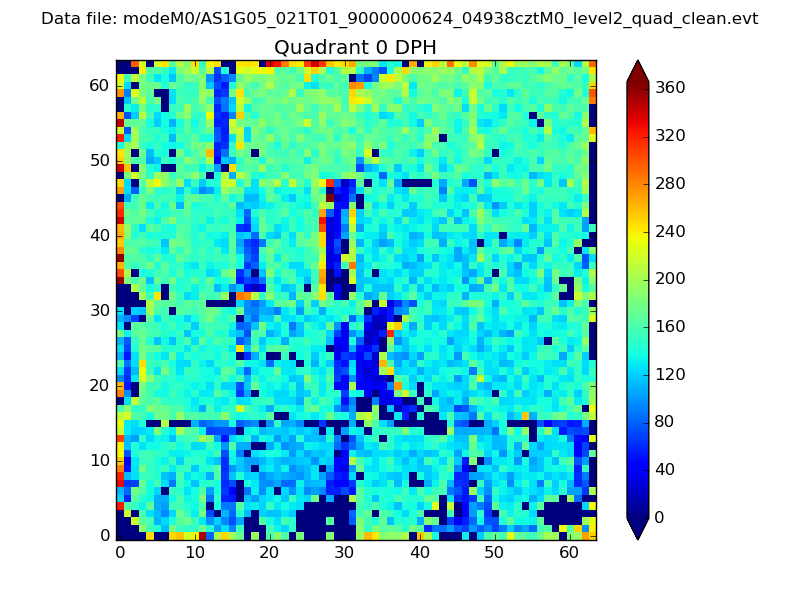 |
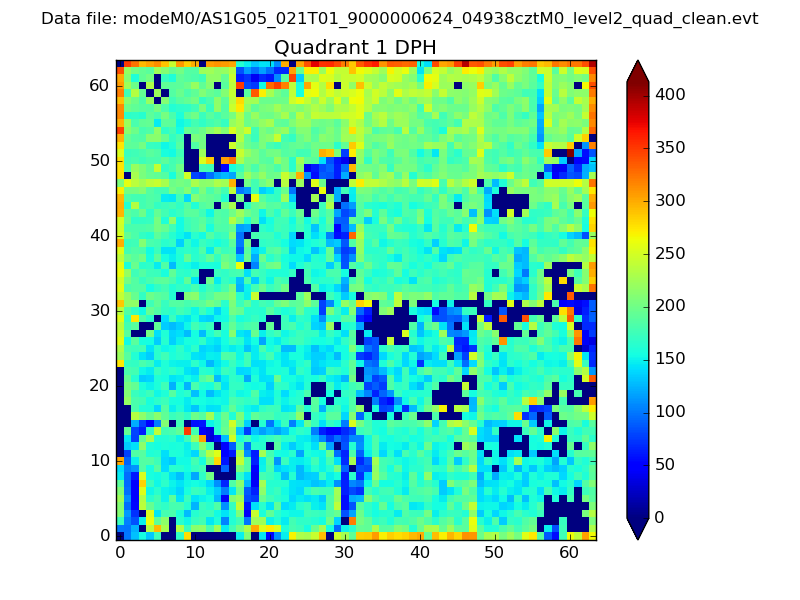 |
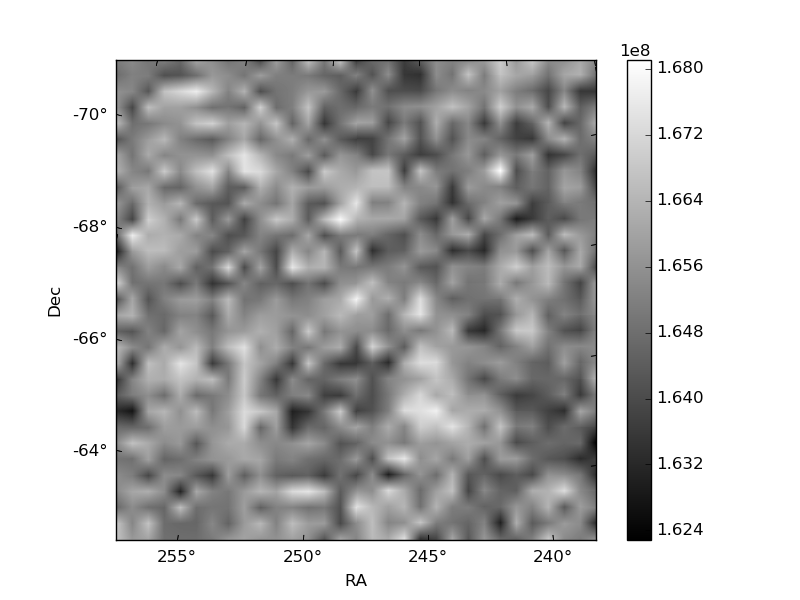
Quadrant B |
|---|---|---|---|
| Quadrant D | 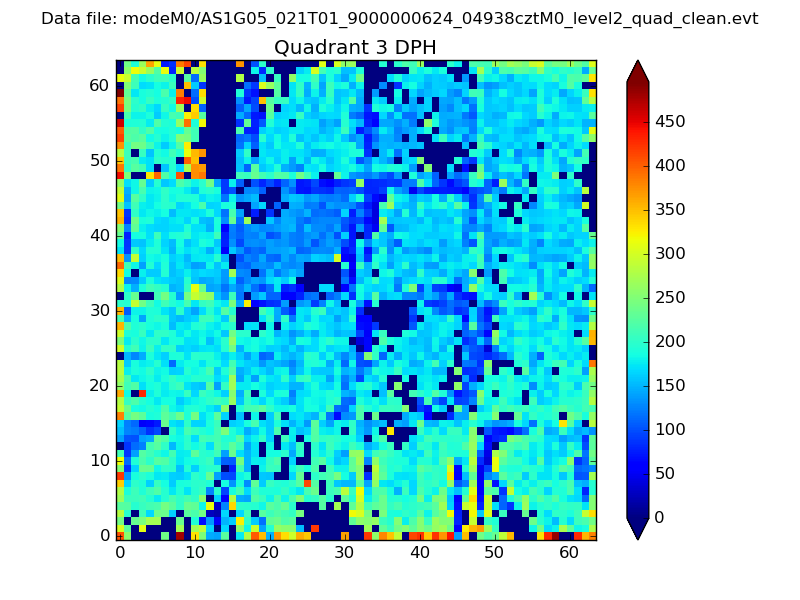 |
 |
Quadrant C |
| Plot type | Count rate plots | Images |
|---|---|---|
| Comparison with Poisson distribution Blue bars denote a histogram of data divided into 1 sec bins. Red curve is a Poisson curve with rate = median count rate of data. |
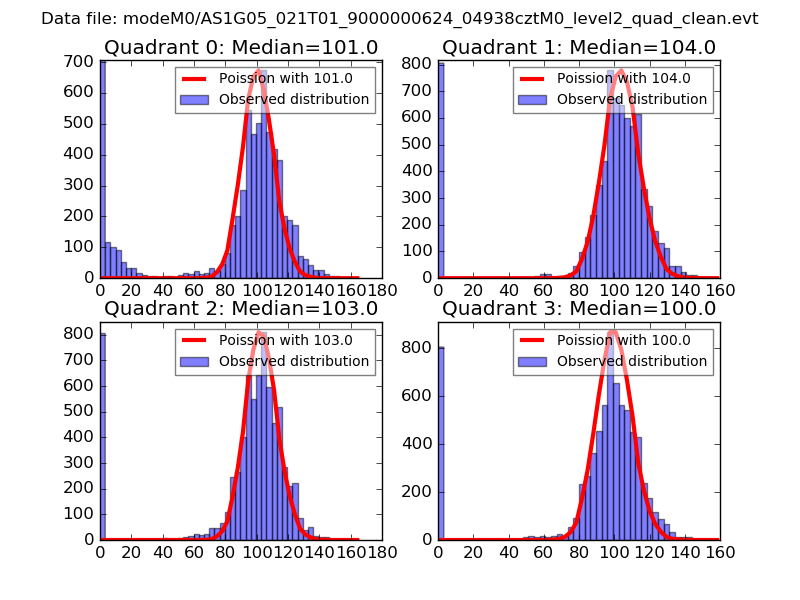 |
 |
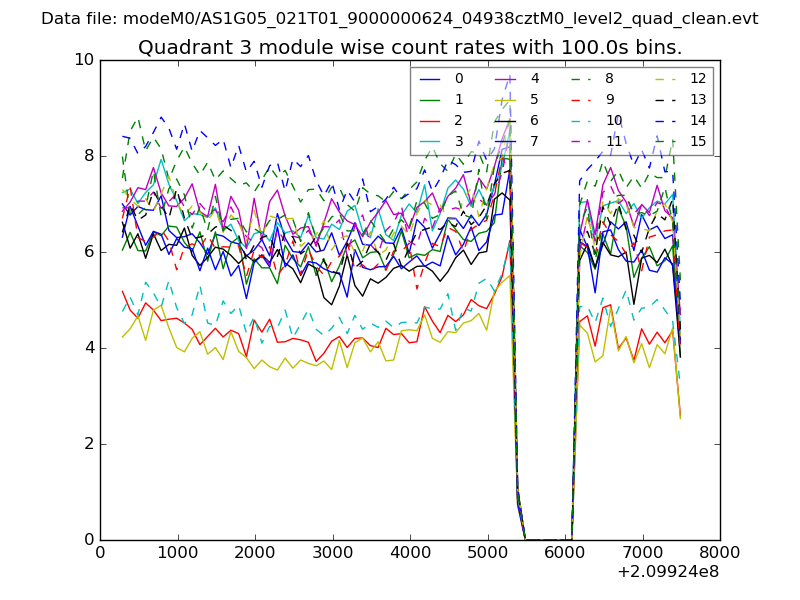
| Quadrant-wise count rates Data is divided into 100 sec bins |
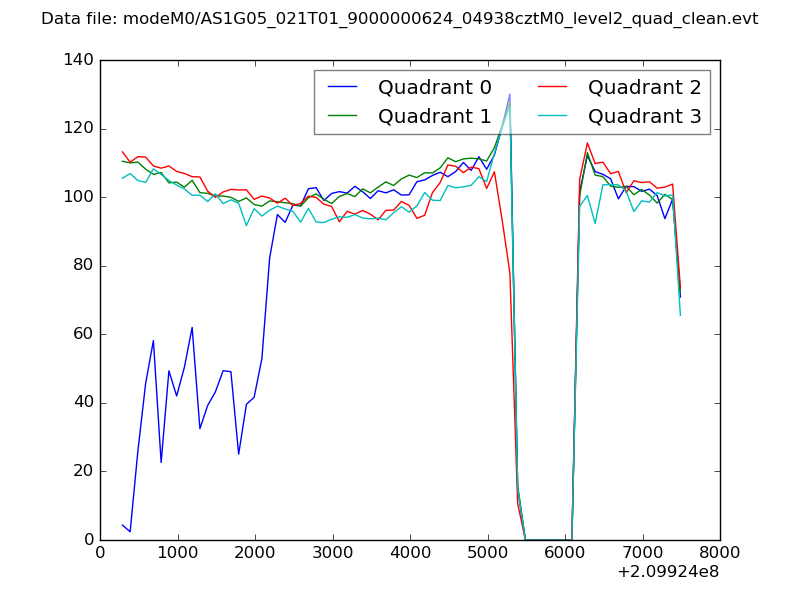 |
|
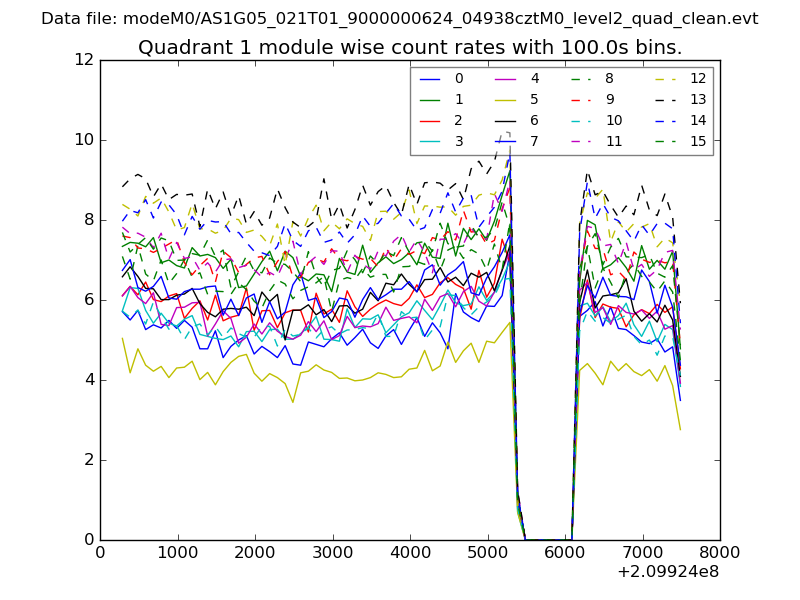
| Module-wise count rates for Quadrant A Data is divided into 100 sec bins |
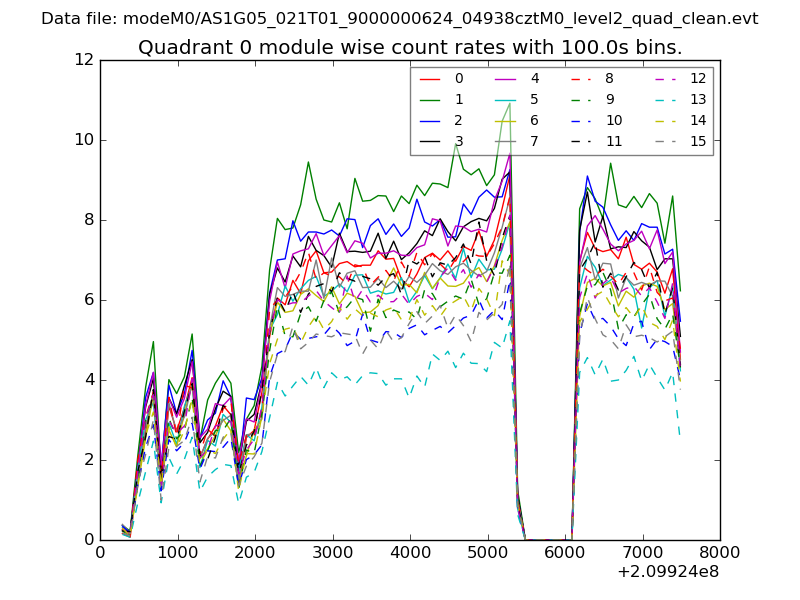 |
 |
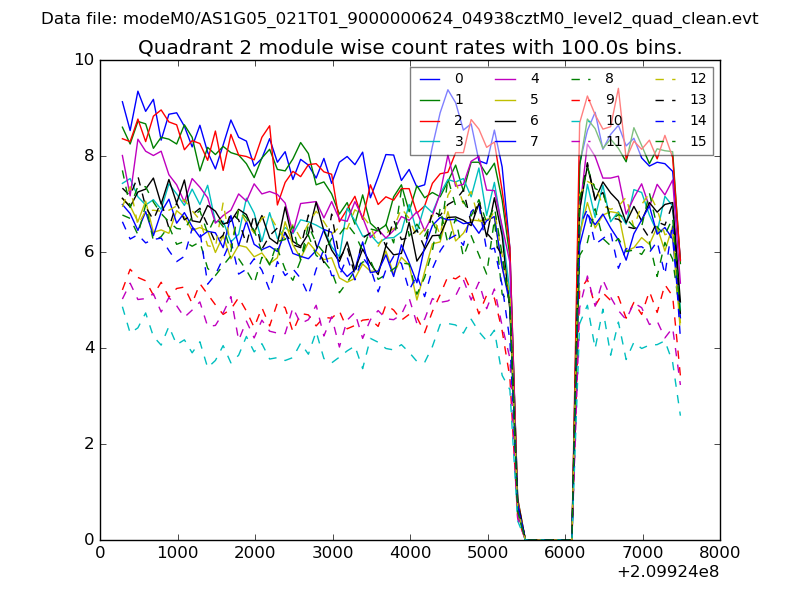
| Module-wise count rates for Quadrant B Data is divided into 100 sec bins |
 |
 |
| Module-wise count rates for Quadrant C Data is divided into 100 sec bins |
 |
 |
| Module-wise count rates for Quadrant D Data is divided into 100 sec bins |
 |
 |
| Parameter | Plot |
|---|---|
| CZT HV Monitor | 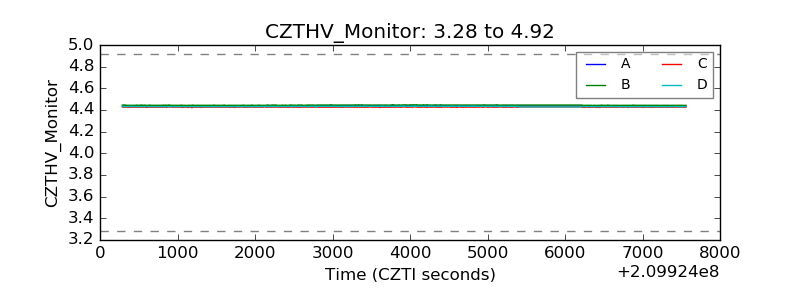 |
| D_VDD | 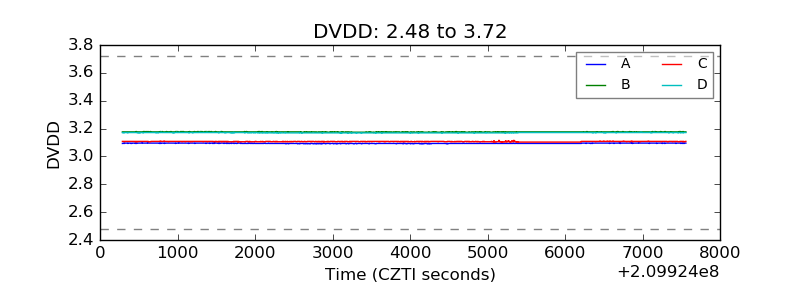 |
| Temperature 1 | 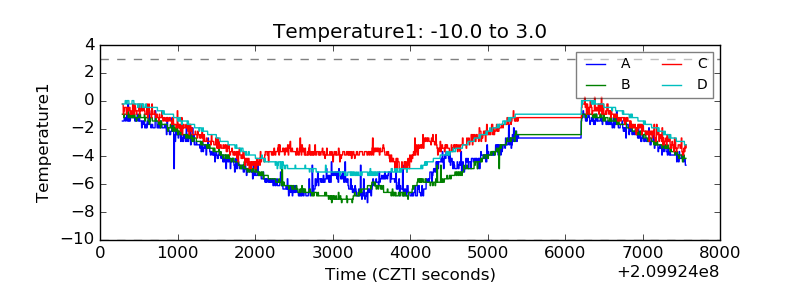 |
| Veto HV Monitor | 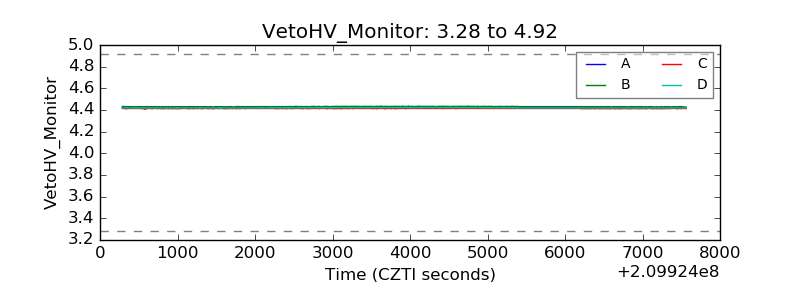 |
| Veto LLD | 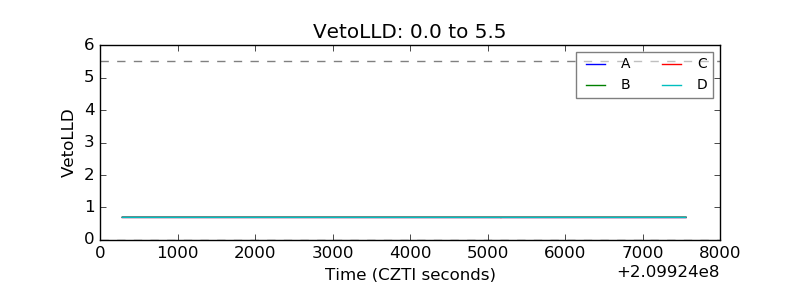 |
| Alpha Counter | 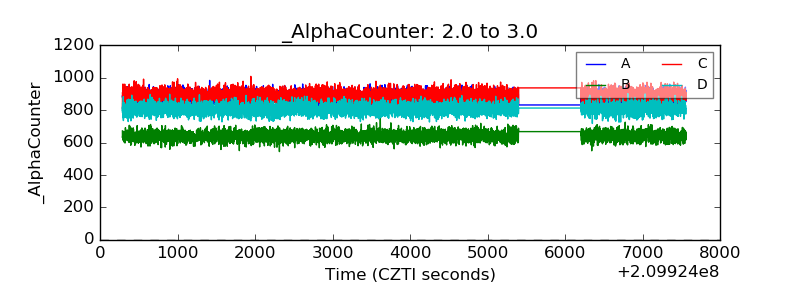 |
| _CPM_Rate | 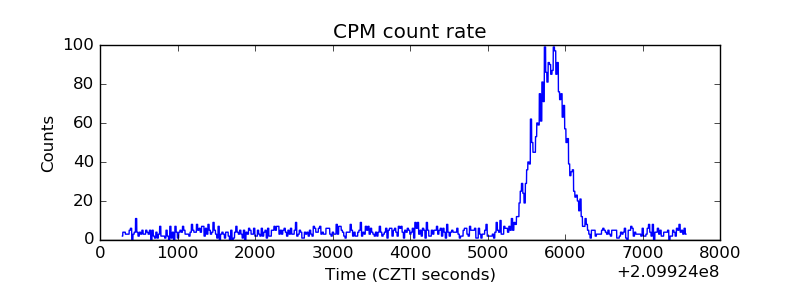 |
| CZT Counter | 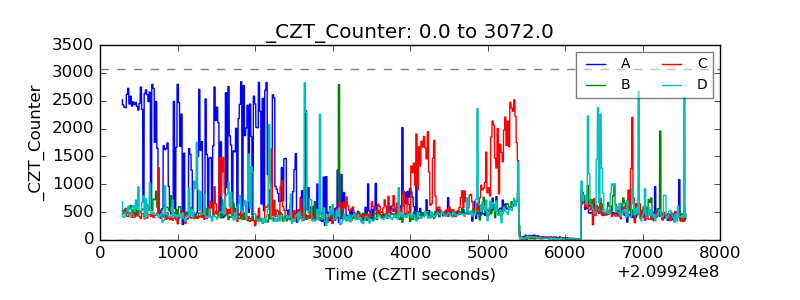 |
| +2.5 Volts monitor | 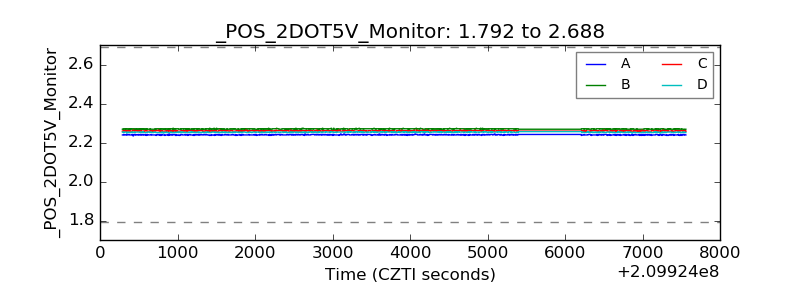 |
| +5 Volts monitor |  |
| _ROLL_ROT | 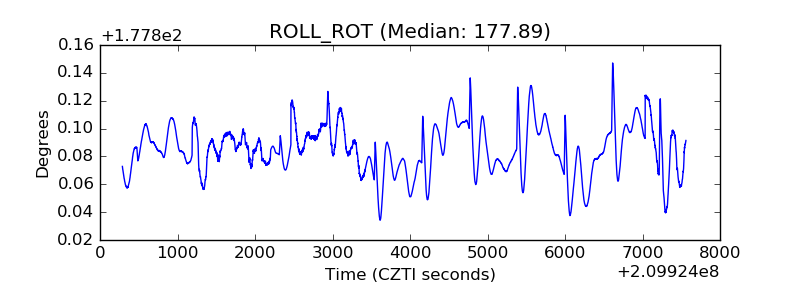 |
| _Roll_DEC | 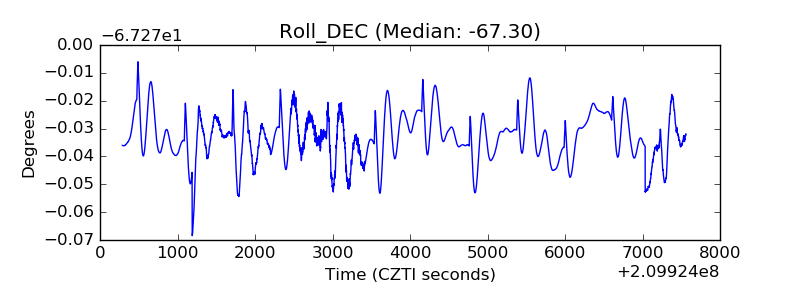 |
| _Roll_RA | 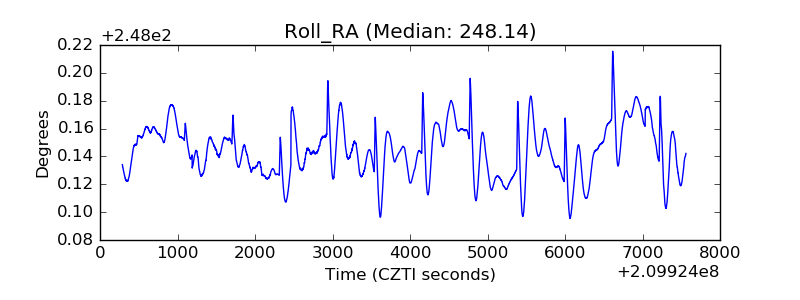 |
| Veto Counter | 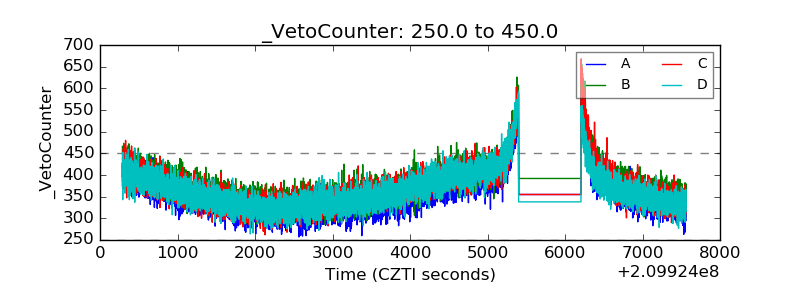 |