| Param | Original file | Final file |
|---|---|---|
| Filename | modeM0/AS1G05_021T01_9000000624_04940cztM0_level2.evt | modeM0/AS1G05_021T01_9000000624_04940cztM0_level2_quad_clean.evt |
| Size (bytes) | 641,640,960 | 114,638,400 |
| Size | 611.9 MB | 109.3 MB |
| Events in quadrant A | 6,958,281 | 673,153 |
| Events in quadrant B | 3,817,807 | 766,148 |
| Events in quadrant C | 3,342,733 | 774,899 |
| Events in quadrant D | 4,799,673 | 729,898 |
| Mode M9 | |||
|---|---|---|---|
| Quadrant | BADHDUFLAG | Total packets | Discarded packets |
| A | 0 | 4 | 0 |
| B | 0 | 4 | 0 |
| C | 0 | 4 | 0 |
| D | 0 | 4 | 0 |
| Mode M0 | |||
|---|---|---|---|
| Quadrant | BADHDUFLAG | Total packets | Discarded packets |
| A | 0 | 25964 | 3 |
| B | 0 | 16623 | 2 |
| C | 0 | 15573 | 2 |
| D | 0 | 19853 | 2 |
| Mode SS | |||
|---|---|---|---|
| Quadrant | BADHDUFLAG | Total packets | Discarded packets |
| A | 0 | 154 | 0 |
| B | 0 | 154 | 0 |
| C | 0 | 154 | 0 |
| D | 0 | 154 | 0 |
| Quadrant | Total seconds | Saturated seconds | Saturation percentage |
|---|---|---|---|
| A | 7572 | 1434 | 18.938193% |
| B | 7572 | 111 | 1.465927% |
| C | 7572 | 23 | 0.303751% |
| D | 7572 | 316 | 4.173270% |
Noise dominated data is calculated using 1-second bins in cleaned event files. If a bin has >2000 counts, and if more than 50% of those come from <1% of pixels, then it is considered to be noise-dominated and hence unusable.
| Quadrant | # 1 sec bins | Bins with >0 counts | Bins with >2000 counts | High rate bins dominated by noise | Noise dominated (total time) | Noise dominated (detector-on time) | Marked lightcurve |
|---|---|---|---|---|---|---|---|
| A | 7747 | 7572 | 1331 | 1331 | 17.18% | 17.58% | 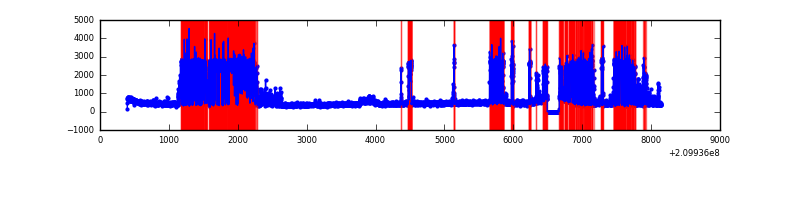 |
| B | 7747 | 7572 | 13 | 13 | 0.17% | 0.17% | 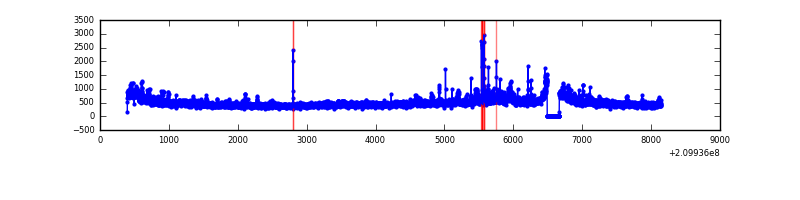 |
| C | 7747 | 7573 | 1 | 1 | 0.01% | 0.01% | 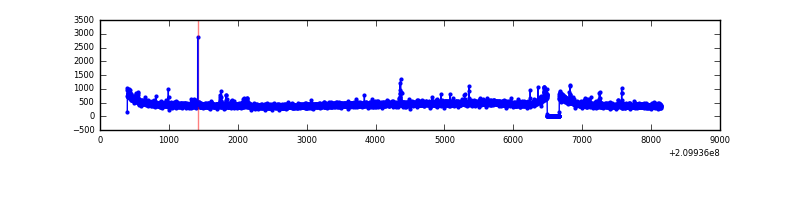 |
| D | 7747 | 7573 | 246 | 246 | 3.18% | 3.25% | 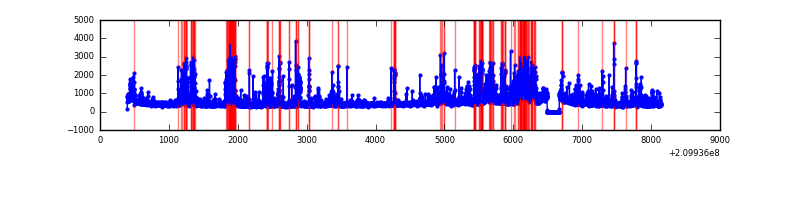 |
Top three noisy pixels from each quadrant. If the there are fewer than three noisy pixels in the level2.evt file, extra rows are filled as -1
| Pixel properties | Quadrant properties | ||||||
|---|---|---|---|---|---|---|---|
| Quadrant | DetID | PixID | Counts | Sigma | Mean | Median | Sigma |
| A | 0 | 31 | 3834651 | 24425.2 | 762 | 744 | 157.0 |
| A | 0 | 50 | 157724 | 1000.09 | 762 | 744 | 157.0 |
| A | 15 | 31 | 20109 | 123.37 | 762 | 744 | 157.0 |
| B | 15 | 204 | 205732 | 1226.8 | 860 | 838 | 167.0 |
| B | 0 | 219 | 104986 | 623.59 | 860 | 838 | 167.0 |
| B | 15 | 54 | 51374 | 302.58 | 860 | 838 | 167.0 |
| C | 1 | 16 | 37036 | 189.03 | 826 | 829 | 191.5 |
| C | 9 | 247 | 36800 | 187.8 | 826 | 829 | 191.5 |
| C | 8 | 128 | 15786 | 78.09 | 826 | 829 | 191.5 |
| D | 2 | 33 | 451552 | 2253.5 | 813 | 785 | 200.0 |
| D | 1 | 7 | 345621 | 1723.93 | 813 | 785 | 200.0 |
| D | 13 | 235 | 266317 | 1327.46 | 813 | 785 | 200.0 |
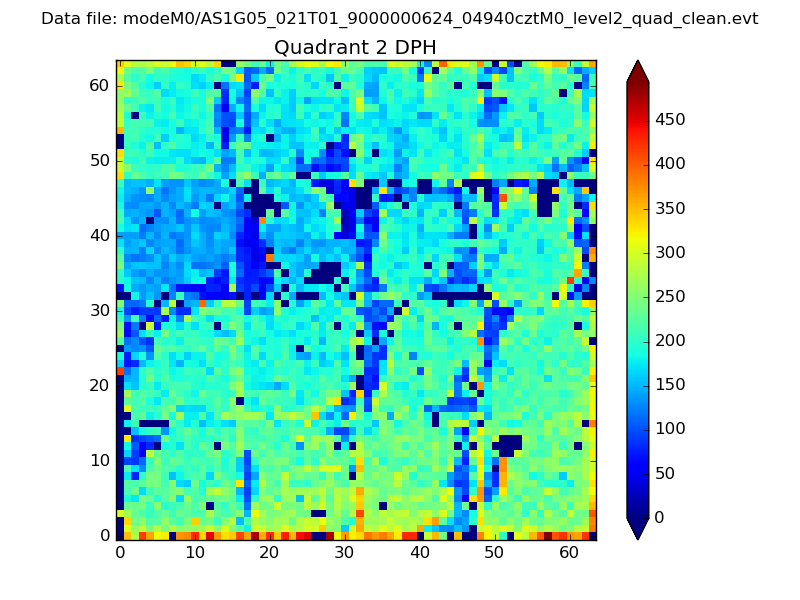
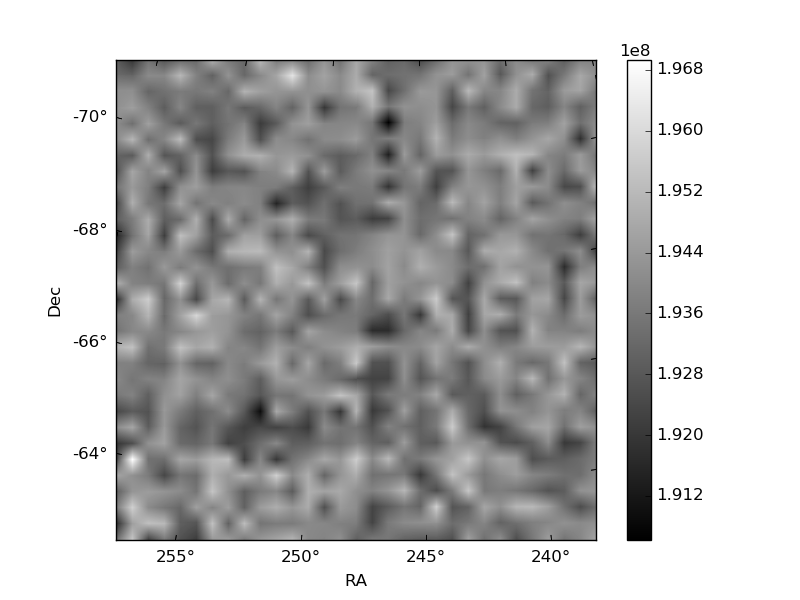
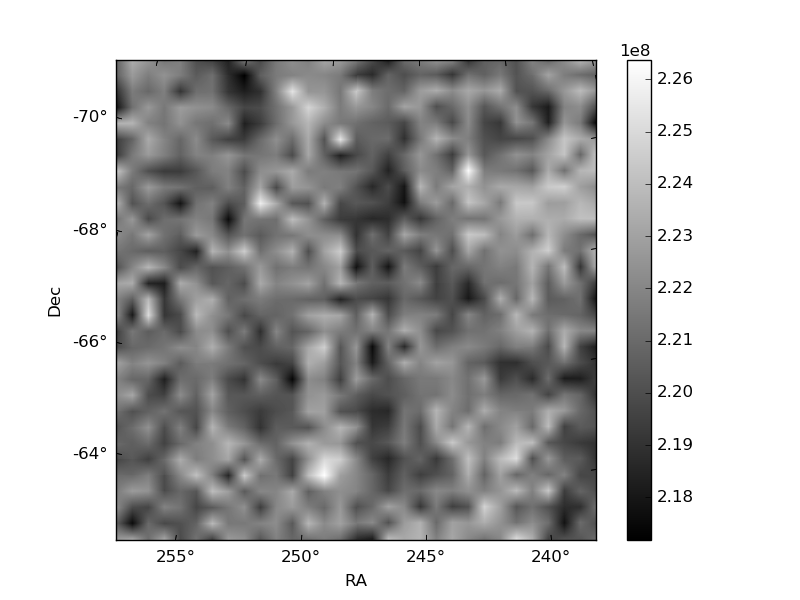
Histogram calculated using DETX and DETY for each event in the final _common_clean file
| Quadrant A | 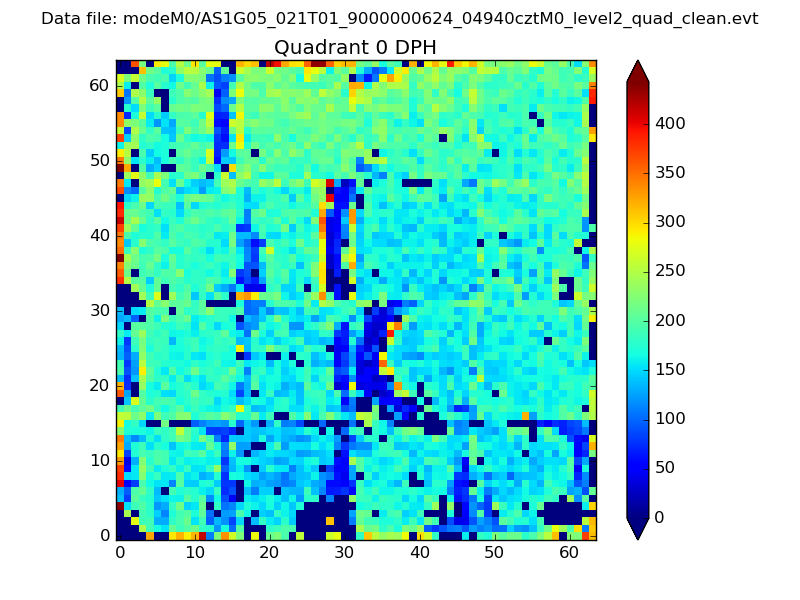 |
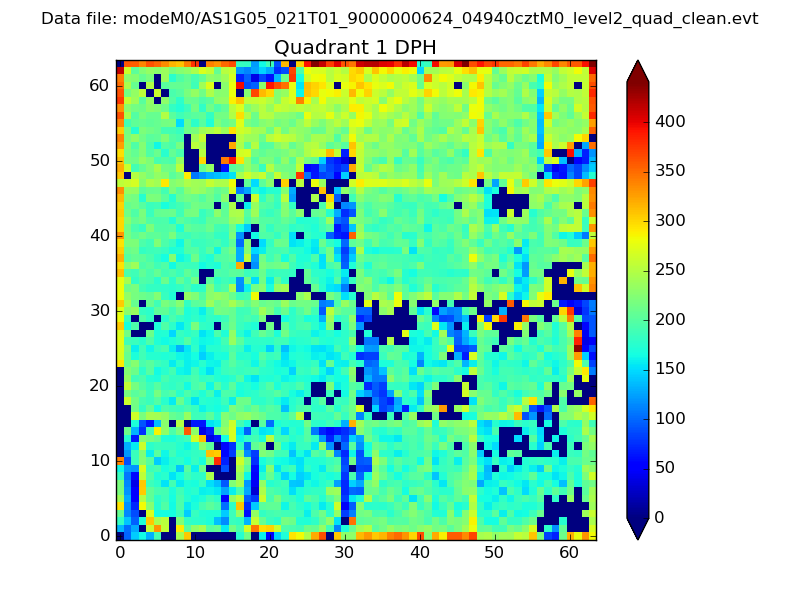 |
Quadrant B |
|---|---|---|---|
| Quadrant D | 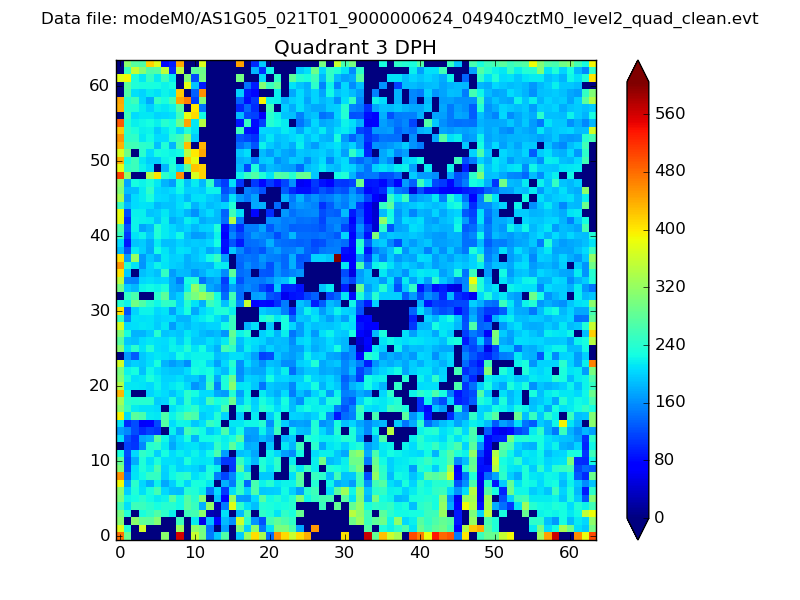 |
 |
Quadrant C |
| Plot type | Count rate plots | Images |
|---|---|---|
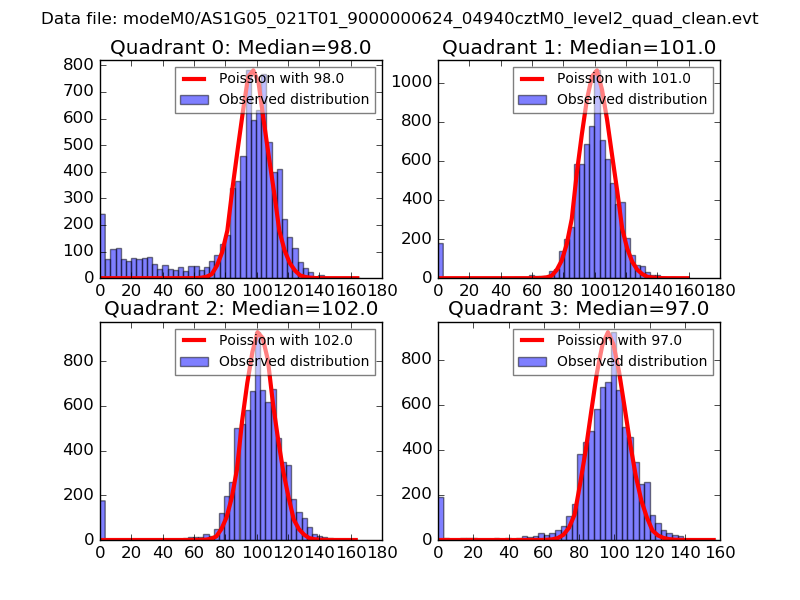
| Comparison with Poisson distribution Blue bars denote a histogram of data divided into 1 sec bins. Red curve is a Poisson curve with rate = median count rate of data. |
 |
 |
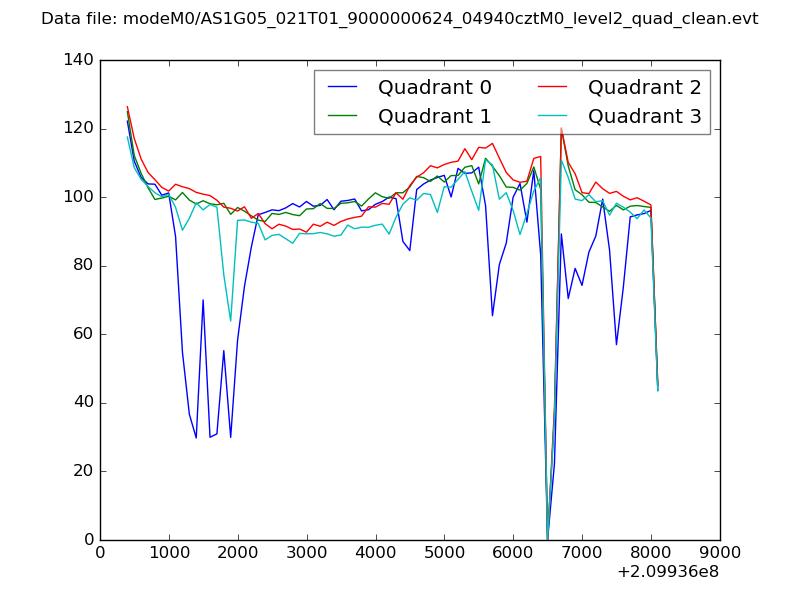
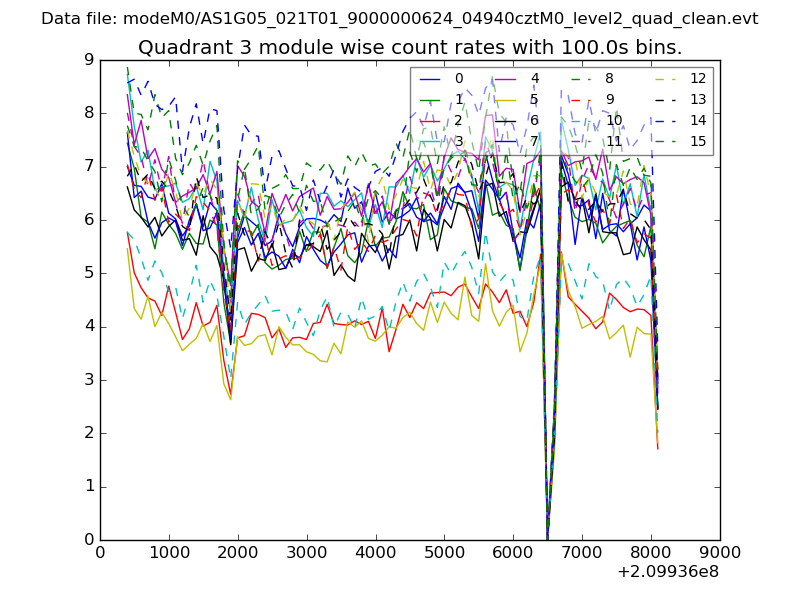
| Quadrant-wise count rates Data is divided into 100 sec bins |
 |
|
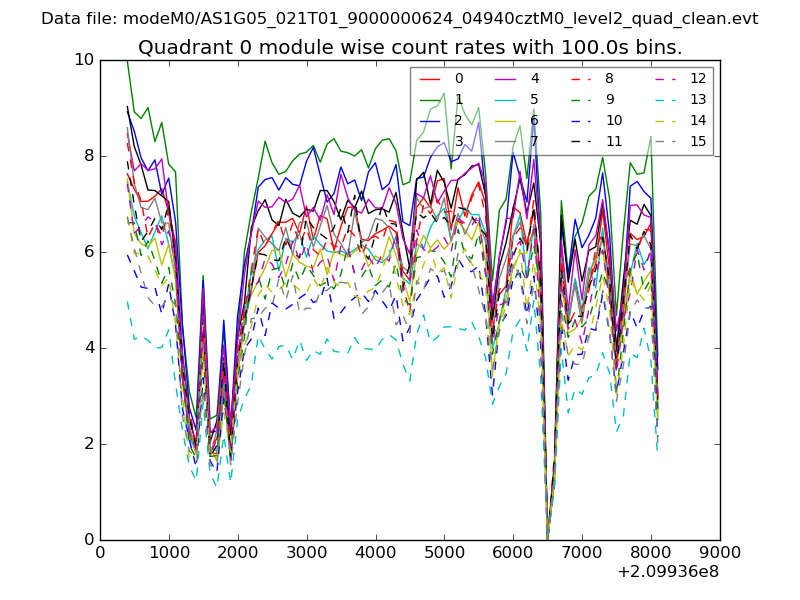
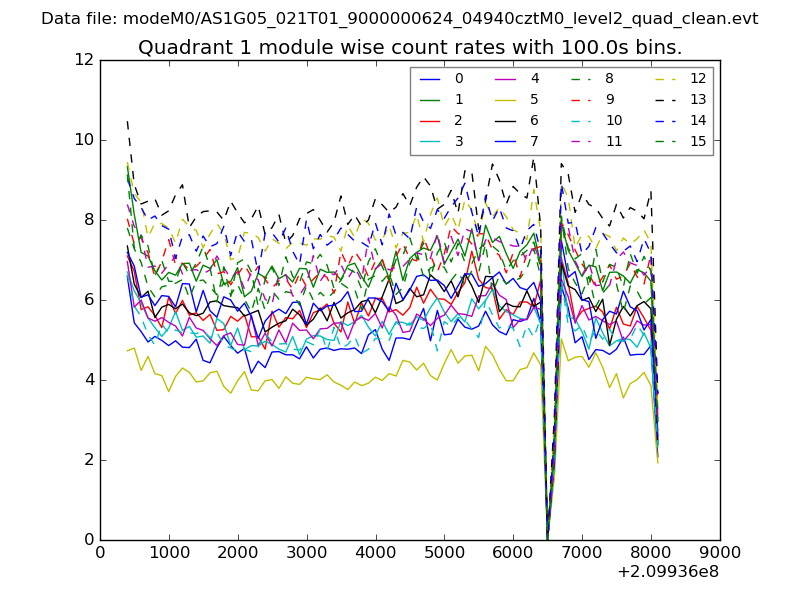
| Module-wise count rates for Quadrant A Data is divided into 100 sec bins |
 |
 |
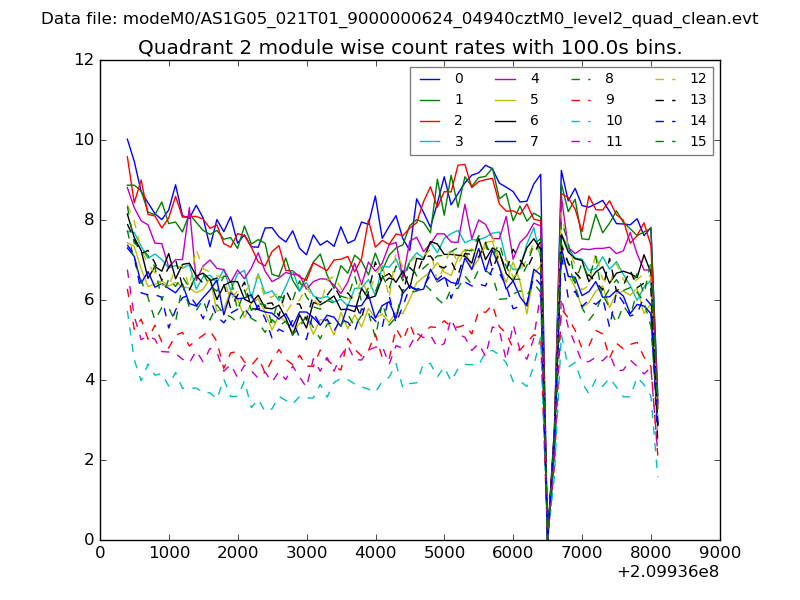
| Module-wise count rates for Quadrant B Data is divided into 100 sec bins |
 |
 |
| Module-wise count rates for Quadrant C Data is divided into 100 sec bins |
 |
 |
| Module-wise count rates for Quadrant D Data is divided into 100 sec bins |
 |
 |
| Parameter | Plot |
|---|---|
| CZT HV Monitor | 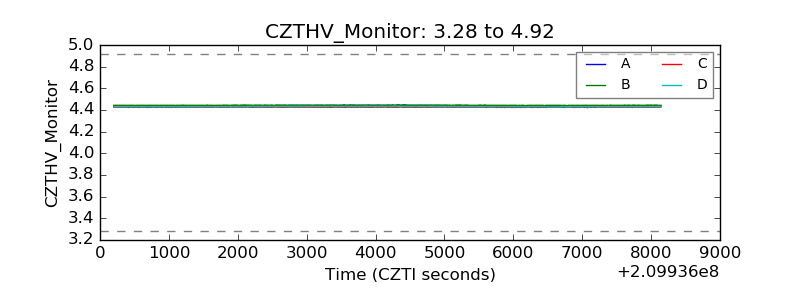 |
| D_VDD | 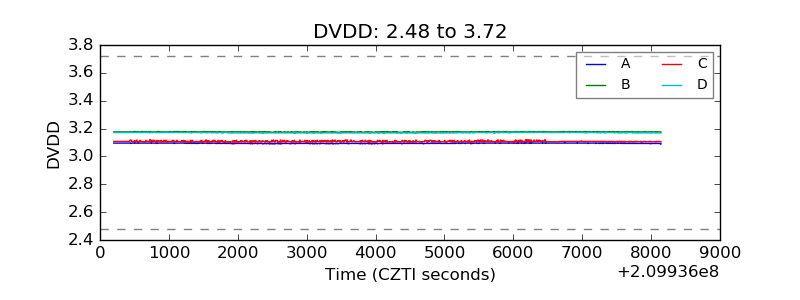 |
| Temperature 1 | 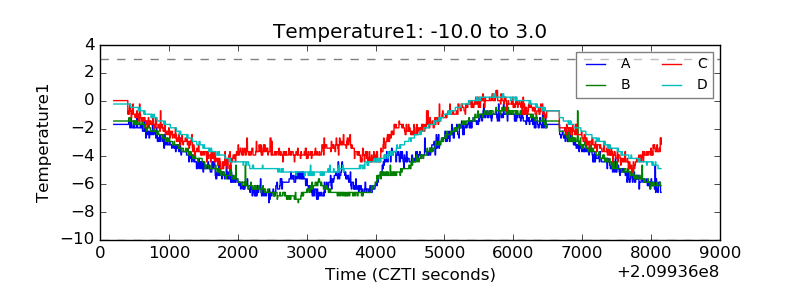 |
| Veto HV Monitor | 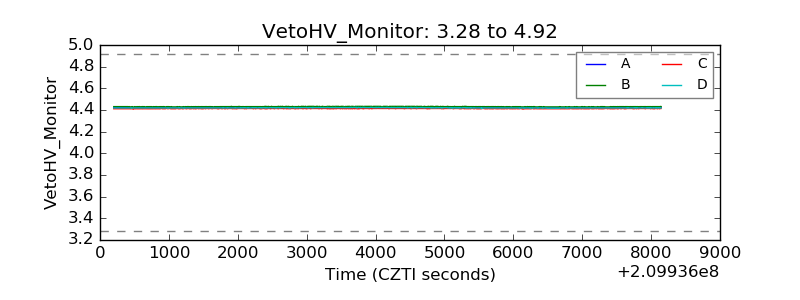 |
| Veto LLD | 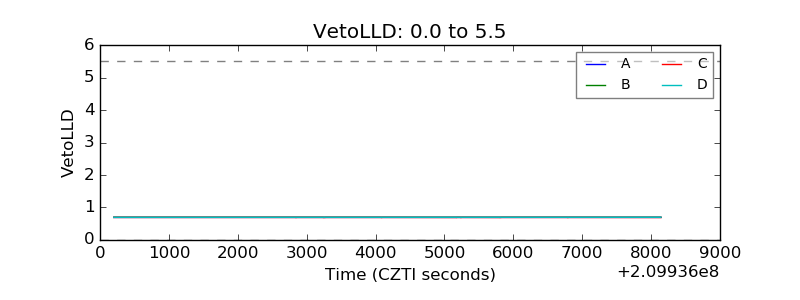 |
| Alpha Counter | 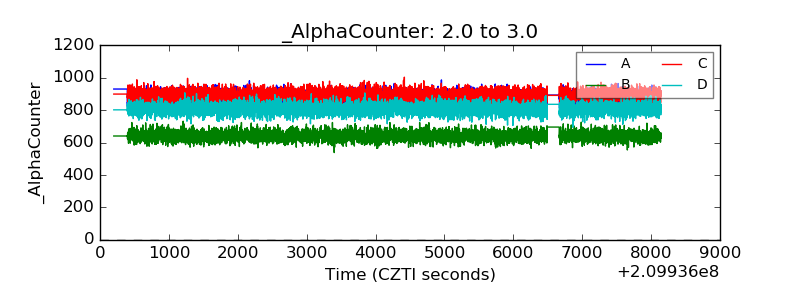 |
| _CPM_Rate | 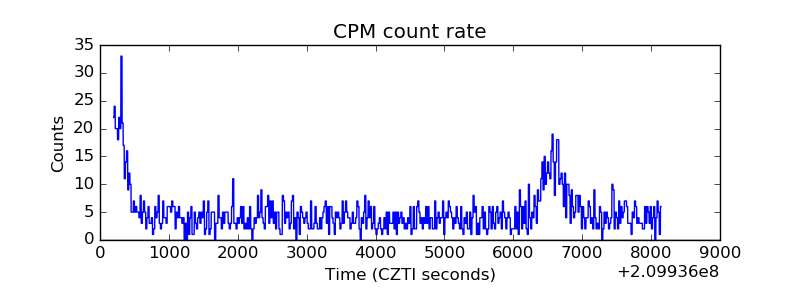 |
| CZT Counter |  |
| +2.5 Volts monitor | 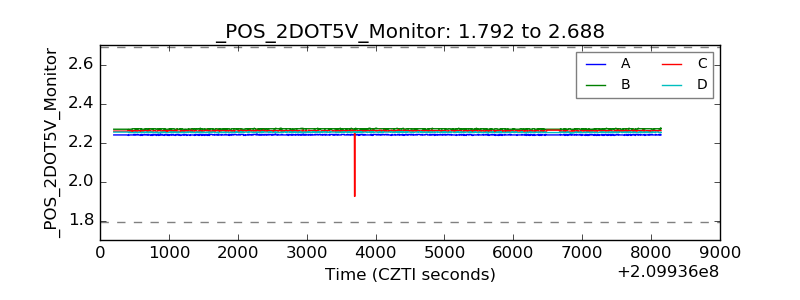 |
| +5 Volts monitor |  |
| _ROLL_ROT | 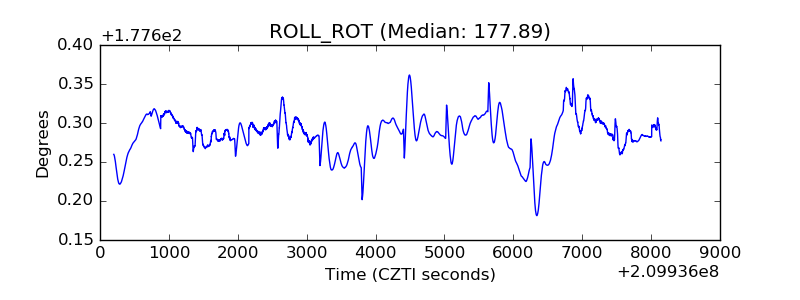 |
| _Roll_DEC | 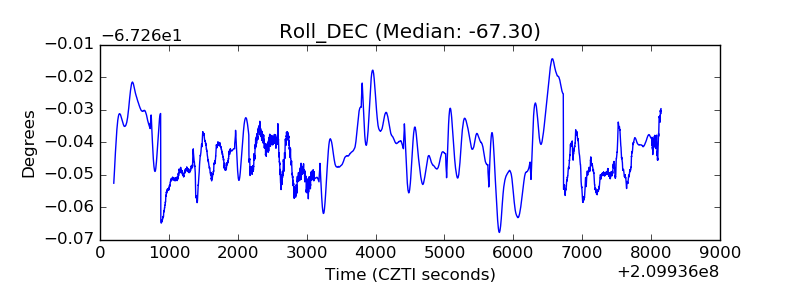 |
| _Roll_RA | 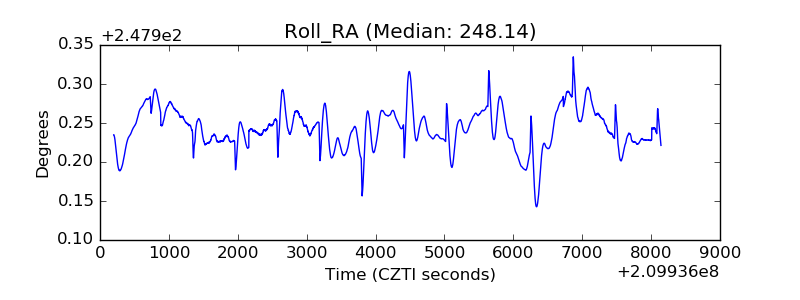 |
| Veto Counter | 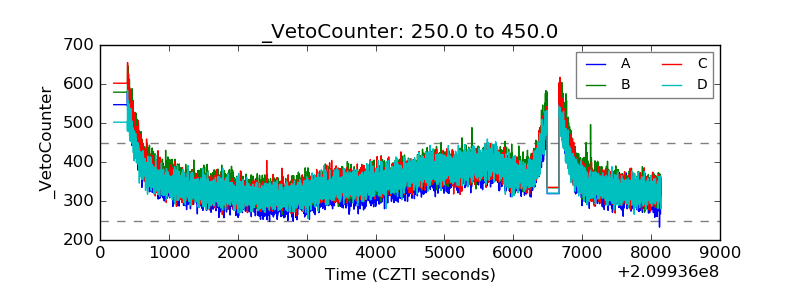 |