| Param | Original file | Final file |
|---|---|---|
| Filename | modeM0/AS1G05_021T01_9000000624_04944cztM0_level2.evt | modeM0/AS1G05_021T01_9000000624_04944cztM0_level2_quad_clean.evt |
| Size (bytes) | 961,885,440 | 178,954,560 |
| Size | 917.3 MB | 170.7 MB |
| Events in quadrant A | 9,053,012 | 1,099,479 |
| Events in quadrant B | 5,749,900 | 1,187,296 |
| Events in quadrant C | 5,095,294 | 1,195,117 |
| Events in quadrant D | 8,428,554 | 1,115,410 |
| Mode M9 | |||
|---|---|---|---|
| Quadrant | BADHDUFLAG | Total packets | Discarded packets |
| A | 0 | 9 | 0 |
| B | 0 | 9 | 0 |
| C | 0 | 9 | 0 |
| D | 0 | 9 | 0 |
| Mode M0 | |||
|---|---|---|---|
| Quadrant | BADHDUFLAG | Total packets | Discarded packets |
| A | 0 | 35592 | 2 |
| B | 0 | 25294 | 2 |
| C | 0 | 24097 | 2 |
| D | 0 | 33424 | 2 |
| Mode SS | |||
|---|---|---|---|
| Quadrant | BADHDUFLAG | Total packets | Discarded packets |
| A | 0 | 242 | 0 |
| B | 0 | 242 | 0 |
| C | 0 | 242 | 0 |
| D | 0 | 242 | 0 |
| Quadrant | Total seconds | Saturated seconds | Saturation percentage |
|---|---|---|---|
| A | 11883 | 1639 | 13.792813% |
| B | 11883 | 136 | 1.144492% |
| C | 11883 | 27 | 0.227215% |
| D | 11883 | 571 | 4.805184% |
Noise dominated data is calculated using 1-second bins in cleaned event files. If a bin has >2000 counts, and if more than 50% of those come from <1% of pixels, then it is considered to be noise-dominated and hence unusable.
| Quadrant | # 1 sec bins | Bins with >0 counts | Bins with >2000 counts | High rate bins dominated by noise | Noise dominated (total time) | Noise dominated (detector-on time) | Marked lightcurve |
|---|---|---|---|---|---|---|---|
| A | 12783 | 11885 | 1467 | 1467 | 11.48% | 12.34% | 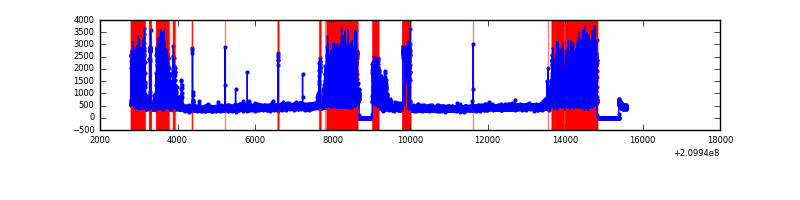 |
| B | 12782 | 11884 | 72 | 72 | 0.56% | 0.61% | 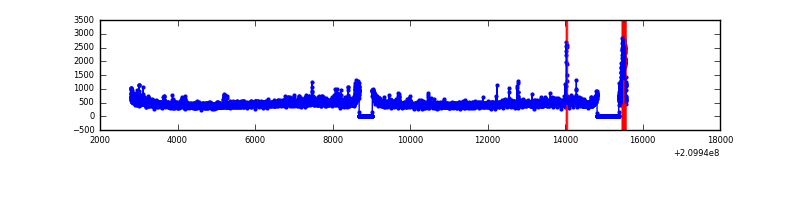 |
| C | 12783 | 11885 | 7 | 7 | 0.05% | 0.06% | 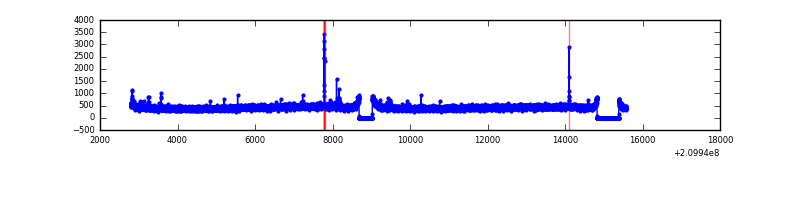 |
| D | 12783 | 11885 | 510 | 510 | 3.99% | 4.29% | 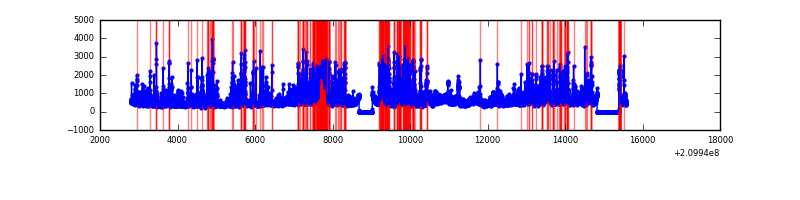 |
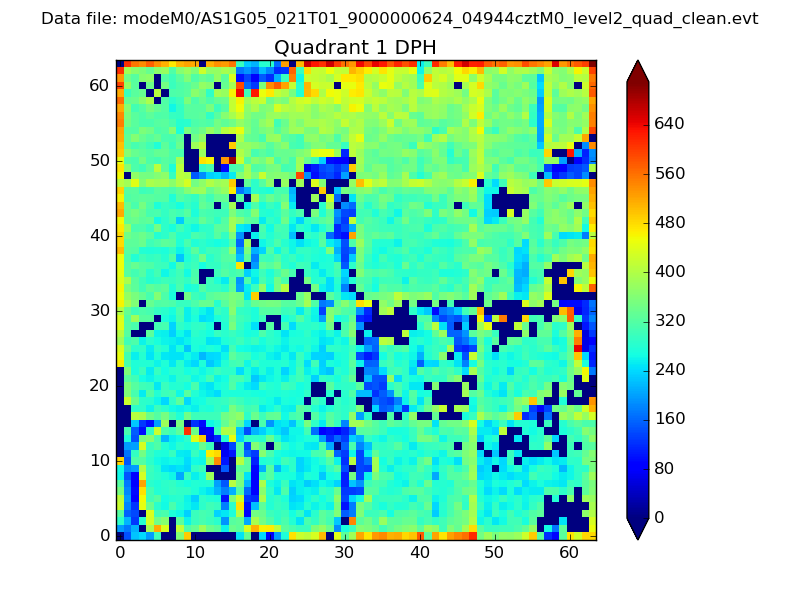
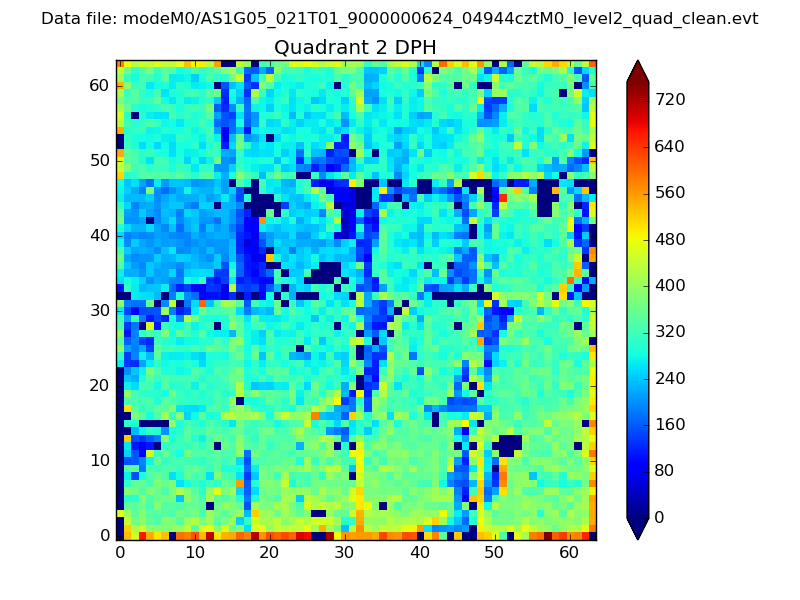
Top three noisy pixels from each quadrant. If the there are fewer than three noisy pixels in the level2.evt file, extra rows are filled as -1
| Pixel properties | Quadrant properties | ||||||
|---|---|---|---|---|---|---|---|
| Quadrant | DetID | PixID | Counts | Sigma | Mean | Median | Sigma |
| A | 0 | 31 | 4236341 | 16635.68 | 1239 | 1209 | 254.6 |
| A | 15 | 31 | 26547 | 99.53 | 1239 | 1209 | 254.6 |
| A | 12 | 194 | 12673 | 45.03 | 1239 | 1209 | 254.6 |
| B | 15 | 204 | 236433 | 917.97 | 1334 | 1301 | 256.1 |
| B | 10 | 16 | 216119 | 838.66 | 1334 | 1301 | 256.1 |
| B | 0 | 219 | 64494 | 246.71 | 1334 | 1301 | 256.1 |
| C | 1 | 16 | 37617 | 121.89 | 1287 | 1290 | 298.0 |
| C | 9 | 247 | 22153 | 70.0 | 1287 | 1290 | 298.0 |
| C | 13 | 61 | 10571 | 31.14 | 1287 | 1290 | 298.0 |
| D | 2 | 33 | 1373243 | 4460.16 | 1258 | 1218 | 307.6 |
| D | 12 | 22 | 825229 | 2678.68 | 1258 | 1218 | 307.6 |
| D | 13 | 235 | 230285 | 744.65 | 1258 | 1218 | 307.6 |
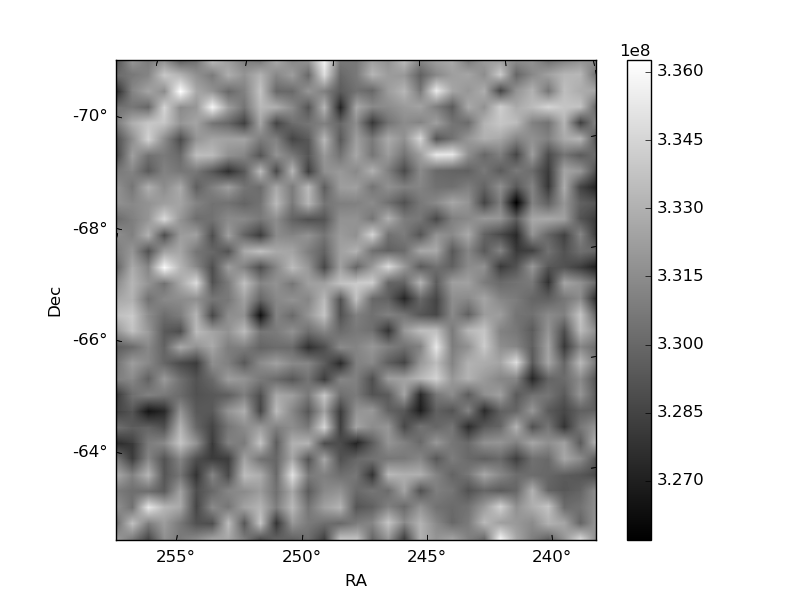
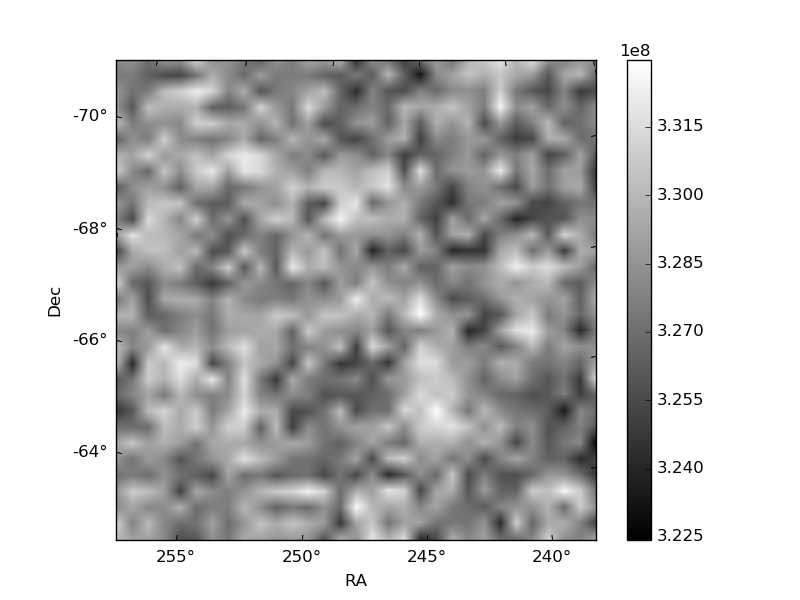
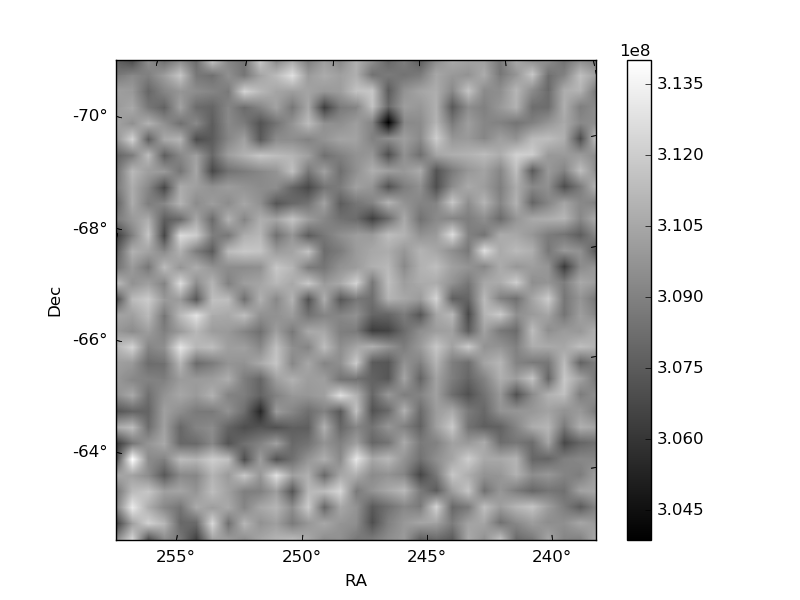
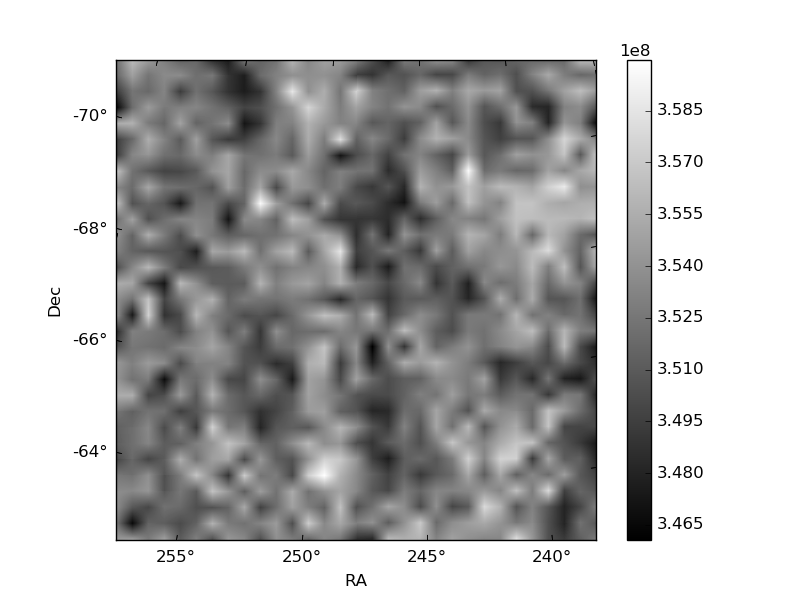
Histogram calculated using DETX and DETY for each event in the final _common_clean file
| Quadrant A | 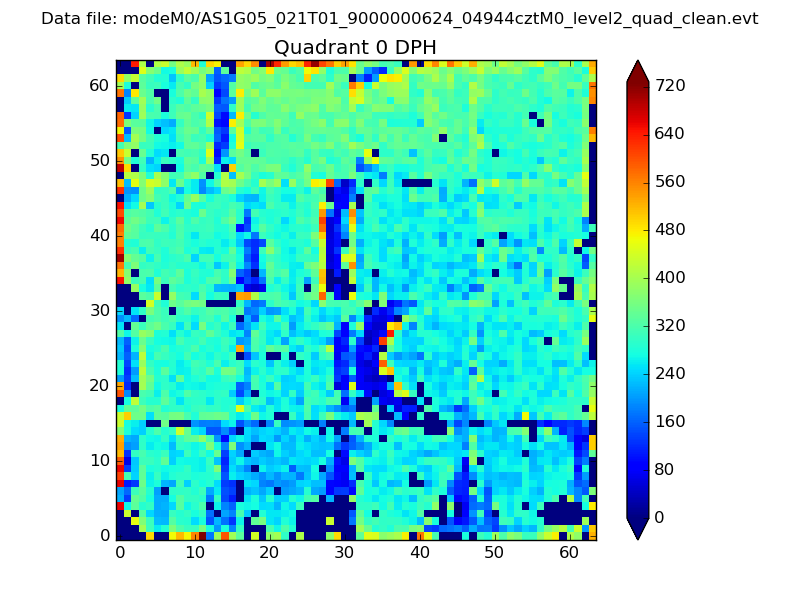 |
 |
Quadrant B |
|---|---|---|---|
| Quadrant D | 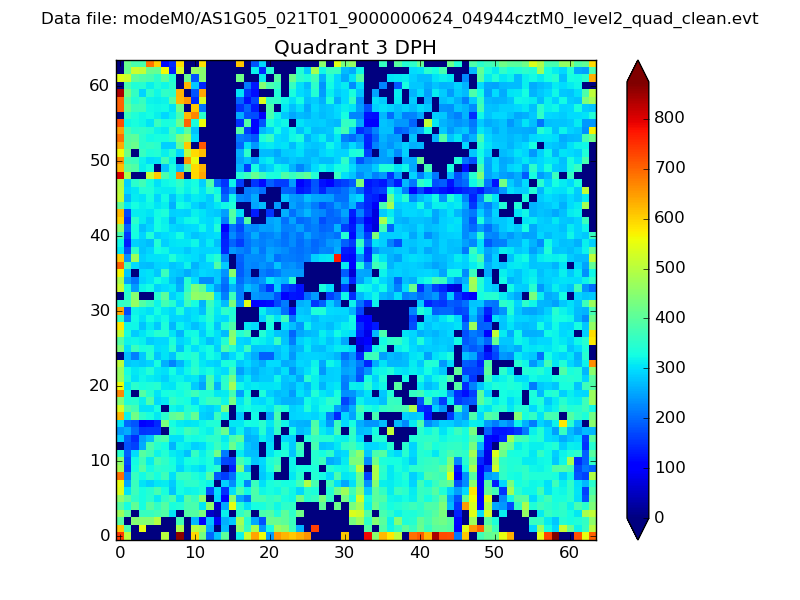 |
 |
Quadrant C |
| Plot type | Count rate plots | Images |
|---|---|---|
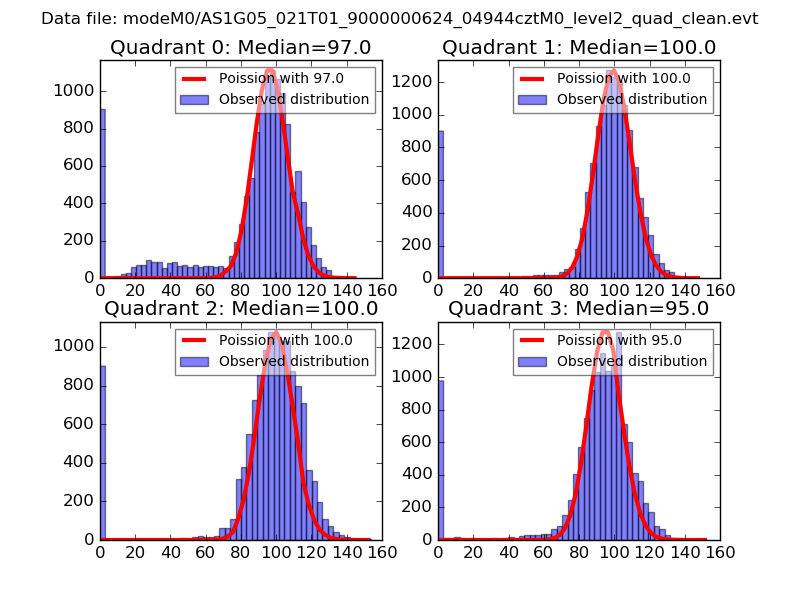
| Comparison with Poisson distribution Blue bars denote a histogram of data divided into 1 sec bins. Red curve is a Poisson curve with rate = median count rate of data. |
 |
 |
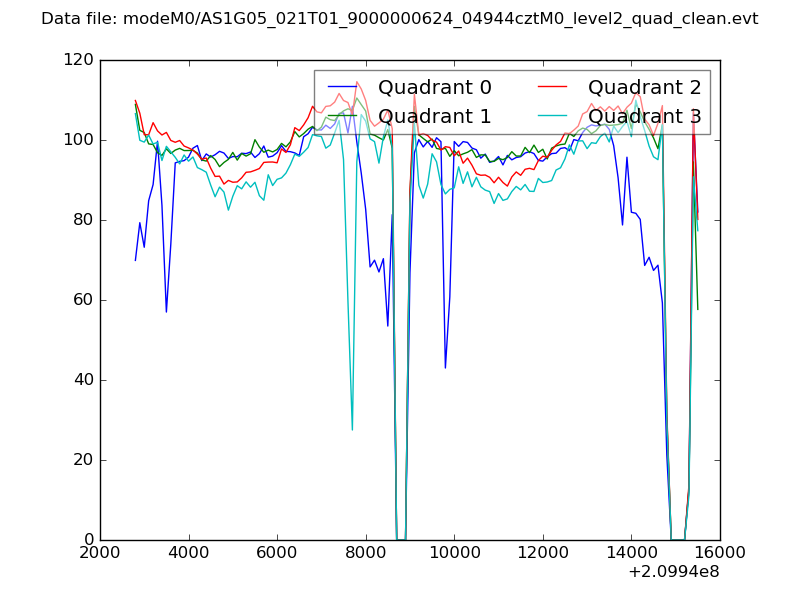
| Quadrant-wise count rates Data is divided into 100 sec bins |
 |
|
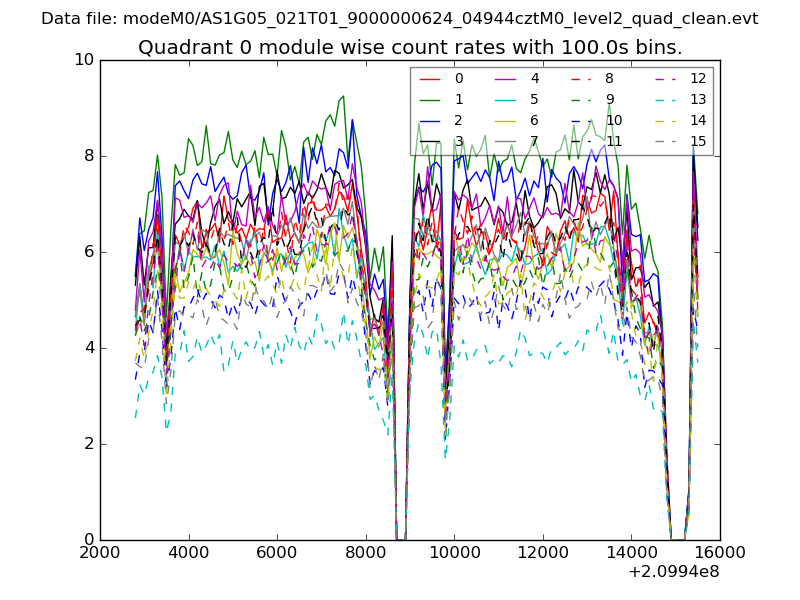
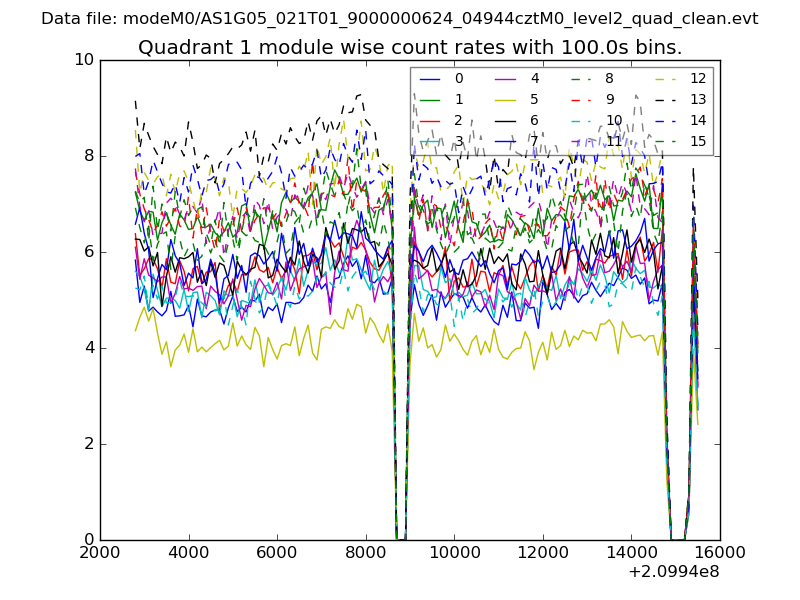
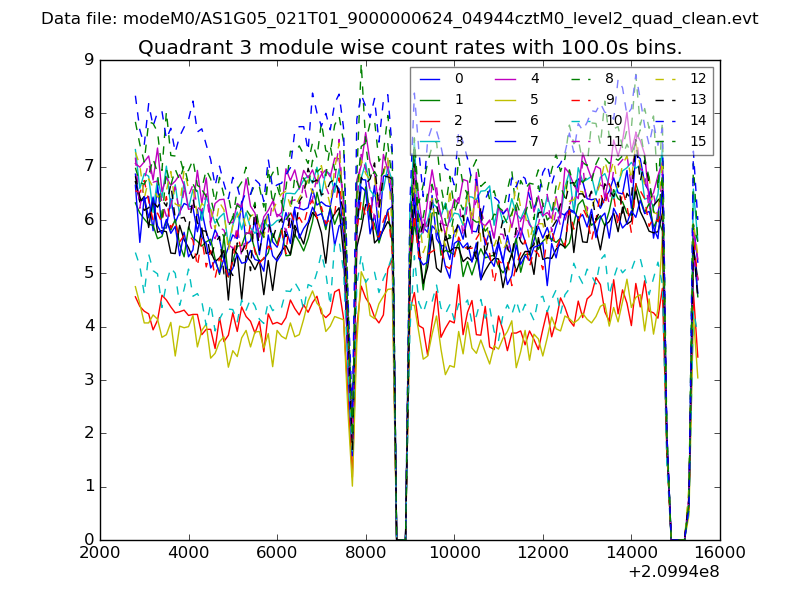
| Module-wise count rates for Quadrant A Data is divided into 100 sec bins |
 |
 |
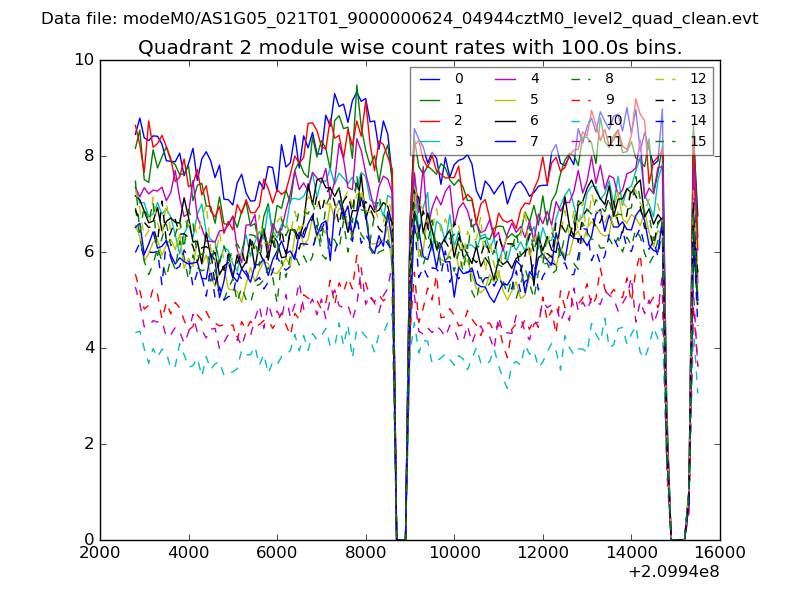
| Module-wise count rates for Quadrant B Data is divided into 100 sec bins |
 |
 |
| Module-wise count rates for Quadrant C Data is divided into 100 sec bins |
 |
 |
| Module-wise count rates for Quadrant D Data is divided into 100 sec bins |
 |
 |
| Parameter | Plot |
|---|---|
| CZT HV Monitor | 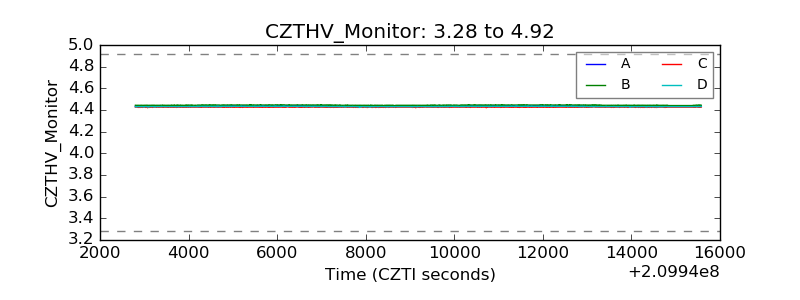 |
| D_VDD | 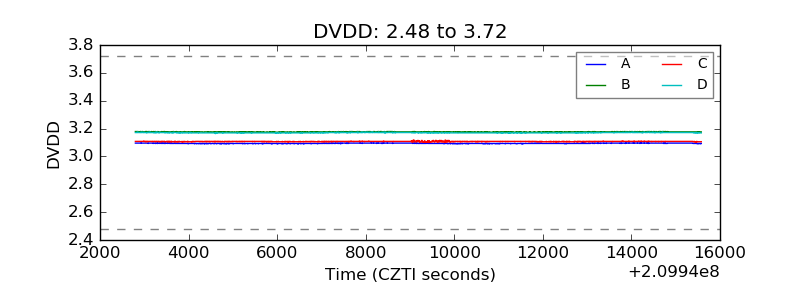 |
| Temperature 1 | 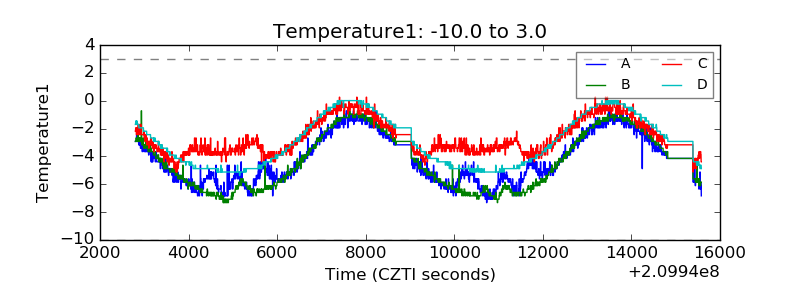 |
| Veto HV Monitor | 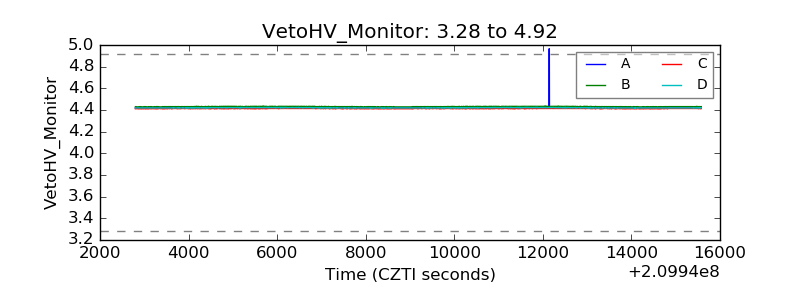 |
| Veto LLD | 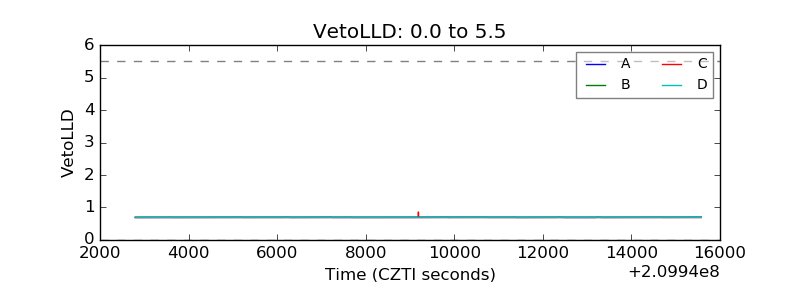 |
| Alpha Counter | 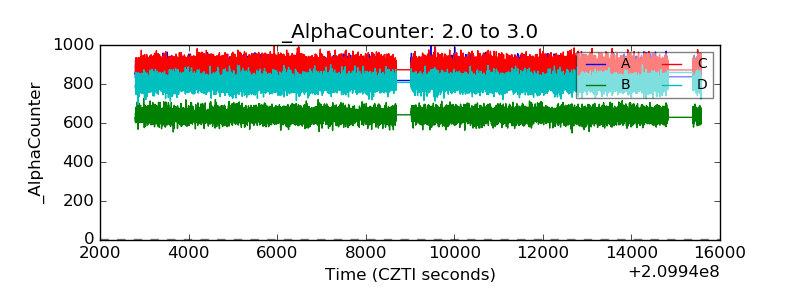 |
| _CPM_Rate | 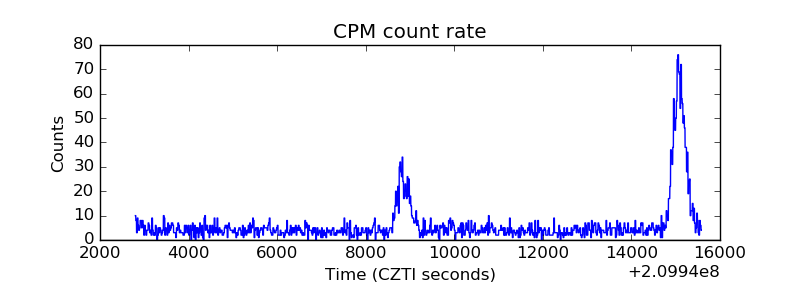 |
| CZT Counter | 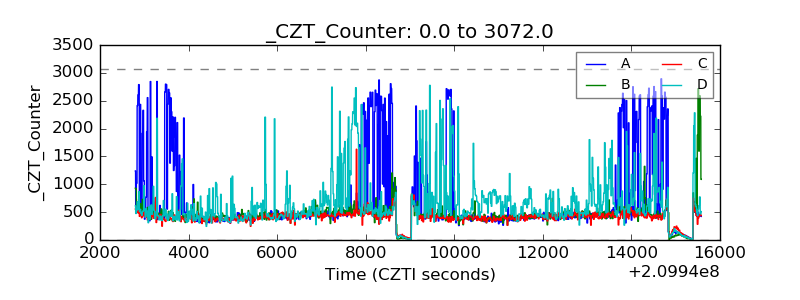 |
| +2.5 Volts monitor | 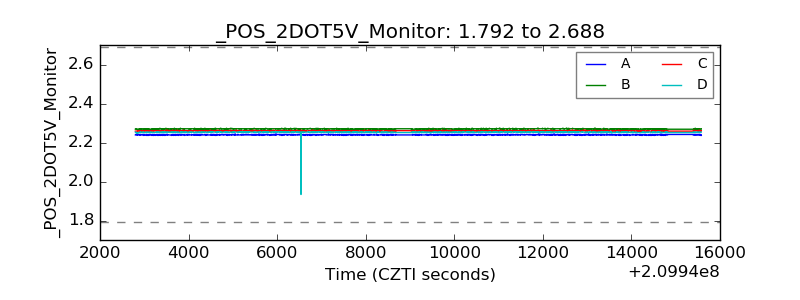 |
| +5 Volts monitor |  |
| _ROLL_ROT | 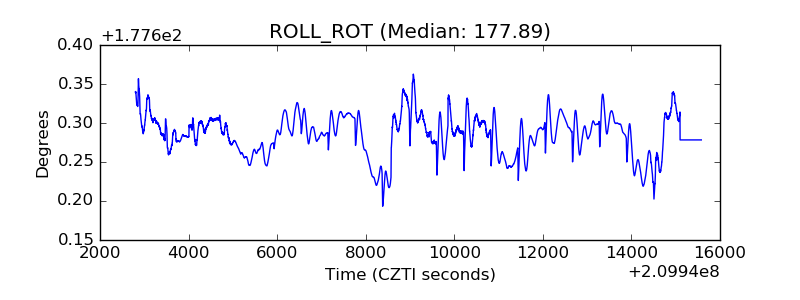 |
| _Roll_DEC | 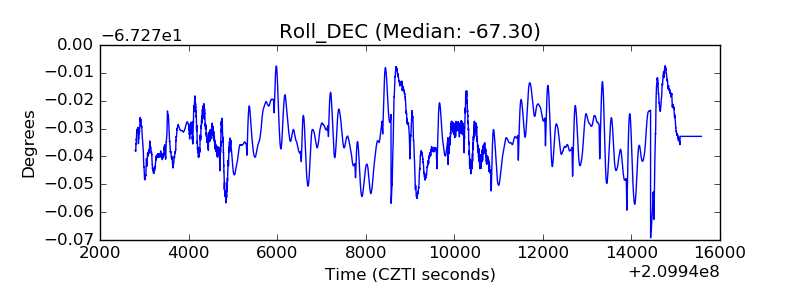 |
| _Roll_RA | 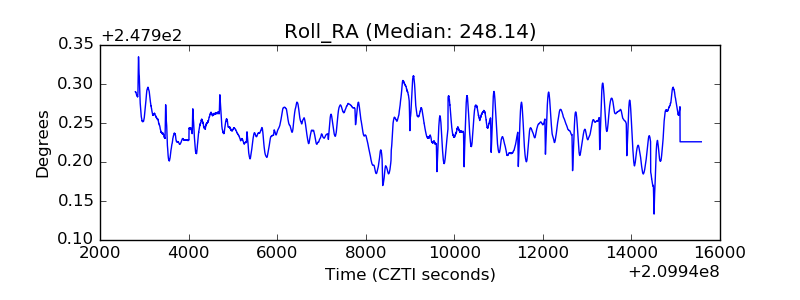 |
| Veto Counter | 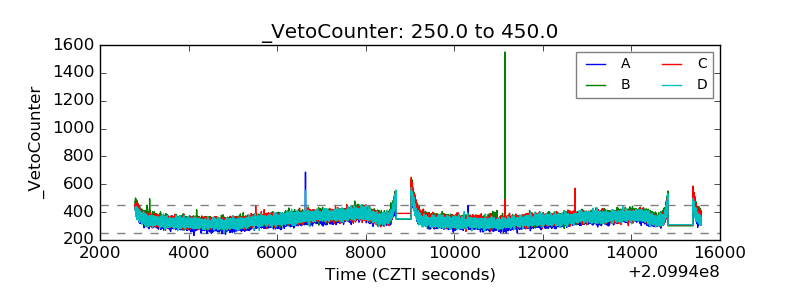 |