| Param | Original file | Final file |
|---|---|---|
| Filename | modeM0/AS1G05_157T01_9000000626cztM0_level2.fits | modeM0/AS1G05_157T01_9000000626cztM0_level2_quad_clean.evt |
| Size (bytes) | 684,037,440 | 730,247,040 |
| Size | 652.3 MB | 696.4 MB |
| Events in quadrant A | 4,014,544 | 4,281,195 |
| Events in quadrant B | 3,983,456 | 4,454,551 |
| Events in quadrant C | 4,093,864 | 4,384,038 |
| Events in quadrant D | 3,438,544 | 3,814,324 |
| Mode SS | |||
|---|---|---|---|
| Quadrant | BADHDUFLAG | Total packets | Discarded packets |
| A | 0 | 1544 | 0 |
| B | 0 | 1544 | 0 |
| C | 0 | 1544 | 0 |
| D | 0 | 1542 | 0 |
| Mode M0 | |||
|---|---|---|---|
| Quadrant | BADHDUFLAG | Total packets | Discarded packets |
| A | 0 | 189727 | 0 |
| B | 0 | 166005 | 0 |
| C | 0 | 154659 | 0 |
| D | 0 | 210175 | 0 |
| Mode M9 | |||
|---|---|---|---|
| Quadrant | BADHDUFLAG | Total packets | Discarded packets |
| A | 0 | 115 | 0 |
| B | 0 | 115 | 0 |
| C | 0 | 115 | 0 |
| D | 0 | 115 | 0 |
| Quadrant | Total seconds | Saturated seconds | Saturation percentage |
|---|---|---|---|
| A | 75569 | 4842 | 6.407389% |
| B | 75565 | 1413 | 1.869913% |
| C | 75565 | 520 | 0.688149% |
| D | 75562 | 4471 | 5.916995% |
Noise dominated data is calculated using 1-second bins in cleaned event files. If a bin has >2000 counts, and if more than 50% of those come from <1% of pixels, then it is considered to be noise-dominated and hence unusable.
| Quadrant | # 1 sec bins | Bins with >0 counts | Bins with >2000 counts | High rate bins dominated by noise | Noise dominated (total time) | Noise dominated (detector-on time) | Marked lightcurve |
|---|---|---|---|---|---|---|---|
| A | 87163 | 74769 | 0 | 0 | 0.00% | 0.00% |  |
| B | 87163 | 75552 | 0 | 0 | 0.00% | 0.00% |  |
| C | 87163 | 75562 | 0 | 0 | 0.00% | 0.00% |  |
| D | 87163 | 75348 | 0 | 0 | 0.00% | 0.00% |  |
Top three noisy pixels from each quadrant. If the there are fewer than three noisy pixels in the level2.evt file, extra rows are filled as -1
| Pixel properties | Quadrant properties | ||||||
|---|---|---|---|---|---|---|---|
| Quadrant | DetID | PixID | Counts | Sigma | Mean | Median | Sigma |
| A | 14 | 188 | 3997 | 11.38 | 1041 | 971 | 265.8 |
| A | 0 | 29 | 3852 | 10.84 | 1041 | 971 | 265.8 |
| A | 14 | 204 | 3529 | 9.62 | 1041 | 971 | 265.8 |
| B | 2 | 9 | 3431 | 11.52 | 1053 | 1004 | 210.7 |
| B | 12 | 226 | 2927 | 9.13 | 1053 | 1004 | 210.7 |
| B | 14 | 254 | 2750 | 8.29 | 1053 | 1004 | 210.7 |
| C | 1 | 81 | 3067 | 7.28 | 1080 | 1001 | 283.9 |
| C | 1 | 80 | 3063 | 7.26 | 1080 | 1001 | 283.9 |
| C | 12 | 241 | 2919 | 6.76 | 1080 | 1001 | 283.9 |
| D | 11 | 82 | 2706 | 6.85 | 980 | 889 | 265.3 |
| D | 3 | 14 | 2590 | 6.41 | 980 | 889 | 265.3 |
| D | 4 | 160 | 2528 | 6.18 | 980 | 889 | 265.3 |
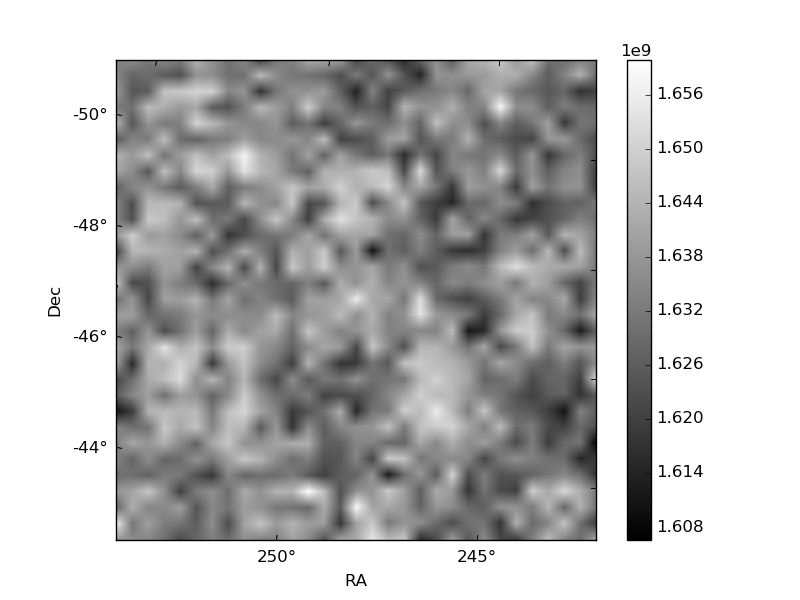
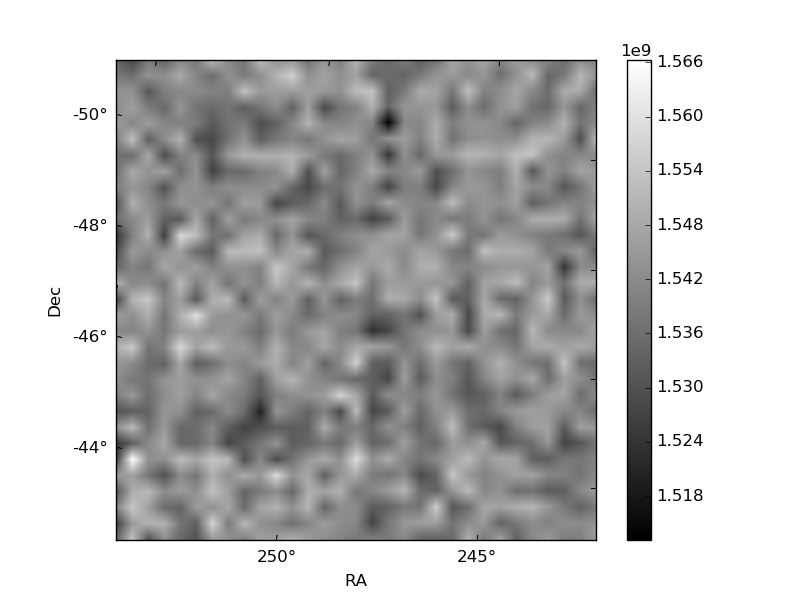
Histogram calculated using DETX and DETY for each event in the final _common_clean file
| Quadrant A |  |
 |
Quadrant B |
|---|---|---|---|
| Quadrant D |  |
 |
Quadrant C |
| Plot type | Count rate plots | Images |
|---|---|---|
| Comparison with Poisson distribution Blue bars denote a histogram of data divided into 1 sec bins. Red curve is a Poisson curve with rate = median count rate of data. |
 |
 |
| Quadrant-wise count rates Data is divided into 100 sec bins |
 |
|
| Module-wise count rates for Quadrant A Data is divided into 100 sec bins |
 |
 |
| Module-wise count rates for Quadrant B Data is divided into 100 sec bins |
 |
 |
| Module-wise count rates for Quadrant C Data is divided into 100 sec bins |
 |
 |
| Module-wise count rates for Quadrant D Data is divided into 100 sec bins |
 |
 |
| Parameter | Plot |
|---|---|
| CZT HV Monitor |  |
| D_VDD |  |
| Temperature 1 |  |
| Veto HV Monitor |  |
| Veto LLD |  |
| Alpha Counter |  |
| _CPM_Rate |  |
| CZT Counter |  |
| +2.5 Volts monitor |  |
| +5 Volts monitor |  |
| _ROLL_ROT |  |
| _Roll_DEC |  |
| _Roll_RA |  |
| Veto Counter |  |