| Param | Original file | Final file |
|---|---|---|
| Filename | modeM0/AS1G05_157T01_9000000626_04944cztM0_level2.evt | modeM0/AS1G05_157T01_9000000626_04944cztM0_level2_quad_clean.evt |
| Size (bytes) | 1,011,968,640 | 115,591,680 |
| Size | 965.1 MB | 110.2 MB |
| Events in quadrant A | 11,106,925 | 593,853 |
| Events in quadrant B | 5,922,828 | 701,927 |
| Events in quadrant C | 5,179,965 | 709,826 |
| Events in quadrant D | 7,626,575 | 664,336 |
| Mode SS | |||
|---|---|---|---|
| Quadrant | BADHDUFLAG | Total packets | Discarded packets |
| A | 0 | 246 | 0 |
| B | 0 | 246 | 0 |
| C | 0 | 246 | 0 |
| D | 0 | 246 | 0 |
| Mode M0 | |||
|---|---|---|---|
| Quadrant | BADHDUFLAG | Total packets | Discarded packets |
| A | 0 | 41540 | 3 |
| B | 0 | 25590 | 2 |
| C | 0 | 24278 | 2 |
| D | 0 | 31150 | 2 |
| Mode M9 | |||
|---|---|---|---|
| Quadrant | BADHDUFLAG | Total packets | Discarded packets |
| A | 0 | 14 | 0 |
| B | 0 | 14 | 0 |
| C | 0 | 14 | 0 |
| D | 0 | 14 | 0 |
| Quadrant | Total seconds | Saturated seconds | Saturation percentage |
|---|---|---|---|
| A | 11988 | 2492 | 20.787454% |
| B | 11988 | 128 | 1.067734% |
| C | 11988 | 75 | 0.625626% |
| D | 11988 | 378 | 3.153153% |
Noise dominated data is calculated using 1-second bins in cleaned event files. If a bin has >2000 counts, and if more than 50% of those come from <1% of pixels, then it is considered to be noise-dominated and hence unusable.
| Quadrant | # 1 sec bins | Bins with >0 counts | Bins with >2000 counts | High rate bins dominated by noise | Noise dominated (total time) | Noise dominated (detector-on time) | Marked lightcurve |
|---|---|---|---|---|---|---|---|
| A | 13528 | 11988 | 2235 | 2235 | 16.52% | 18.64% | 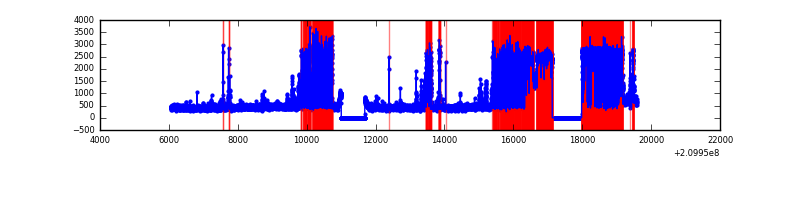 |
| B | 13528 | 11988 | 45 | 45 | 0.33% | 0.38% | 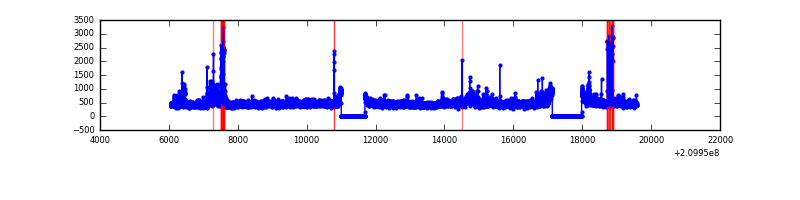 |
| C | 13528 | 11988 | 0 | 0 | 0.00% | 0.00% | 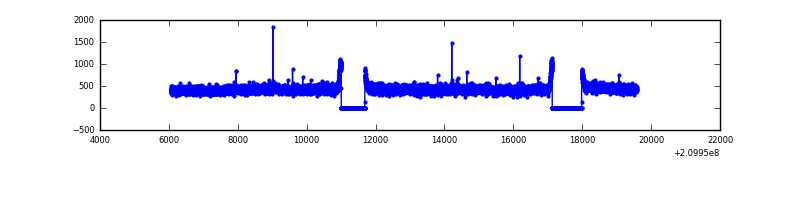 |
| D | 13528 | 11988 | 265 | 265 | 1.96% | 2.21% | 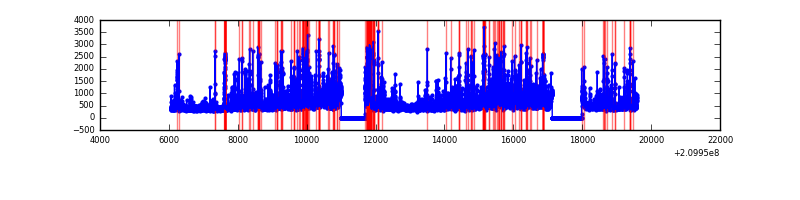 |
Top three noisy pixels from each quadrant. If the there are fewer than three noisy pixels in the level2.evt file, extra rows are filled as -1
| Pixel properties | Quadrant properties | ||||||
|---|---|---|---|---|---|---|---|
| Quadrant | DetID | PixID | Counts | Sigma | Mean | Median | Sigma |
| A | 0 | 31 | 6454905 | 27052.11 | 1173 | 1146 | 238.6 |
| A | 0 | 50 | 87525 | 362.07 | 1173 | 1146 | 238.6 |
| A | 15 | 31 | 19730 | 77.9 | 1173 | 1146 | 238.6 |
| B | 10 | 16 | 435025 | 1662.96 | 1371 | 1339 | 260.8 |
| B | 15 | 204 | 75451 | 284.18 | 1371 | 1339 | 260.8 |
| B | 0 | 219 | 57619 | 215.8 | 1371 | 1339 | 260.8 |
| C | 13 | 61 | 10829 | 31.18 | 1321 | 1325 | 304.8 |
| C | 1 | 16 | 9588 | 27.11 | 1321 | 1325 | 304.8 |
| C | 14 | 67 | 6460 | 16.85 | 1321 | 1325 | 304.8 |
| D | 2 | 33 | 594770 | 1848.27 | 1305 | 1263 | 321.1 |
| D | 12 | 233 | 407273 | 1264.37 | 1305 | 1263 | 321.1 |
| D | 7 | 67 | 354935 | 1101.39 | 1305 | 1263 | 321.1 |
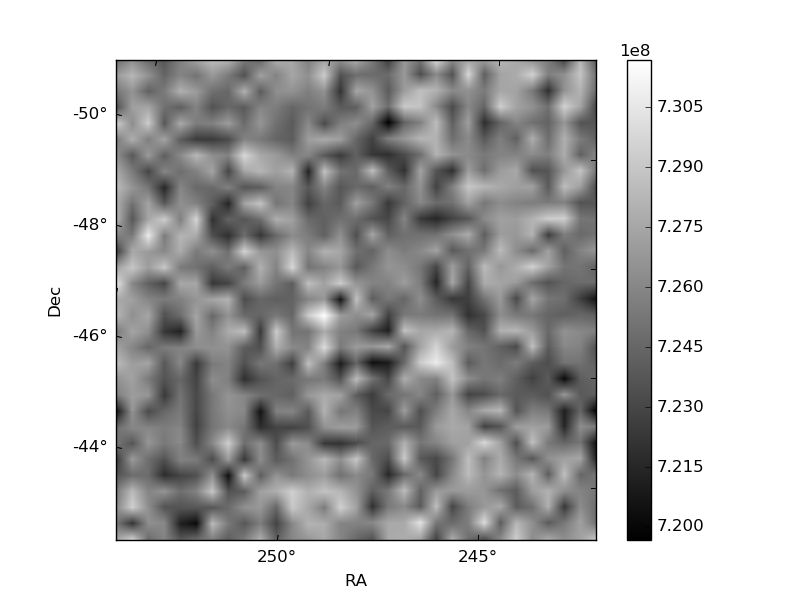
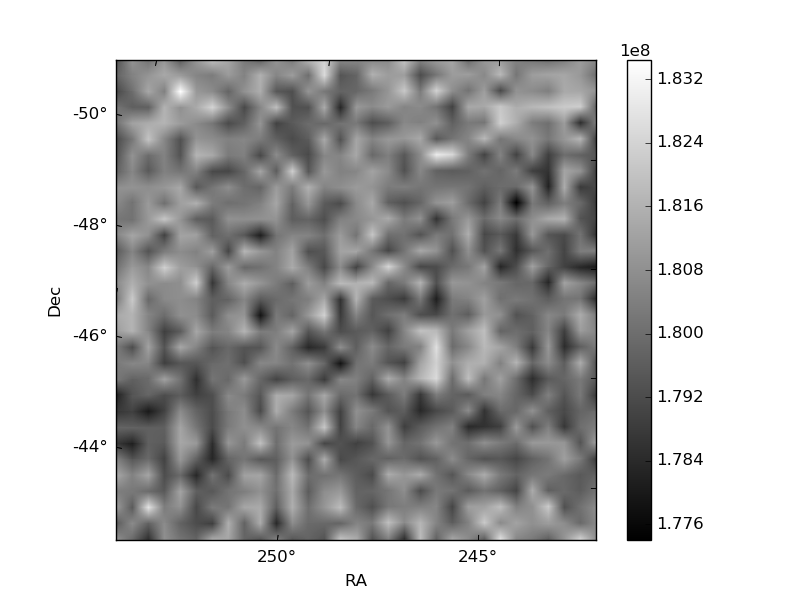
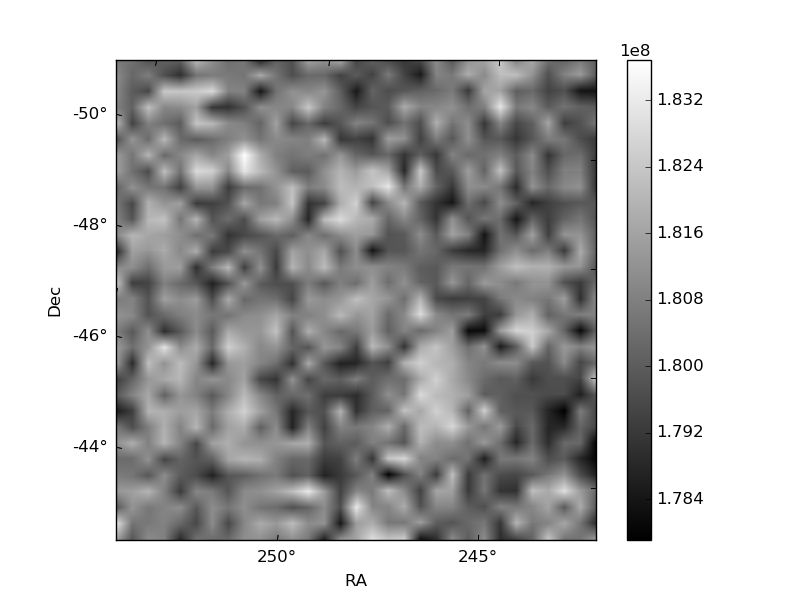
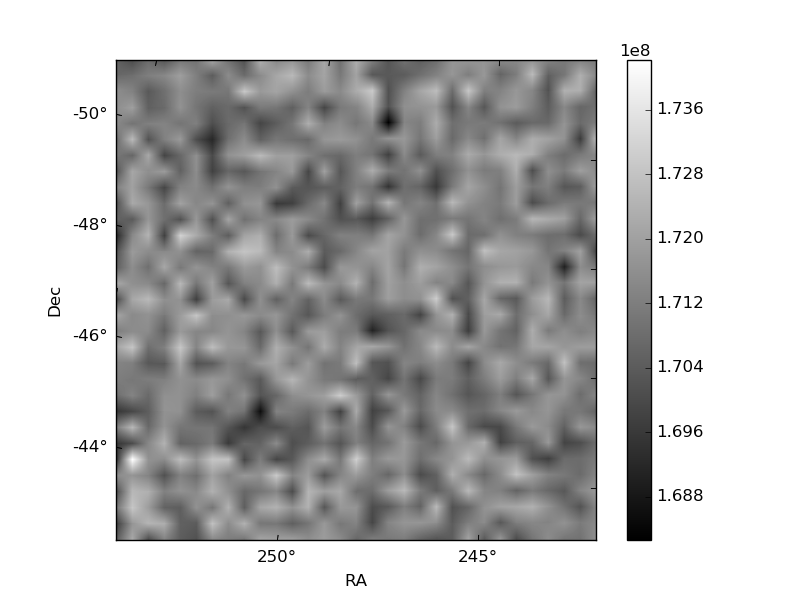
Histogram calculated using DETX and DETY for each event in the final _common_clean file
| Quadrant A | 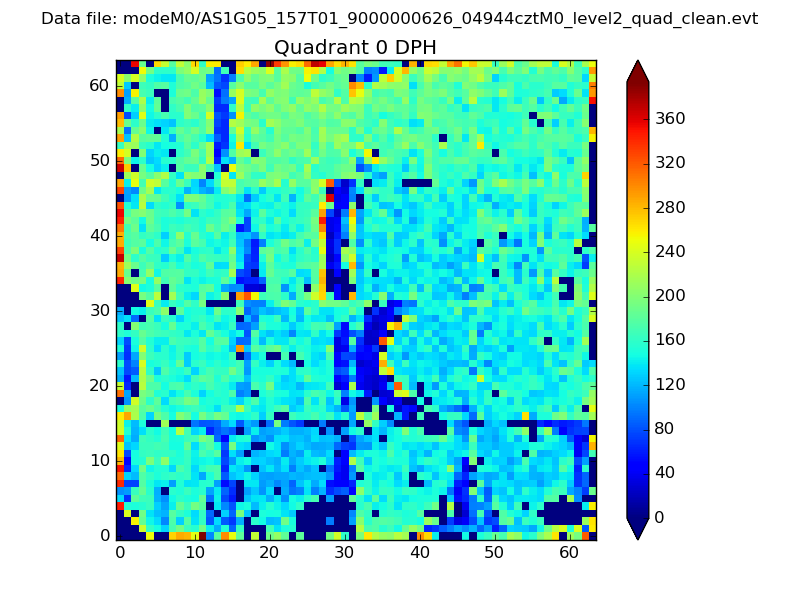 |
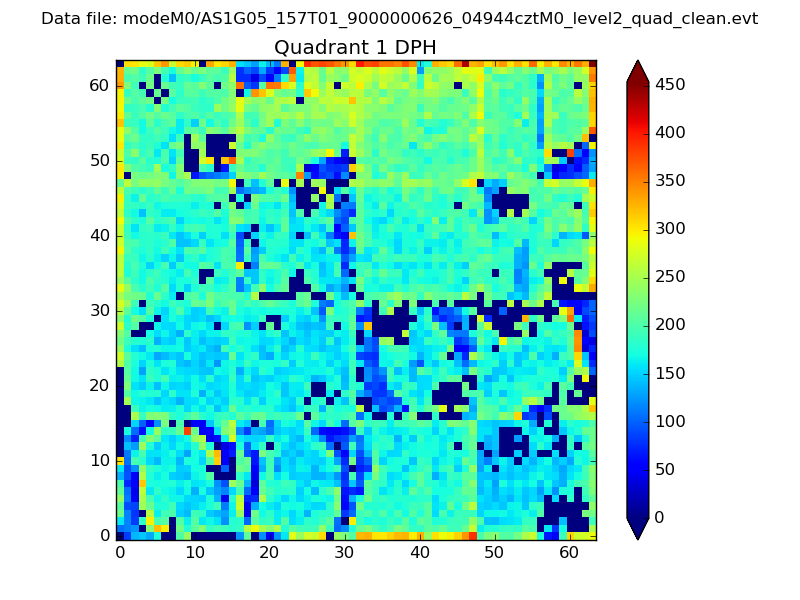 |
Quadrant B |
|---|---|---|---|
| Quadrant D | 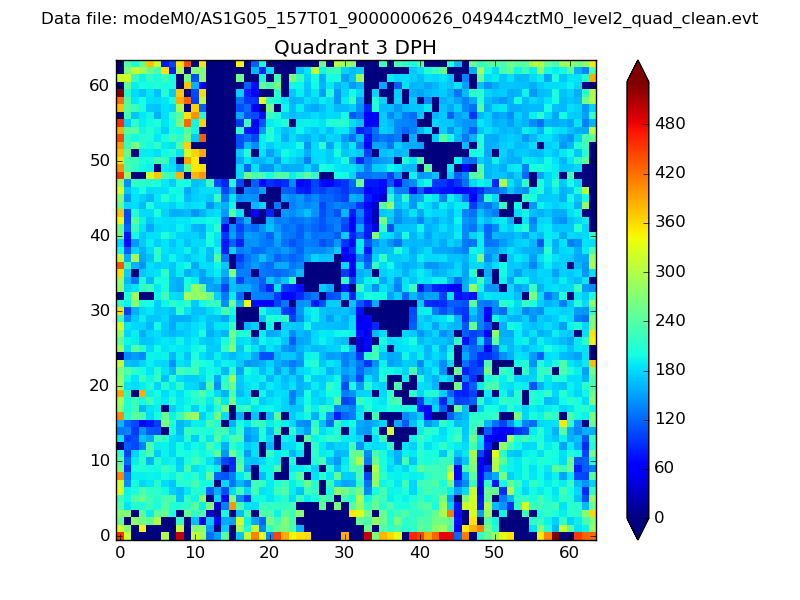 |
 |
Quadrant C |
| Plot type | Count rate plots | Images |
|---|---|---|
| Comparison with Poisson distribution Blue bars denote a histogram of data divided into 1 sec bins. Red curve is a Poisson curve with rate = median count rate of data. |
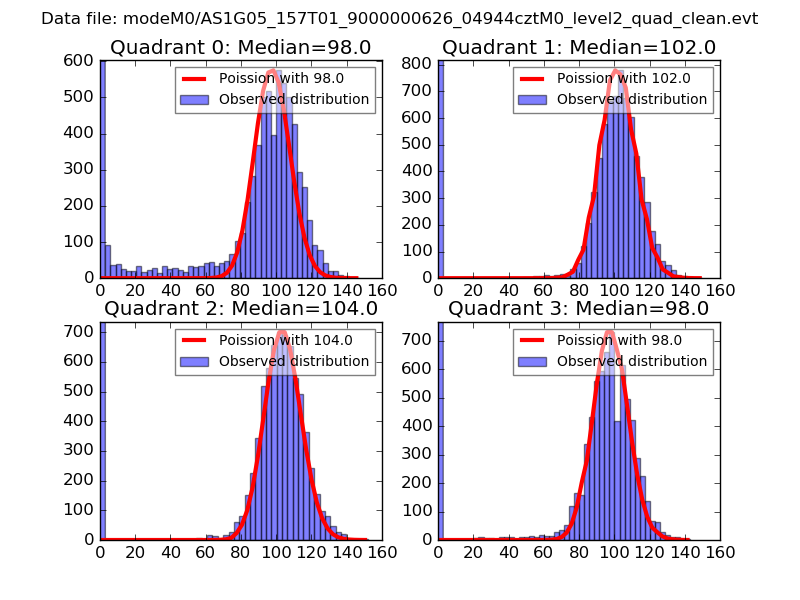 |
 |
| Quadrant-wise count rates Data is divided into 100 sec bins |
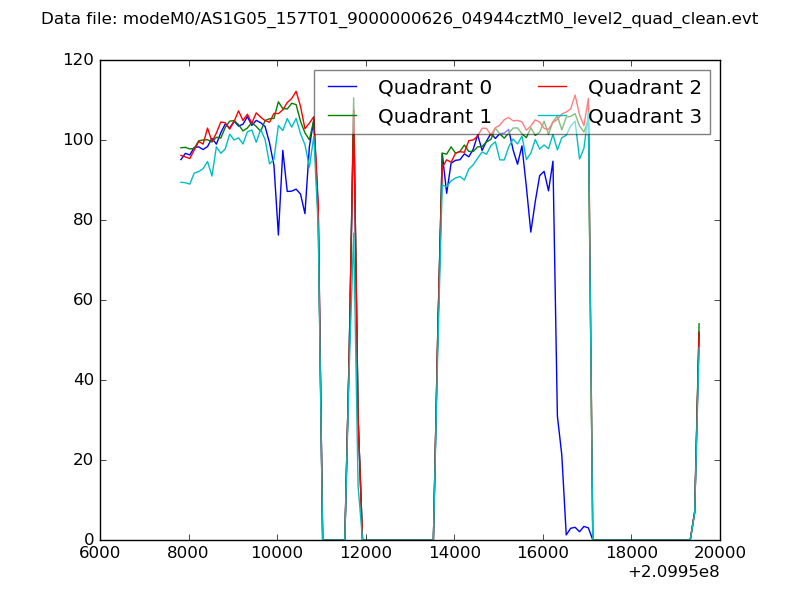 |
|
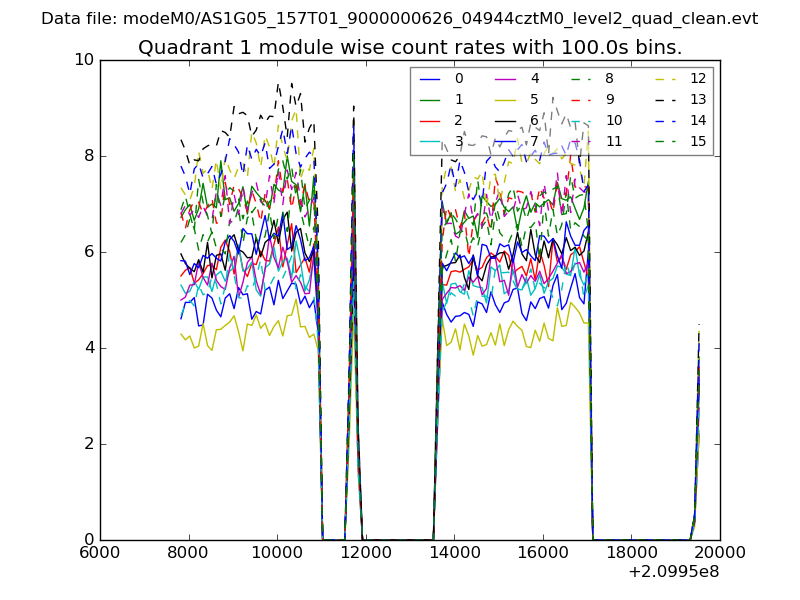
| Module-wise count rates for Quadrant A Data is divided into 100 sec bins |
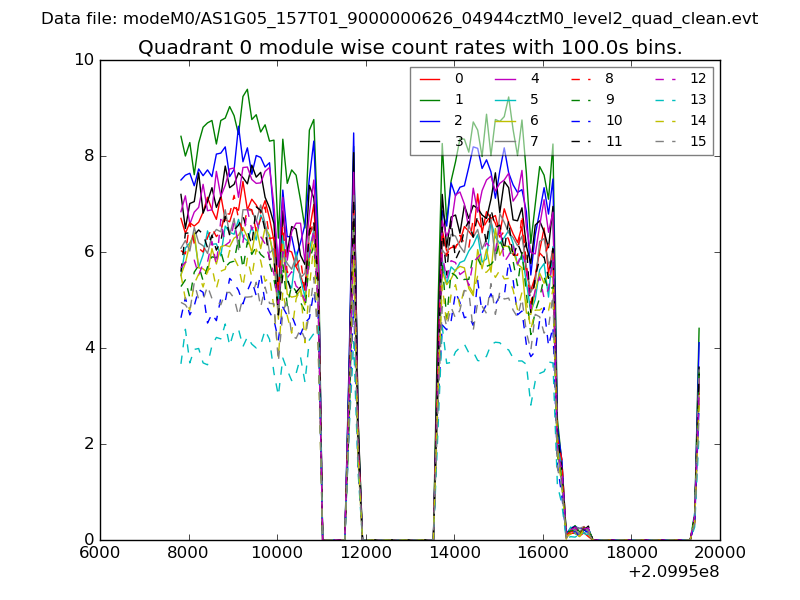 |
 |
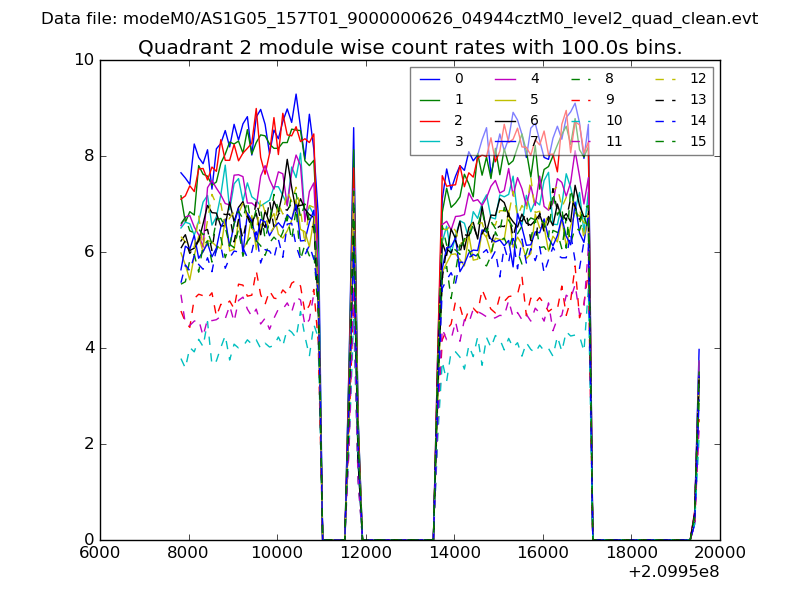
| Module-wise count rates for Quadrant B Data is divided into 100 sec bins |
 |
 |
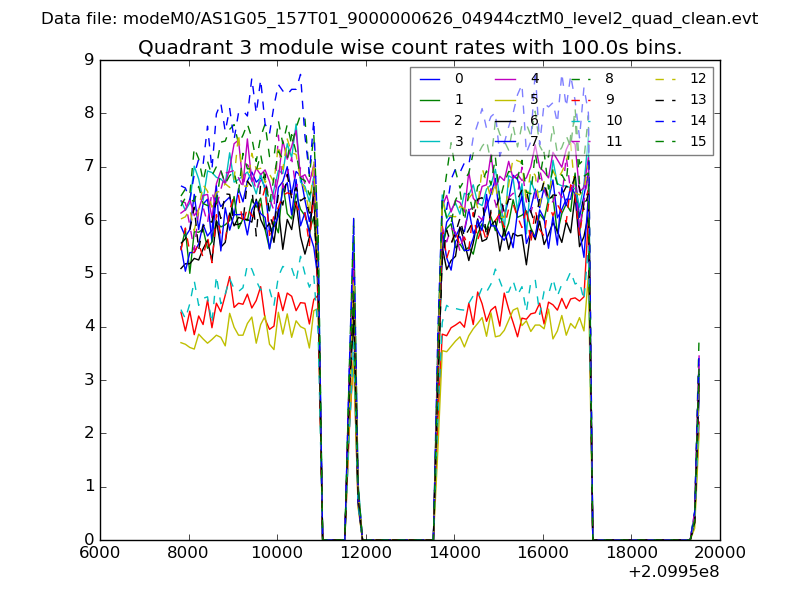
| Module-wise count rates for Quadrant C Data is divided into 100 sec bins |
 |
 |
| Module-wise count rates for Quadrant D Data is divided into 100 sec bins |
 |
 |
| Parameter | Plot |
|---|---|
| CZT HV Monitor | 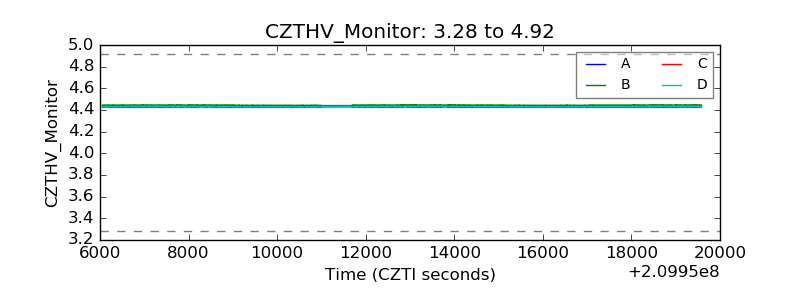 |
| D_VDD | 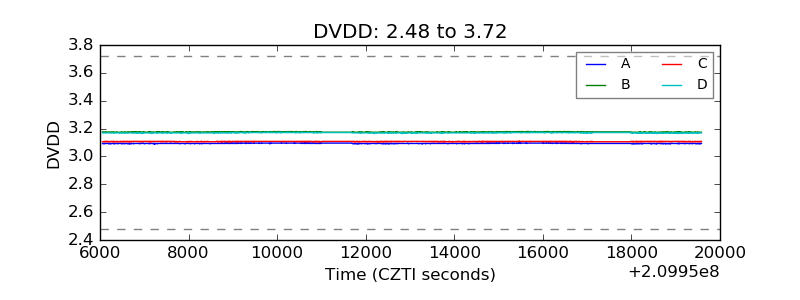 |
| Temperature 1 | 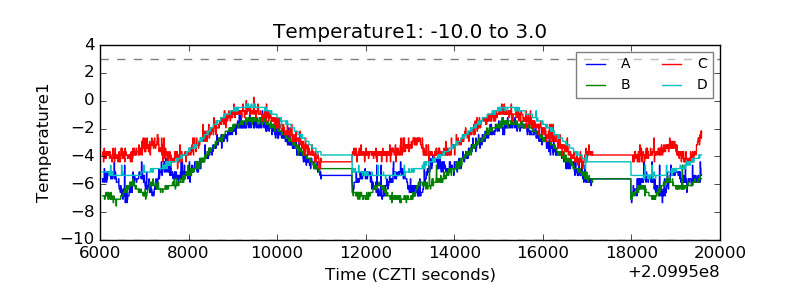 |
| Veto HV Monitor | 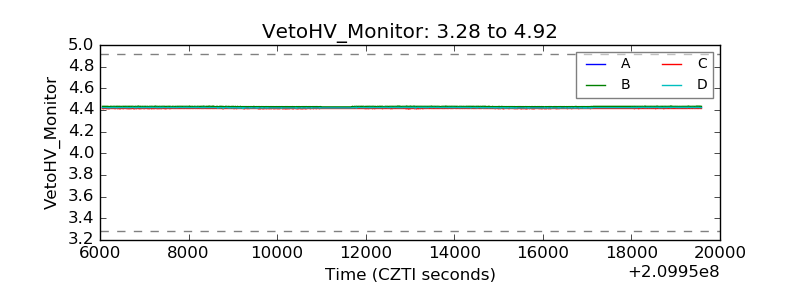 |
| Veto LLD | 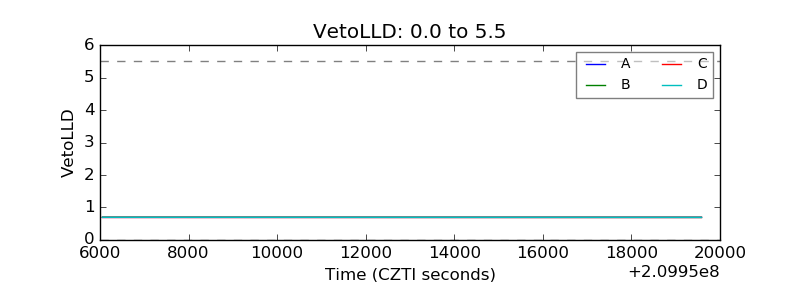 |
| Alpha Counter | 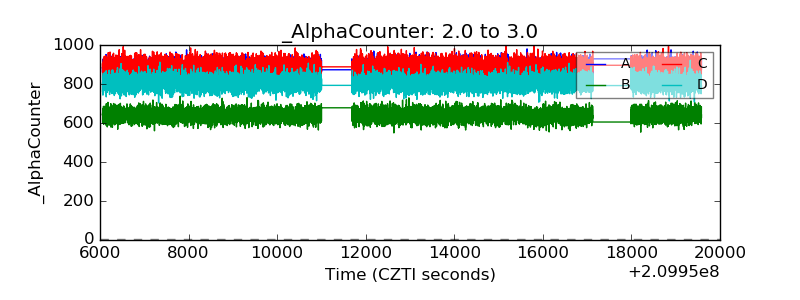 |
| _CPM_Rate | 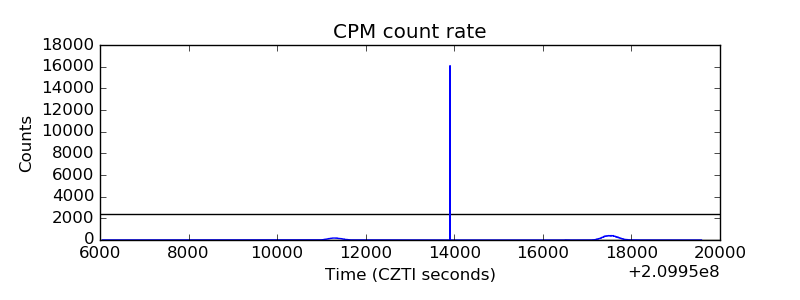 |
| CZT Counter |  |
| +2.5 Volts monitor |  |
| +5 Volts monitor |  |
| _ROLL_ROT | 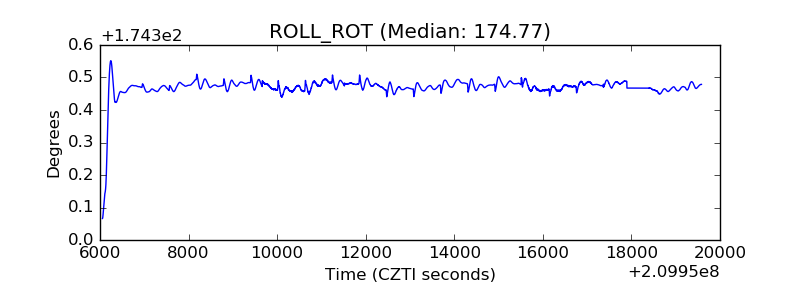 |
| _Roll_DEC | 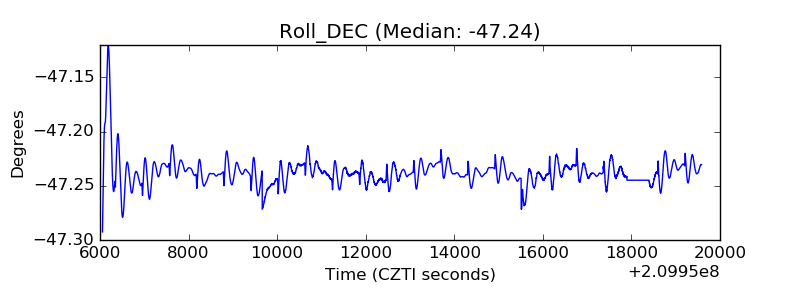 |
| _Roll_RA | 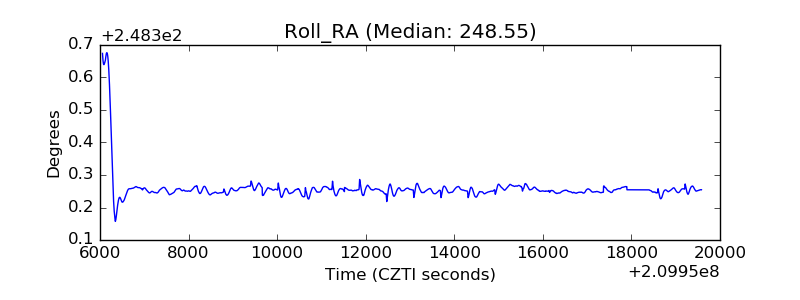 |
| Veto Counter | 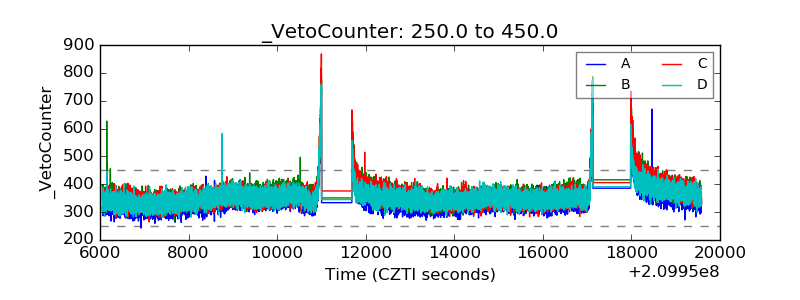 |