| Param | Original file | Final file |
|---|---|---|
| Filename | modeM0/AS1G05_157T01_9000000626_04945cztM0_level2.evt | modeM0/AS1G05_157T01_9000000626_04945cztM0_level2_quad_clean.evt |
| Size (bytes) | 506,848,320 | 69,174,720 |
| Size | 483.4 MB | 66.0 MB |
| Events in quadrant A | 4,927,624 | 413,012 |
| Events in quadrant B | 3,209,192 | 415,462 |
| Events in quadrant C | 2,845,096 | 423,595 |
| Events in quadrant D | 3,935,148 | 397,743 |
| Mode SS | |||
|---|---|---|---|
| Quadrant | BADHDUFLAG | Total packets | Discarded packets |
| A | 0 | 128 | 0 |
| B | 0 | 128 | 0 |
| C | 0 | 128 | 0 |
| D | 0 | 128 | 0 |
| Mode M0 | |||
|---|---|---|---|
| Quadrant | BADHDUFLAG | Total packets | Discarded packets |
| A | 0 | 19063 | 2 |
| B | 0 | 13651 | 1 |
| C | 0 | 12978 | 1 |
| D | 0 | 15978 | 1 |
| Mode M9 | |||
|---|---|---|---|
| Quadrant | BADHDUFLAG | Total packets | Discarded packets |
| A | 0 | 10 | 0 |
| B | 0 | 10 | 0 |
| C | 0 | 10 | 0 |
| D | 0 | 10 | 0 |
| Quadrant | Total seconds | Saturated seconds | Saturation percentage |
|---|---|---|---|
| A | 6376 | 835 | 13.095985% |
| B | 6376 | 123 | 1.929109% |
| C | 6376 | 72 | 1.129235% |
| D | 6376 | 221 | 3.466123% |
Noise dominated data is calculated using 1-second bins in cleaned event files. If a bin has >2000 counts, and if more than 50% of those come from <1% of pixels, then it is considered to be noise-dominated and hence unusable.
| Quadrant | # 1 sec bins | Bins with >0 counts | Bins with >2000 counts | High rate bins dominated by noise | Noise dominated (total time) | Noise dominated (detector-on time) | Marked lightcurve |
|---|---|---|---|---|---|---|---|
| A | 7356 | 6376 | 737 | 737 | 10.02% | 11.56% | 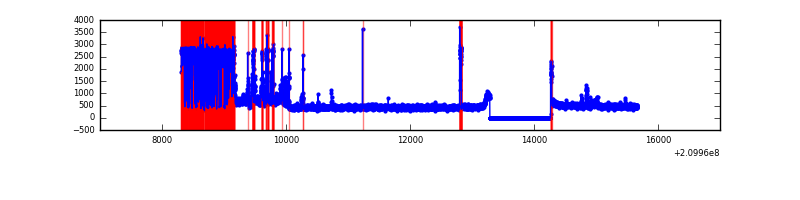 |
| B | 7356 | 6376 | 42 | 42 | 0.57% | 0.66% | 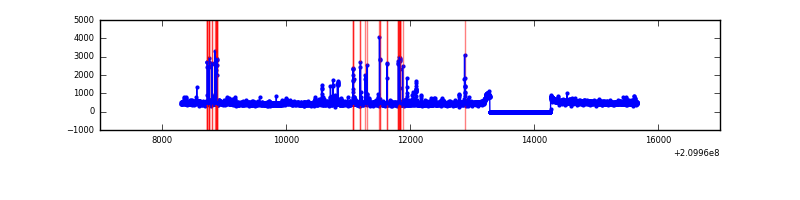 |
| C | 7356 | 6376 | 0 | 0 | 0.00% | 0.00% | 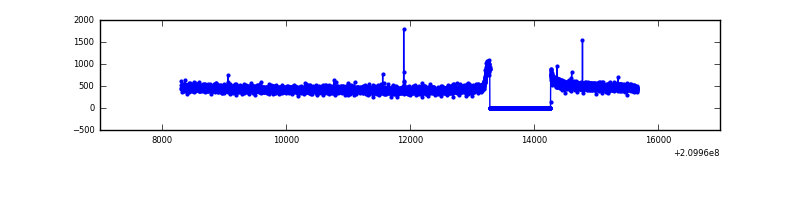 |
| D | 7356 | 6376 | 143 | 143 | 1.94% | 2.24% | 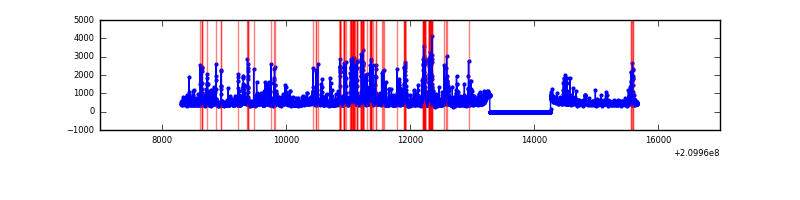 |
Top three noisy pixels from each quadrant. If the there are fewer than three noisy pixels in the level2.evt file, extra rows are filled as -1
| Pixel properties | Quadrant properties | ||||||
|---|---|---|---|---|---|---|---|
| Quadrant | DetID | PixID | Counts | Sigma | Mean | Median | Sigma |
| A | 0 | 31 | 2234864 | 15745.38 | 689 | 674 | 141.9 |
| A | 0 | 50 | 28948 | 199.26 | 689 | 674 | 141.9 |
| A | 13 | 251 | 8043 | 51.93 | 689 | 674 | 141.9 |
| B | 10 | 16 | 189100 | 1326.78 | 746 | 728 | 142.0 |
| B | 15 | 204 | 68464 | 477.09 | 746 | 728 | 142.0 |
| B | 0 | 219 | 37441 | 258.58 | 746 | 728 | 142.0 |
| C | 13 | 61 | 6071 | 31.79 | 726 | 729 | 168.1 |
| C | 12 | 4 | 4389 | 21.78 | 726 | 729 | 168.1 |
| C | 1 | 16 | 3572 | 16.92 | 726 | 729 | 168.1 |
| D | 2 | 33 | 418921 | 2391.39 | 716 | 695 | 174.9 |
| D | 2 | 234 | 264318 | 1507.38 | 716 | 695 | 174.9 |
| D | 7 | 67 | 137298 | 781.09 | 716 | 695 | 174.9 |
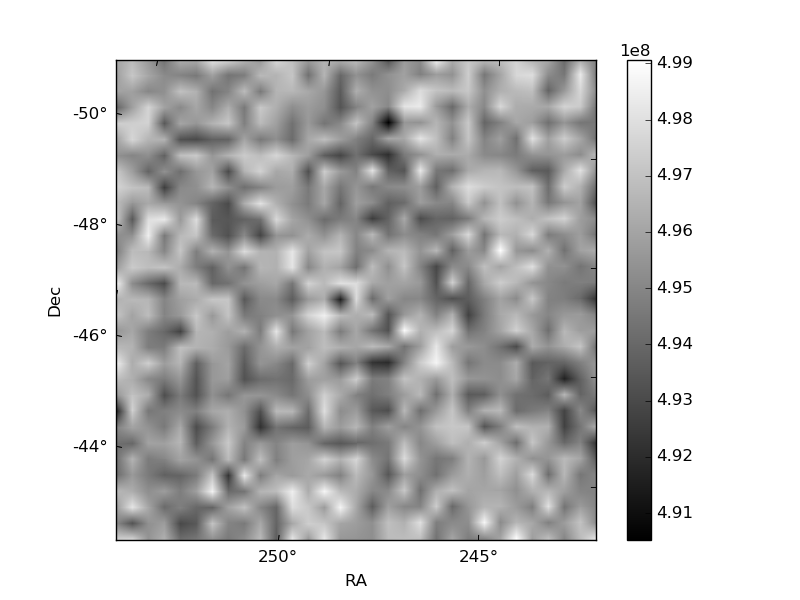
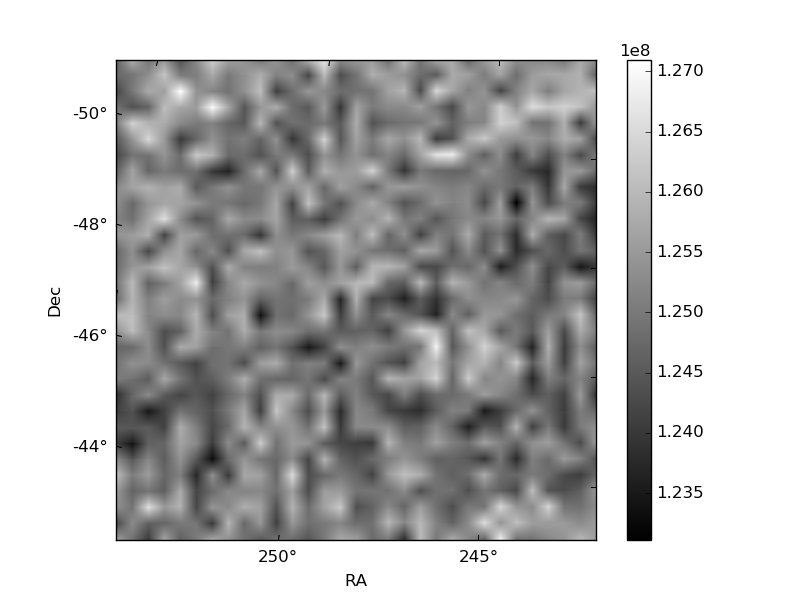
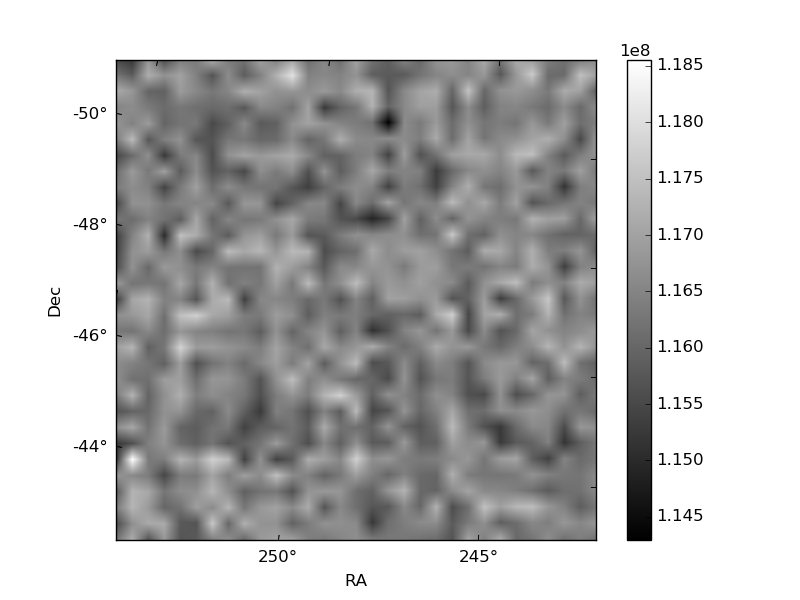
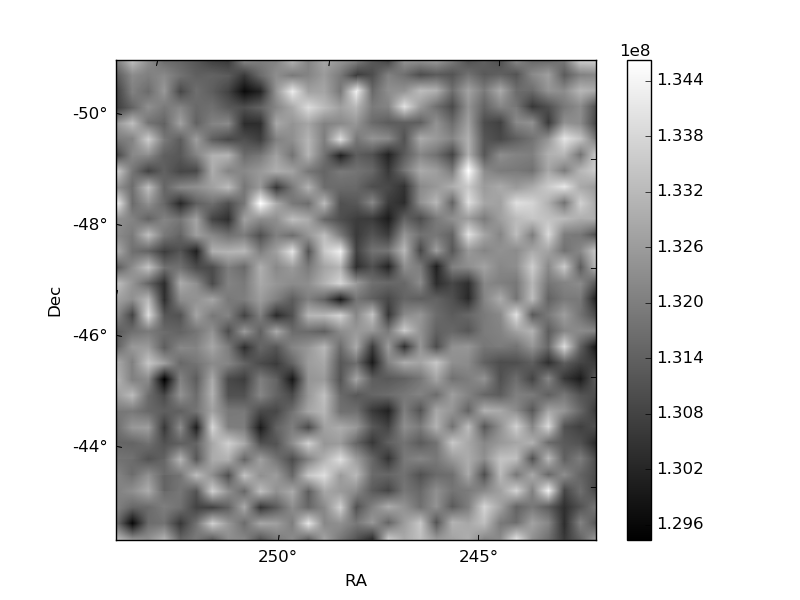
Histogram calculated using DETX and DETY for each event in the final _common_clean file
| Quadrant A | 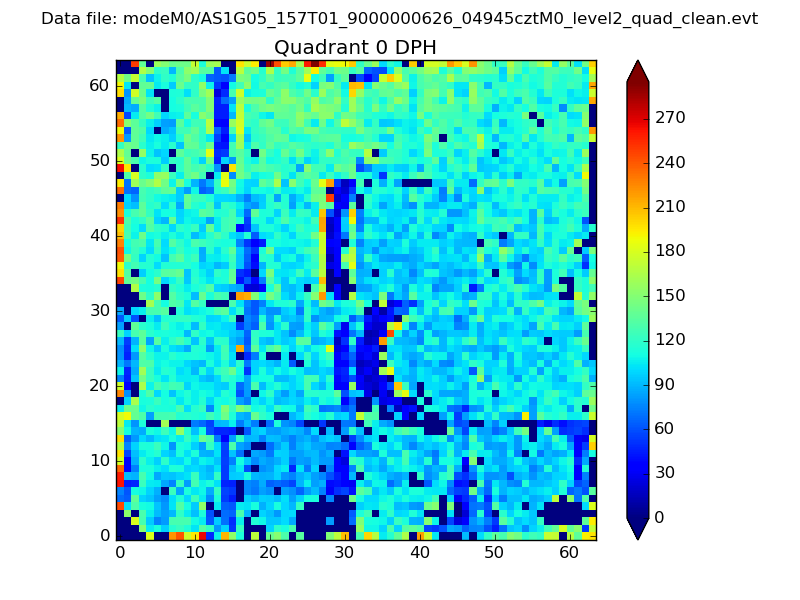 |
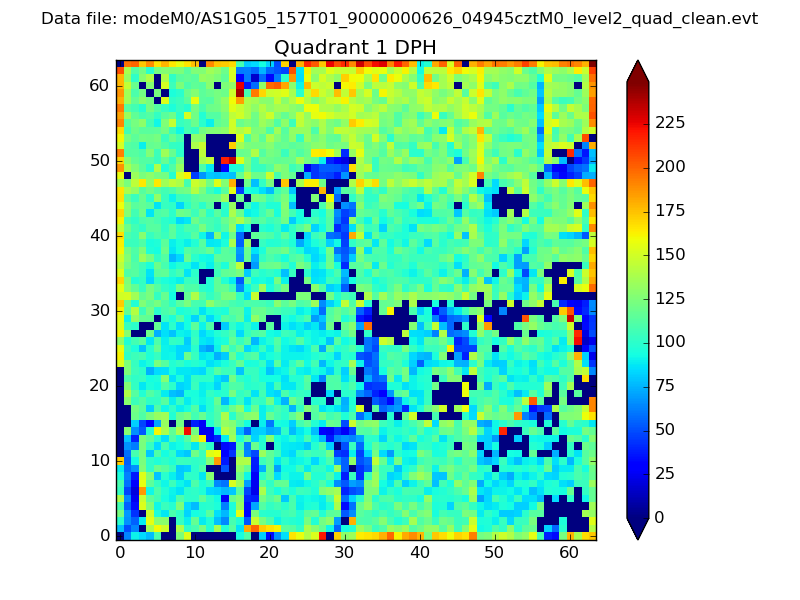 |
Quadrant B |
|---|---|---|---|
| Quadrant D | 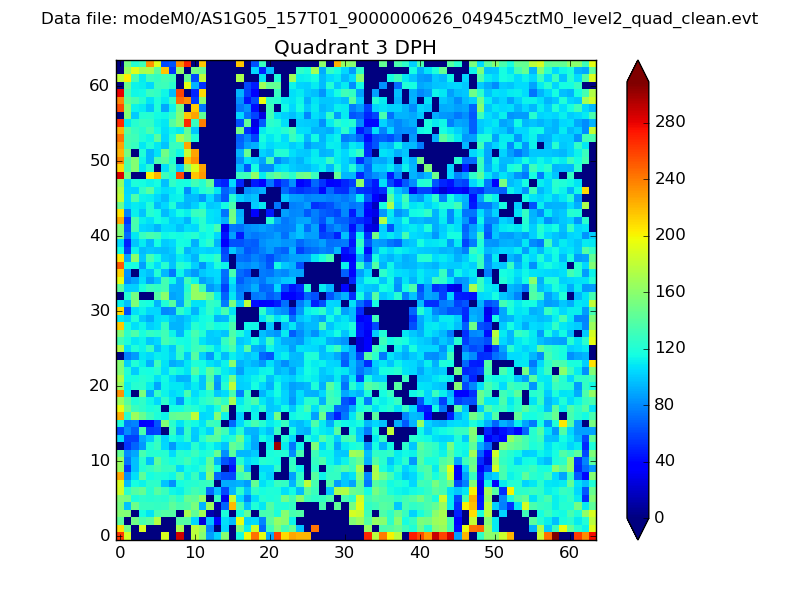 |
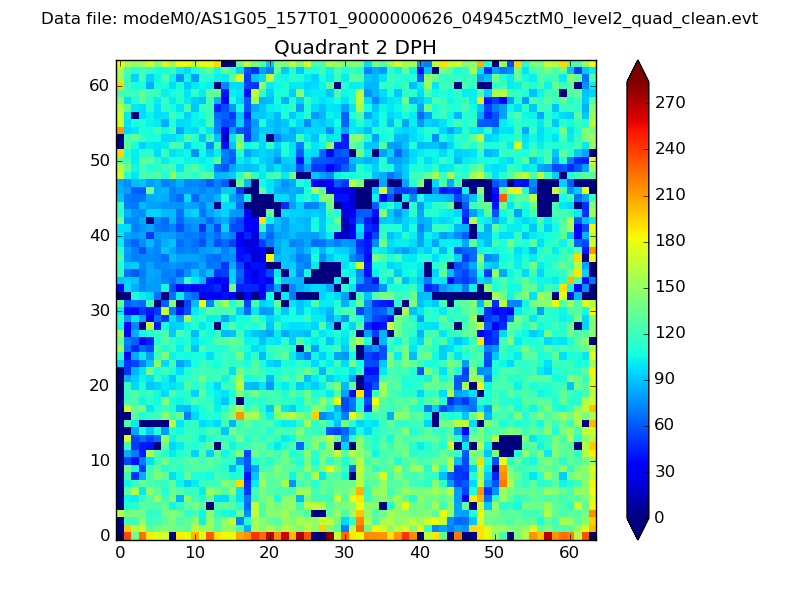 |
Quadrant C |
| Plot type | Count rate plots | Images |
|---|---|---|
| Comparison with Poisson distribution Blue bars denote a histogram of data divided into 1 sec bins. Red curve is a Poisson curve with rate = median count rate of data. |
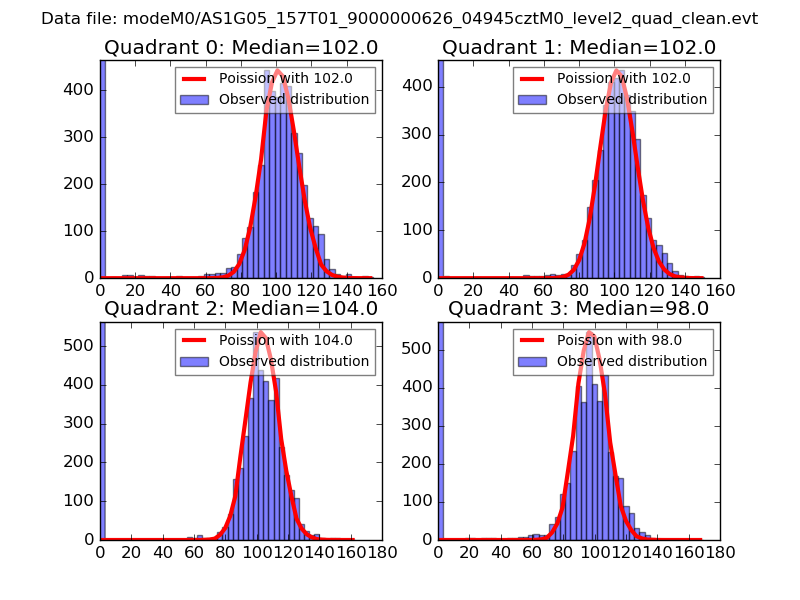 |
 |
| Quadrant-wise count rates Data is divided into 100 sec bins |
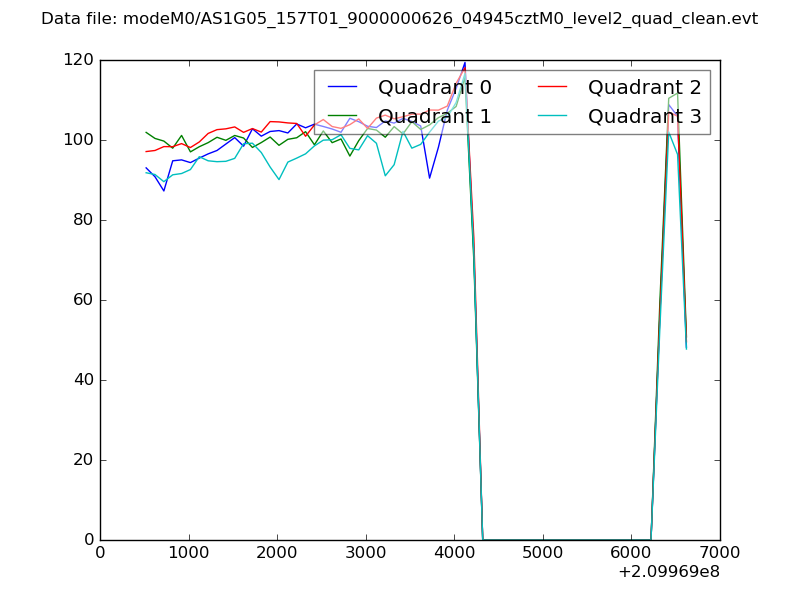 |
|
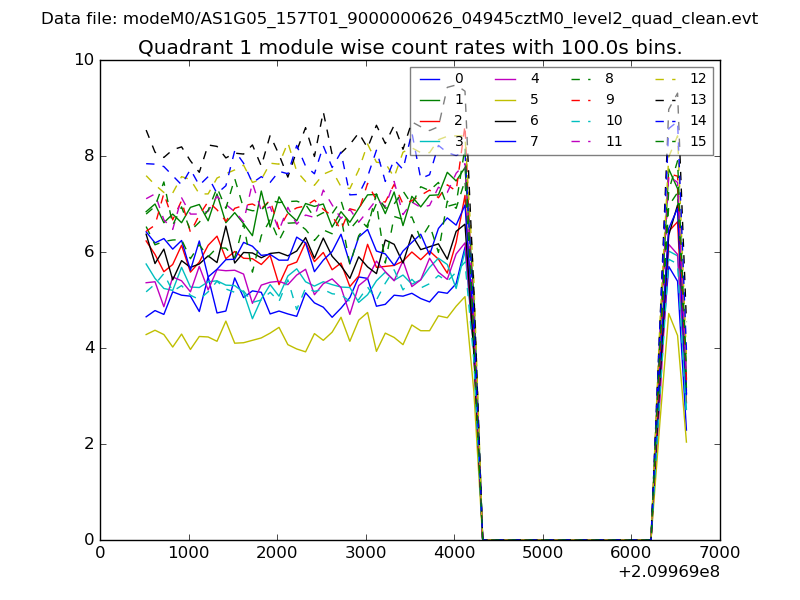
| Module-wise count rates for Quadrant A Data is divided into 100 sec bins |
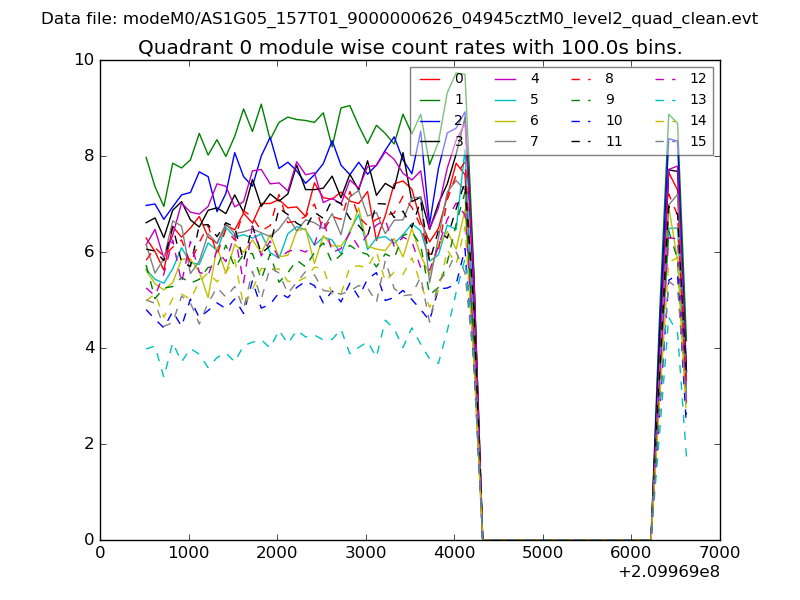 |
 |
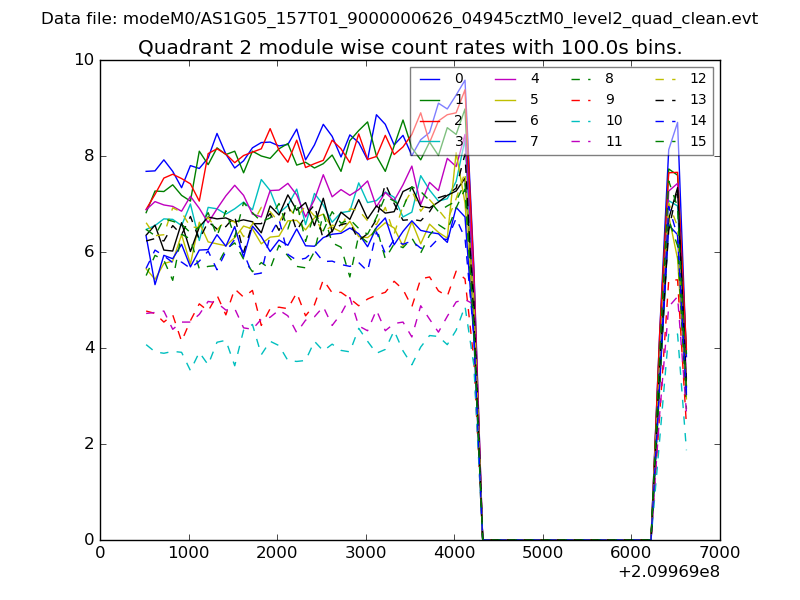
| Module-wise count rates for Quadrant B Data is divided into 100 sec bins |
 |
 |
| Module-wise count rates for Quadrant C Data is divided into 100 sec bins |
 |
 |
| Module-wise count rates for Quadrant D Data is divided into 100 sec bins |
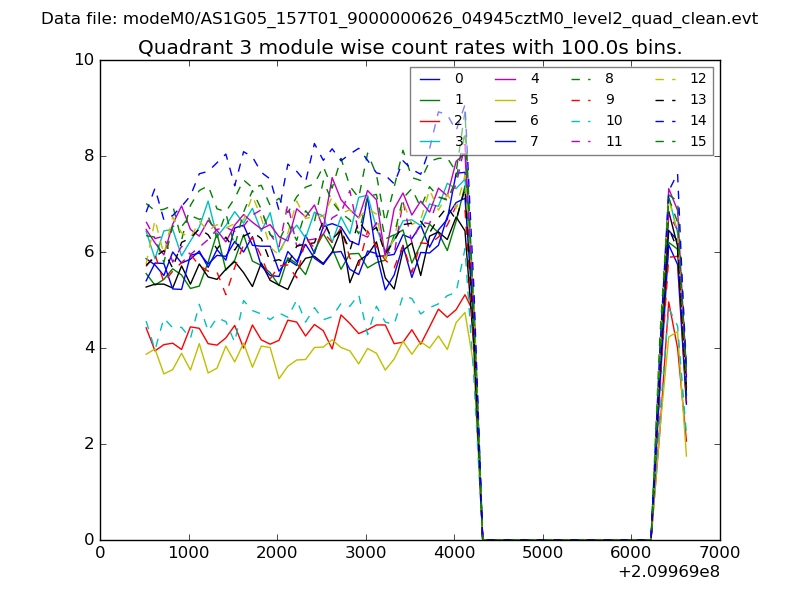 |
 |
| Parameter | Plot |
|---|---|
| CZT HV Monitor | 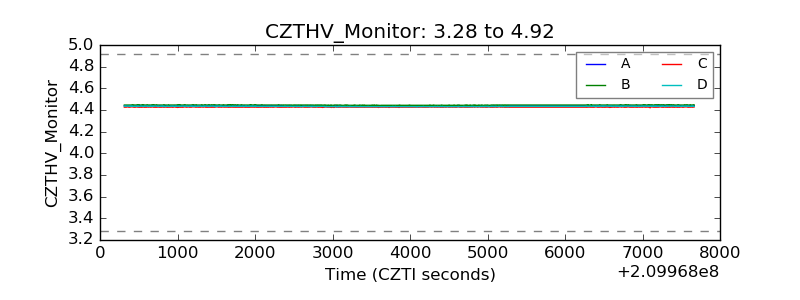 |
| D_VDD | 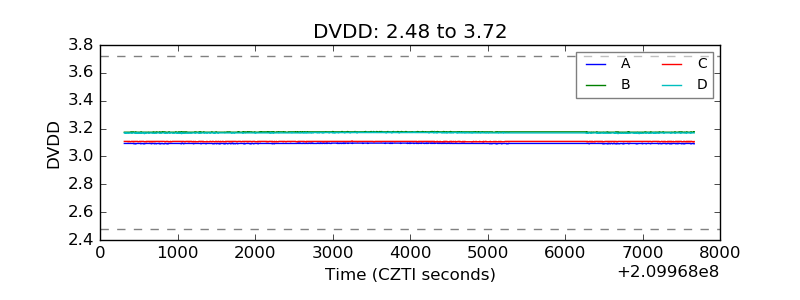 |
| Temperature 1 | 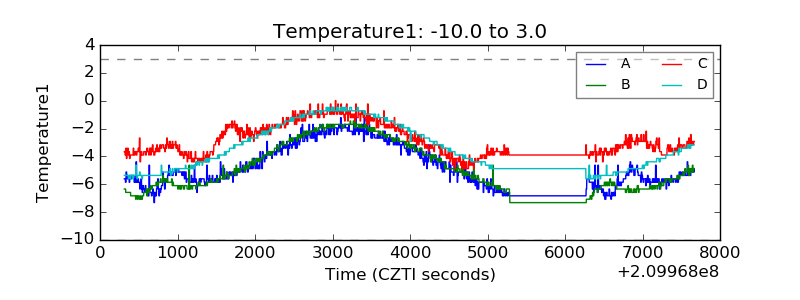 |
| Veto HV Monitor | 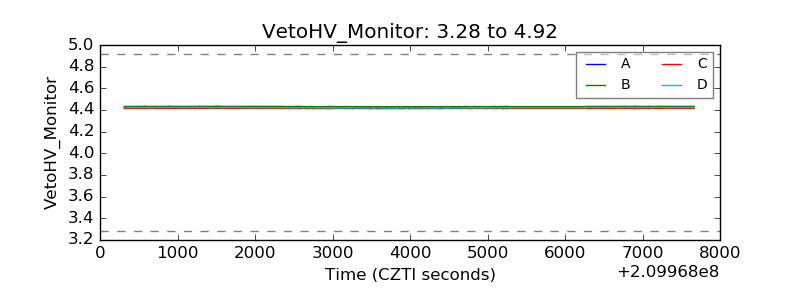 |
| Veto LLD | 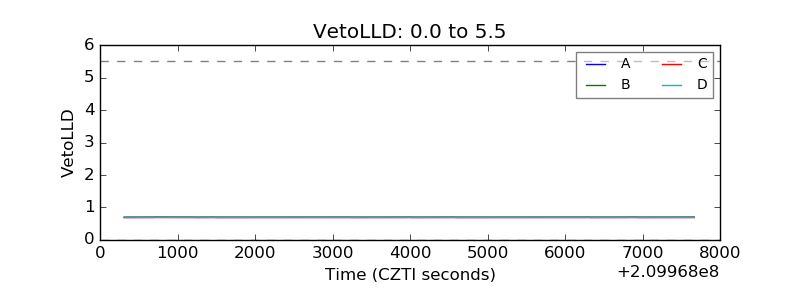 |
| Alpha Counter | 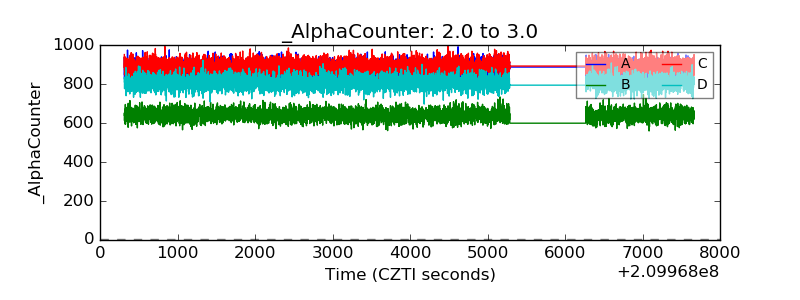 |
| _CPM_Rate | 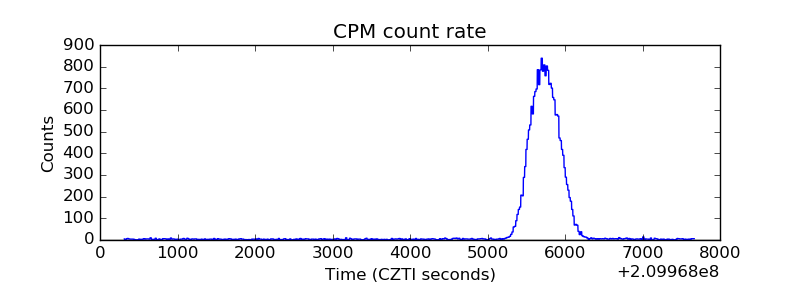 |
| CZT Counter | 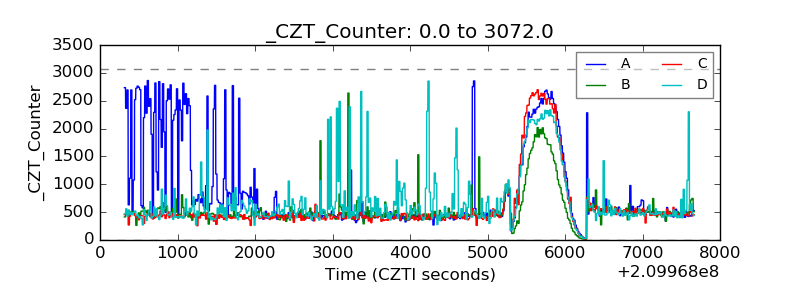 |
| +2.5 Volts monitor | 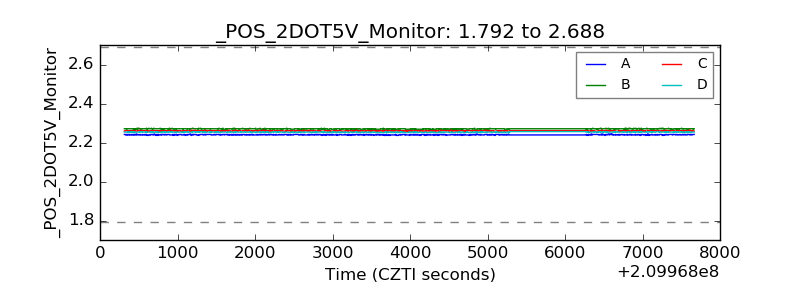 |
| +5 Volts monitor | 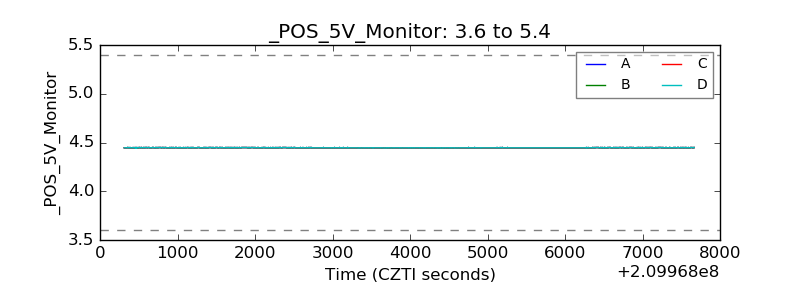 |
| _ROLL_ROT | 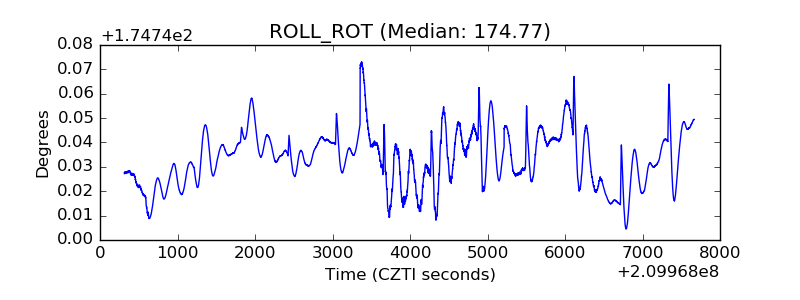 |
| _Roll_DEC | 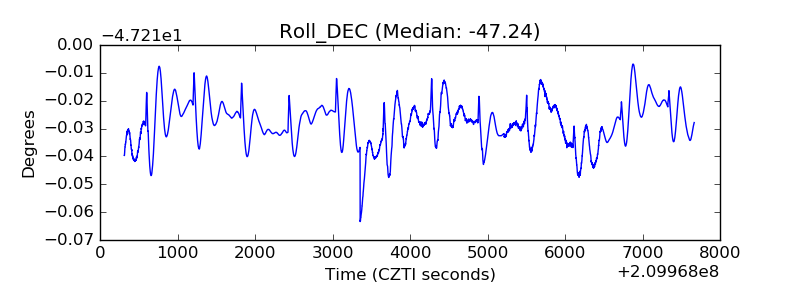 |
| _Roll_RA | 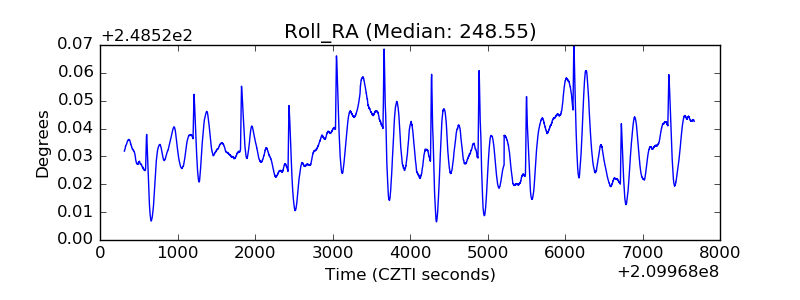 |
| Veto Counter | 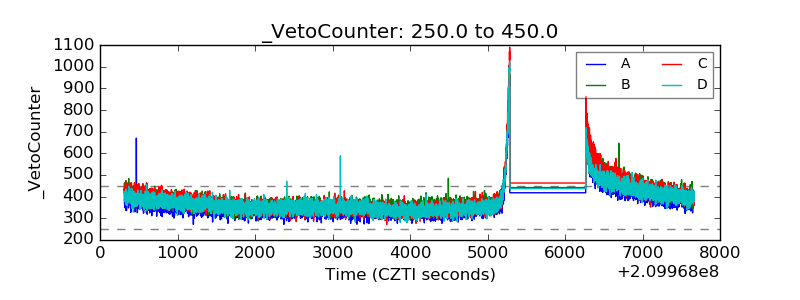 |