| Param | Original file | Final file |
|---|---|---|
| Filename | modeM0/AS1G05_157T01_9000000626_04947cztM0_level2.evt | modeM0/AS1G05_157T01_9000000626_04947cztM0_level2_quad_clean.evt |
| Size (bytes) | 475,191,360 | 81,224,640 |
| Size | 453.2 MB | 77.5 MB |
| Events in quadrant A | 3,244,409 | 507,494 |
| Events in quadrant B | 3,387,911 | 506,901 |
| Events in quadrant C | 3,051,148 | 511,796 |
| Events in quadrant D | 4,263,005 | 477,000 |
| Mode SS | |||
|---|---|---|---|
| Quadrant | BADHDUFLAG | Total packets | Discarded packets |
| A | 0 | 134 | 0 |
| B | 0 | 134 | 0 |
| C | 0 | 134 | 0 |
| D | 0 | 134 | 0 |
| Mode M0 | |||
|---|---|---|---|
| Quadrant | BADHDUFLAG | Total packets | Discarded packets |
| A | 0 | 13981 | 3 |
| B | 0 | 14280 | 2 |
| C | 0 | 13561 | 4 |
| D | 0 | 17034 | 2 |
| Mode M9 | |||
|---|---|---|---|
| Quadrant | BADHDUFLAG | Total packets | Discarded packets |
| A | 0 | 21 | 0 |
| B | 0 | 21 | 0 |
| C | 0 | 21 | 0 |
| D | 0 | 21 | 0 |
| Quadrant | Total seconds | Saturated seconds | Saturation percentage |
|---|---|---|---|
| A | 6545 | 154 | 2.352941% |
| B | 6545 | 177 | 2.704354% |
| C | 6544 | 136 | 2.078240% |
| D | 6545 | 381 | 5.821238% |
Noise dominated data is calculated using 1-second bins in cleaned event files. If a bin has >2000 counts, and if more than 50% of those come from <1% of pixels, then it is considered to be noise-dominated and hence unusable.
| Quadrant | # 1 sec bins | Bins with >0 counts | Bins with >2000 counts | High rate bins dominated by noise | Noise dominated (total time) | Noise dominated (detector-on time) | Marked lightcurve |
|---|---|---|---|---|---|---|---|
| A | 8635 | 6545 | 15 | 15 | 0.17% | 0.23% | 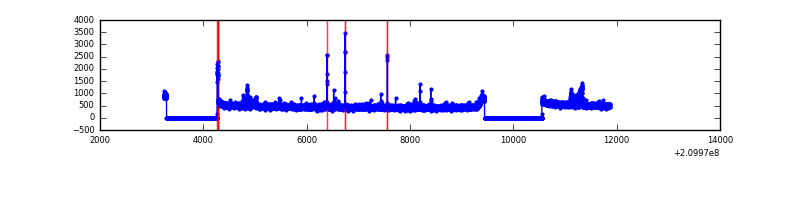 |
| B | 8635 | 6545 | 34 | 34 | 0.39% | 0.52% | 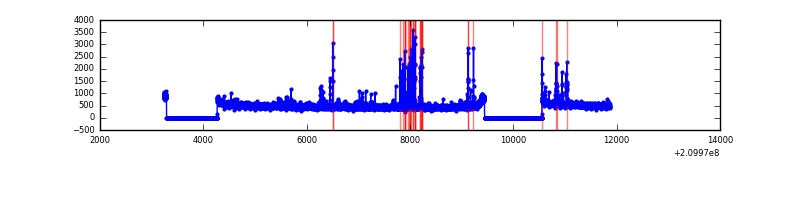 |
| C | 8635 | 6545 | 0 | 0 | 0.00% | 0.00% | 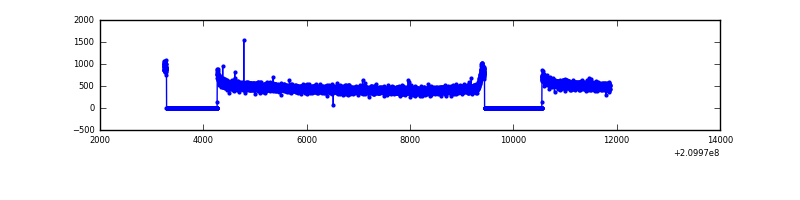 |
| D | 8635 | 6545 | 240 | 240 | 2.78% | 3.67% | 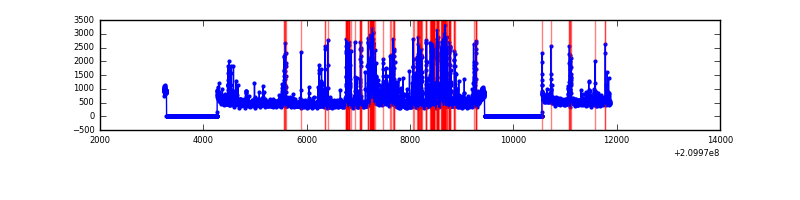 |
Top three noisy pixels from each quadrant. If the there are fewer than three noisy pixels in the level2.evt file, extra rows are filled as -1
| Pixel properties | Quadrant properties | ||||||
|---|---|---|---|---|---|---|---|
| Quadrant | DetID | PixID | Counts | Sigma | Mean | Median | Sigma |
| A | 0 | 31 | 120557 | 740.21 | 799 | 782 | 161.8 |
| A | 0 | 50 | 31012 | 186.82 | 799 | 782 | 161.8 |
| A | 13 | 251 | 11742 | 67.73 | 799 | 782 | 161.8 |
| B | 10 | 16 | 171105 | 1114.65 | 805 | 787 | 152.8 |
| B | 15 | 204 | 38198 | 244.84 | 805 | 787 | 152.8 |
| B | 4 | 48 | 23448 | 148.31 | 805 | 787 | 152.8 |
| C | 13 | 61 | 6313 | 30.64 | 780 | 782 | 180.5 |
| C | 1 | 16 | 4829 | 22.42 | 780 | 782 | 180.5 |
| C | 3 | 202 | 2014 | 6.82 | 780 | 782 | 180.5 |
| D | 2 | 33 | 690804 | 3679.17 | 768 | 746 | 187.6 |
| D | 2 | 234 | 253633 | 1348.31 | 768 | 746 | 187.6 |
| D | 7 | 67 | 127466 | 675.63 | 768 | 746 | 187.6 |
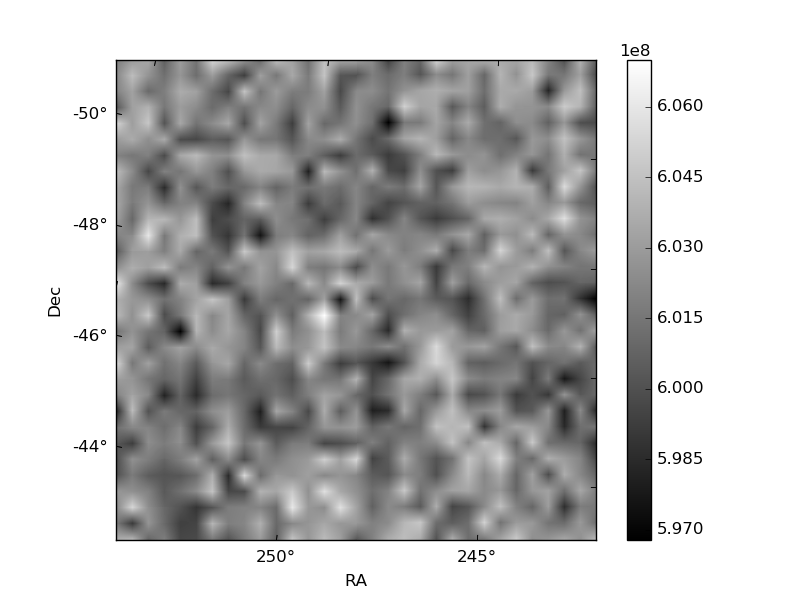
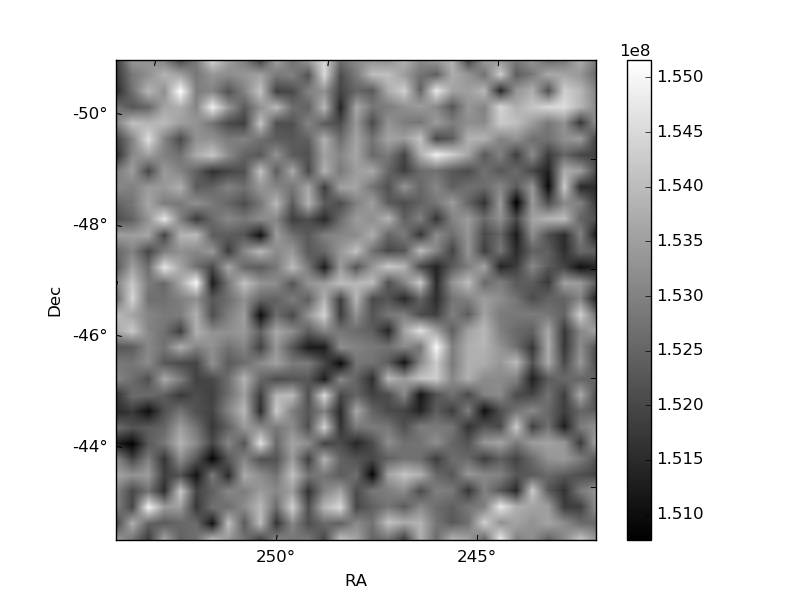
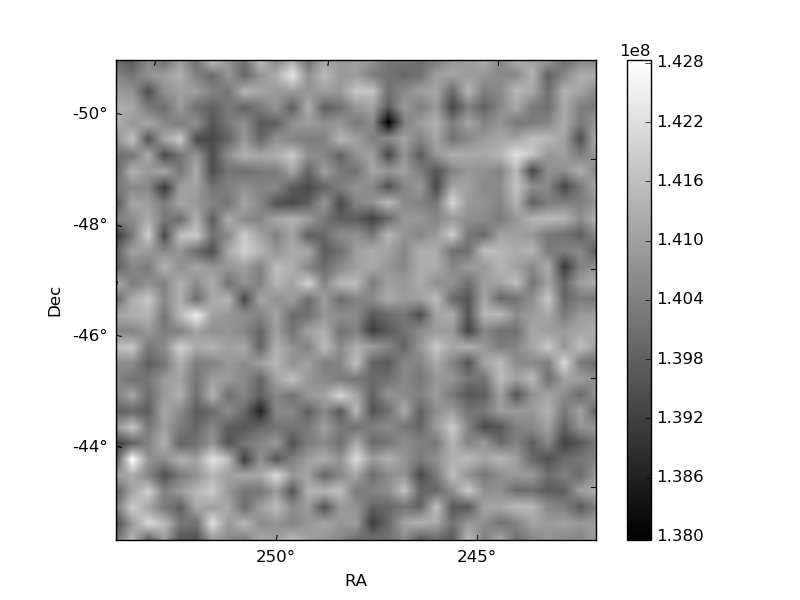
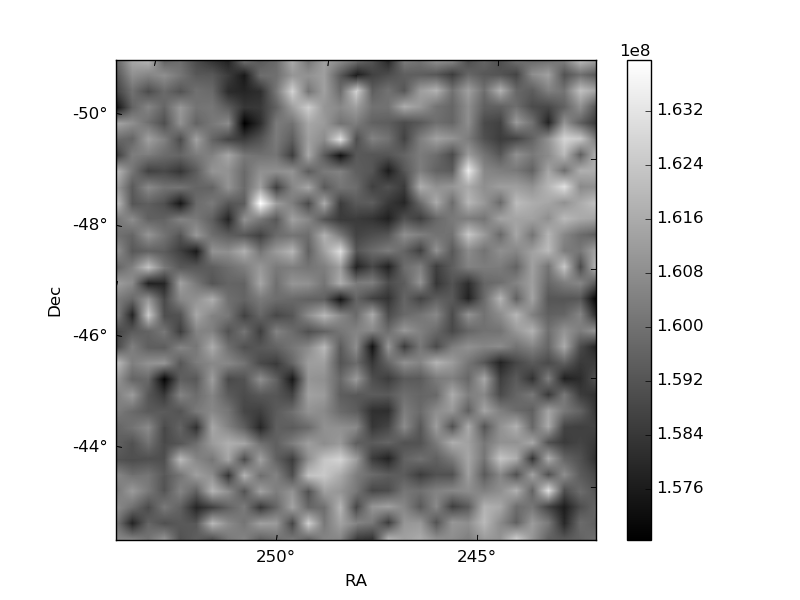
Histogram calculated using DETX and DETY for each event in the final _common_clean file
| Quadrant A | 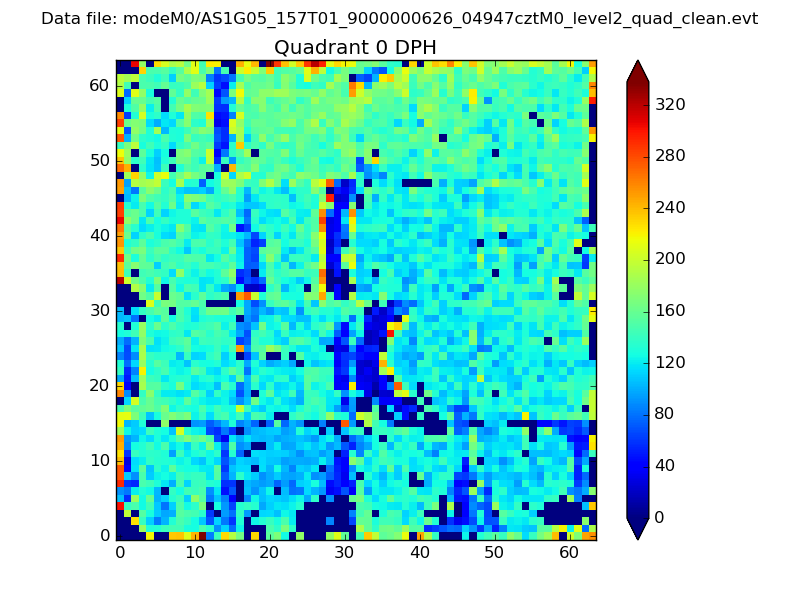 |
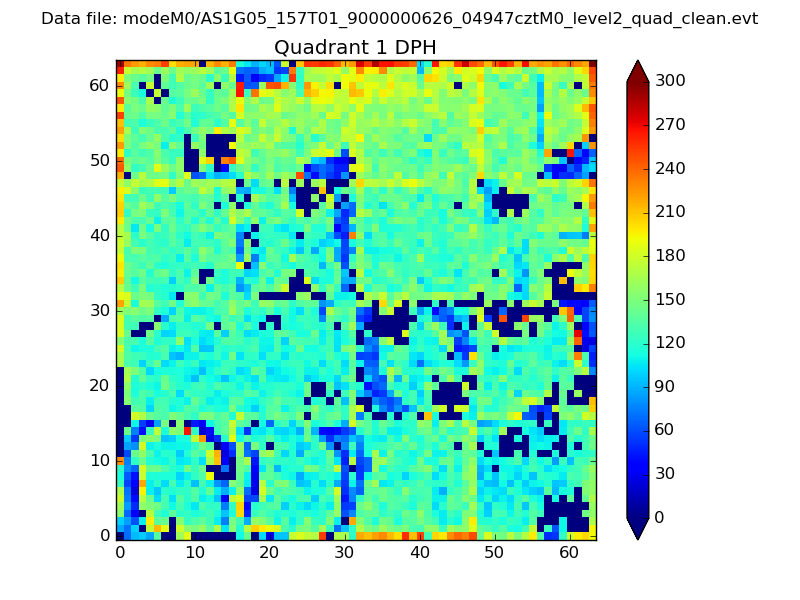 |
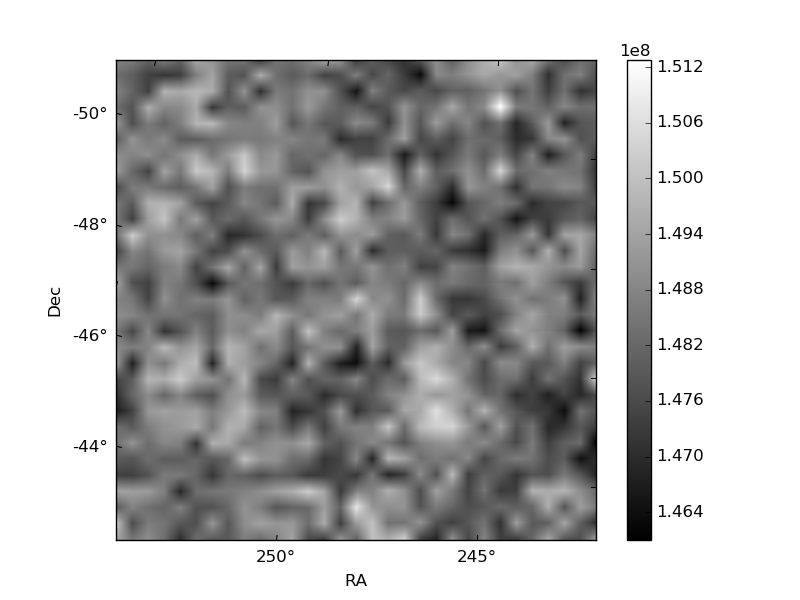
Quadrant B |
|---|---|---|---|
| Quadrant D | 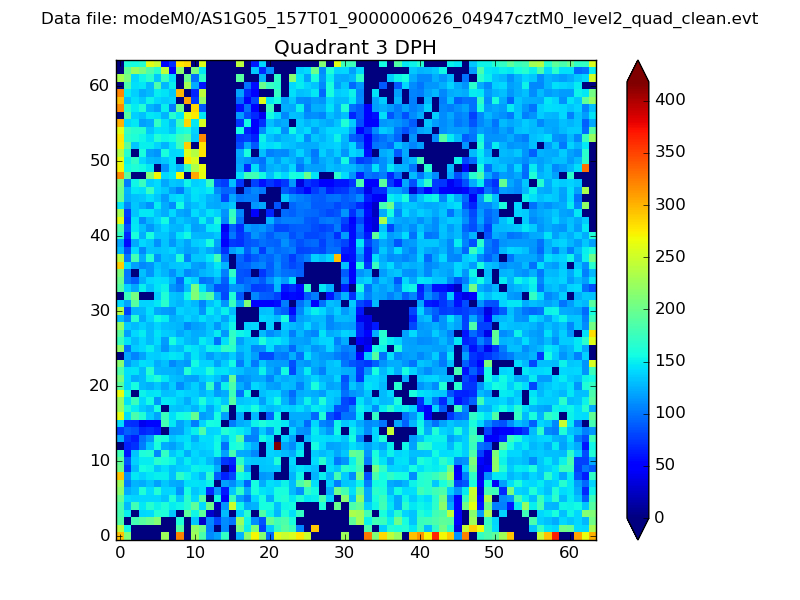 |
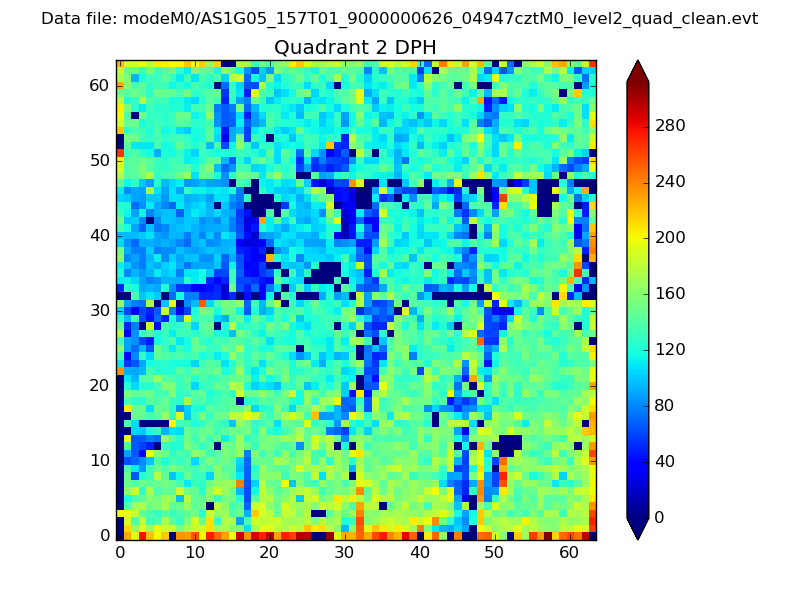 |
Quadrant C |
| Plot type | Count rate plots | Images |
|---|---|---|
| Comparison with Poisson distribution Blue bars denote a histogram of data divided into 1 sec bins. Red curve is a Poisson curve with rate = median count rate of data. |
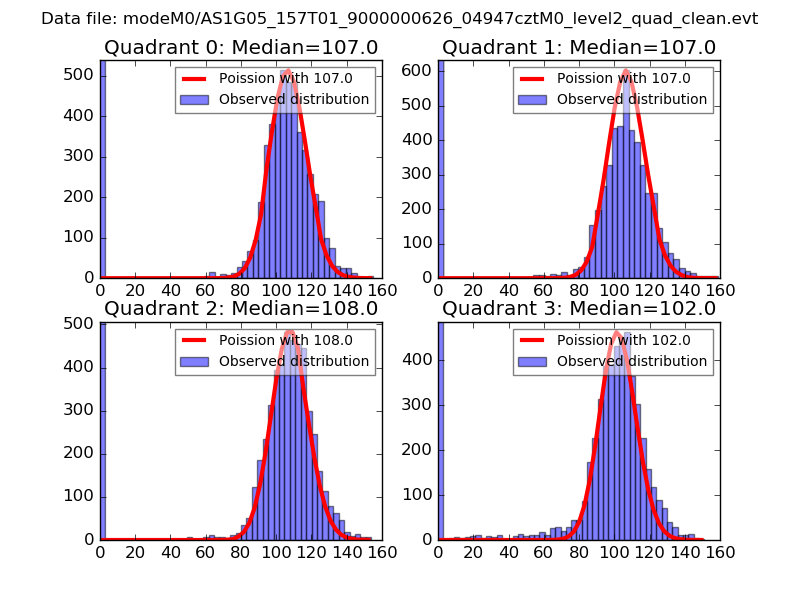 |
 |
| Quadrant-wise count rates Data is divided into 100 sec bins |
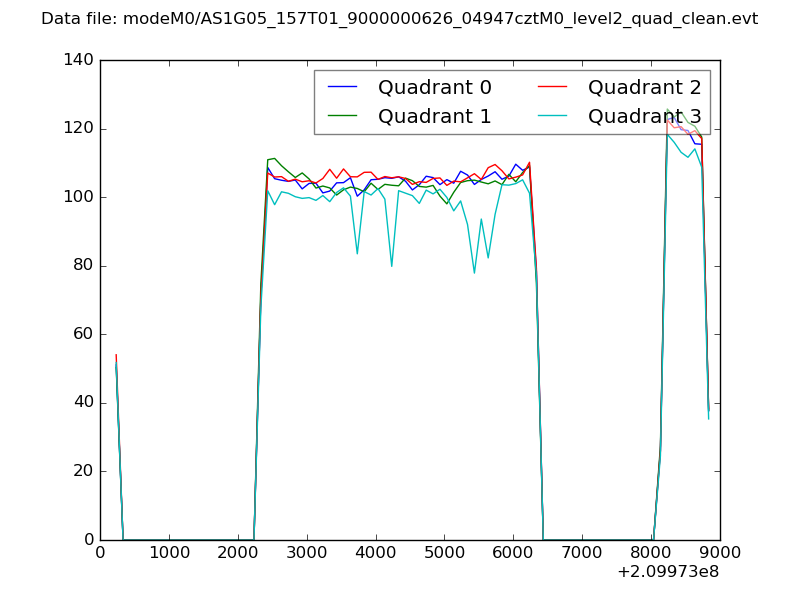 |
|
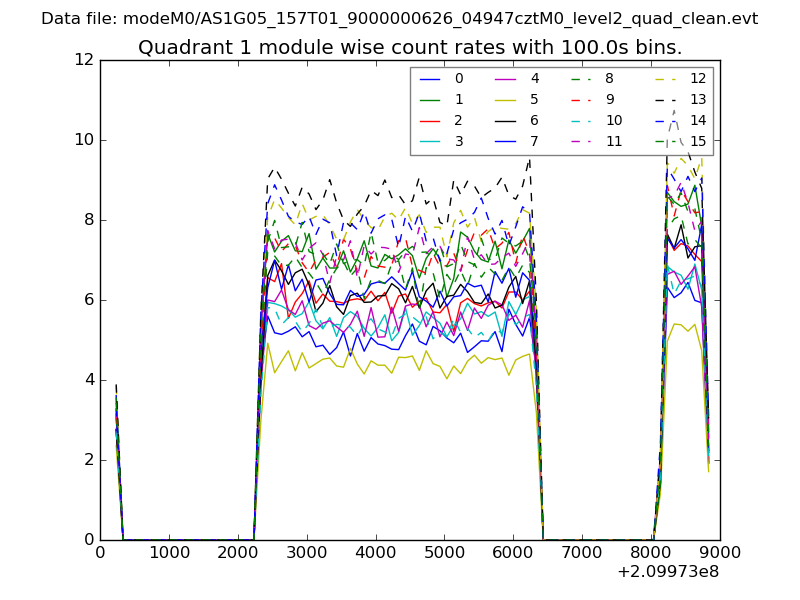
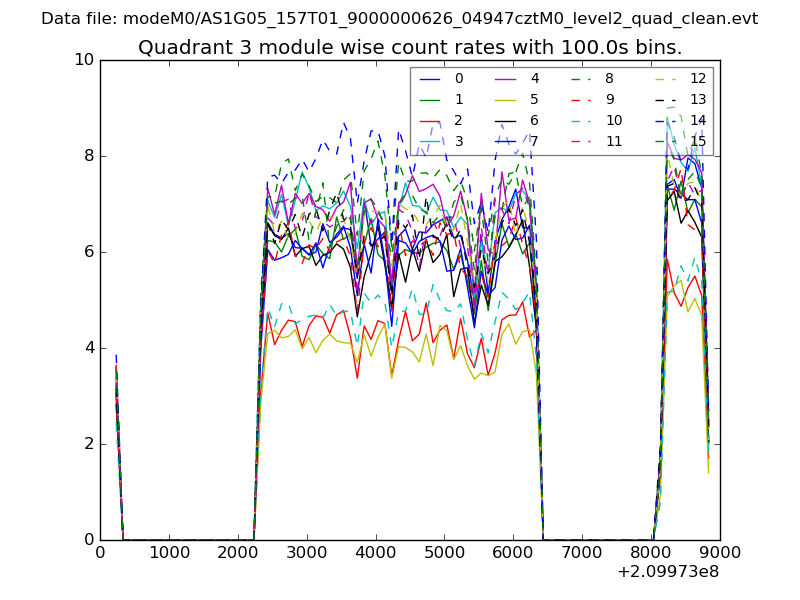
| Module-wise count rates for Quadrant A Data is divided into 100 sec bins |
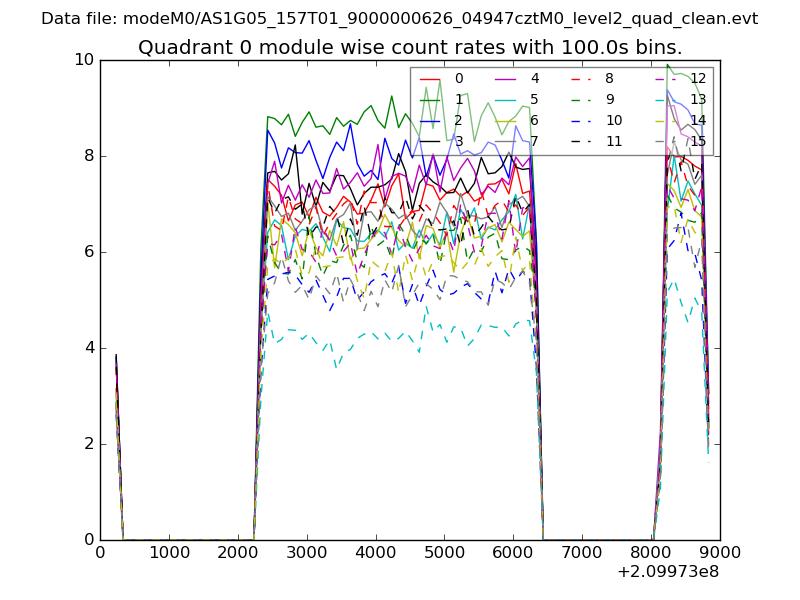 |
 |
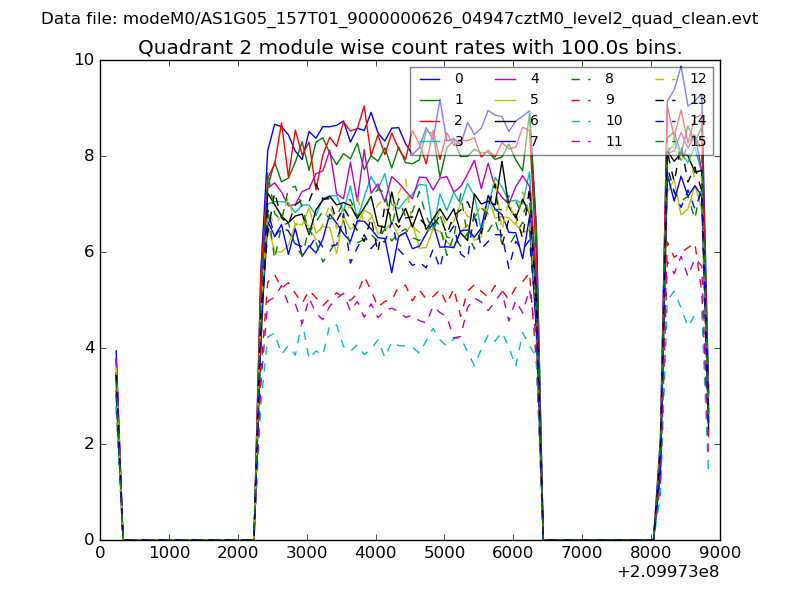
| Module-wise count rates for Quadrant B Data is divided into 100 sec bins |
 |
 |
| Module-wise count rates for Quadrant C Data is divided into 100 sec bins |
 |
 |
| Module-wise count rates for Quadrant D Data is divided into 100 sec bins |
 |
 |
| Parameter | Plot |
|---|---|
| CZT HV Monitor | 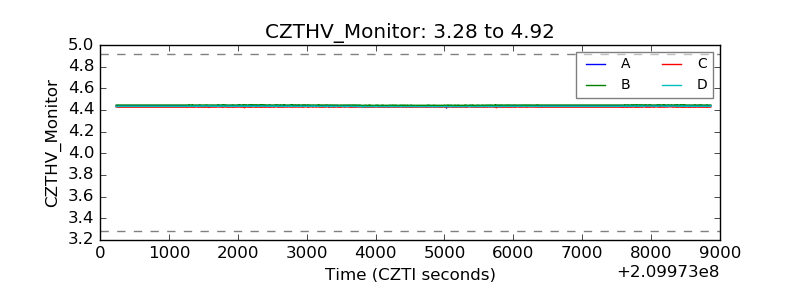 |
| D_VDD | 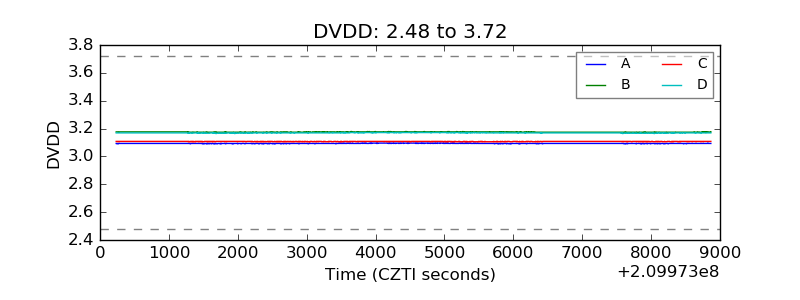 |
| Temperature 1 | 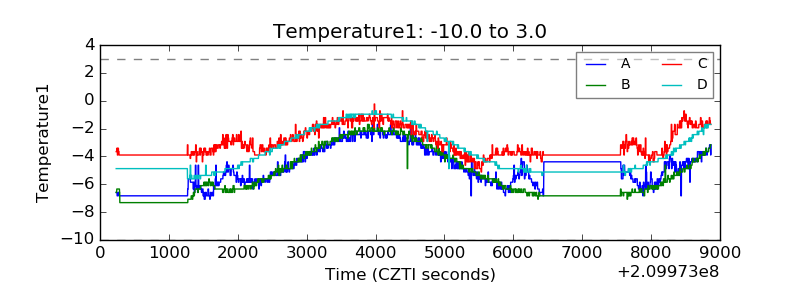 |
| Veto HV Monitor | 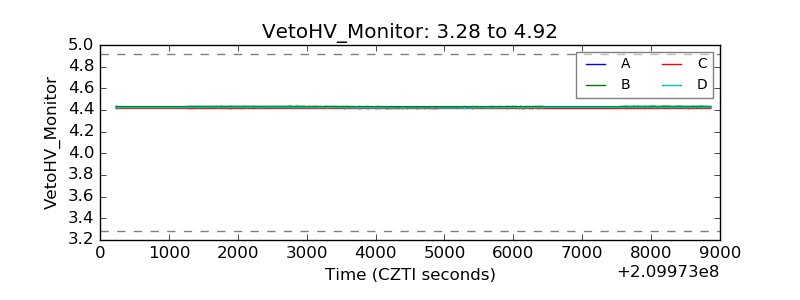 |
| Veto LLD | 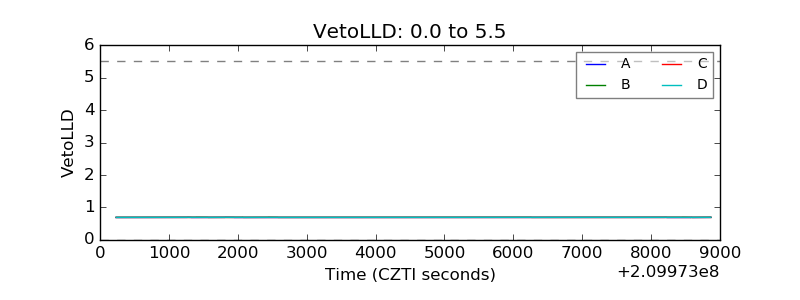 |
| Alpha Counter | 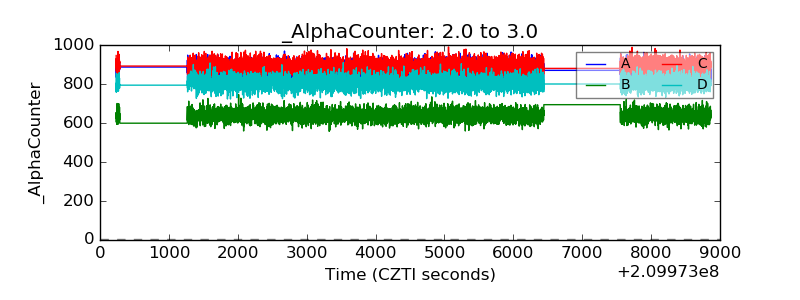 |
| _CPM_Rate | 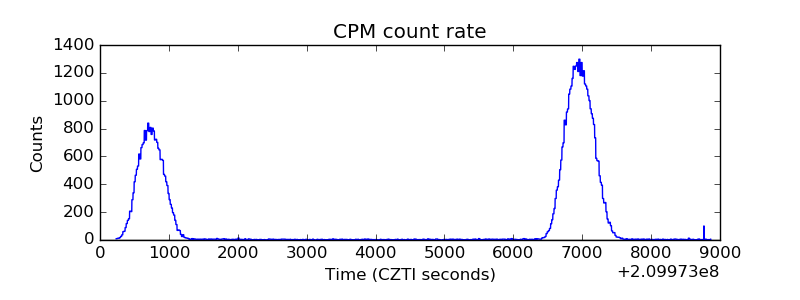 |
| CZT Counter | 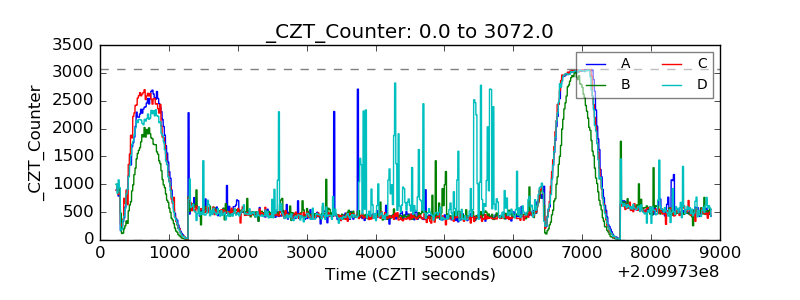 |
| +2.5 Volts monitor |  |
| +5 Volts monitor |  |
| _ROLL_ROT | 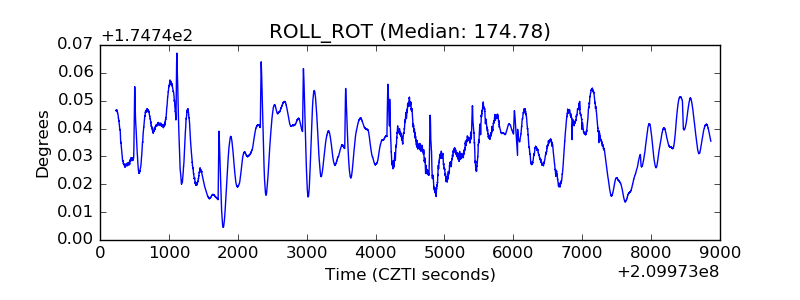 |
| _Roll_DEC | 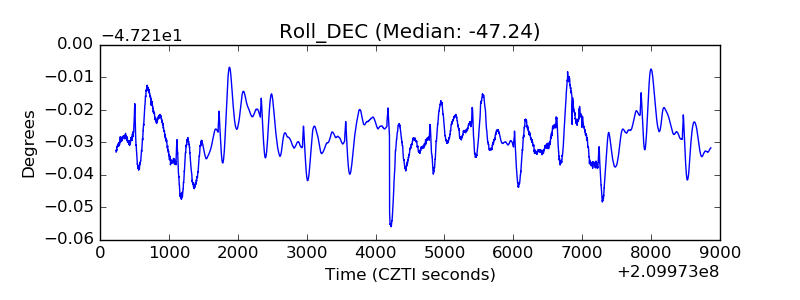 |
| _Roll_RA | 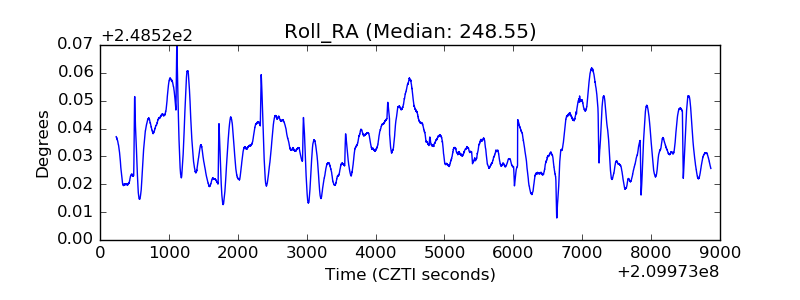 |
| Veto Counter | 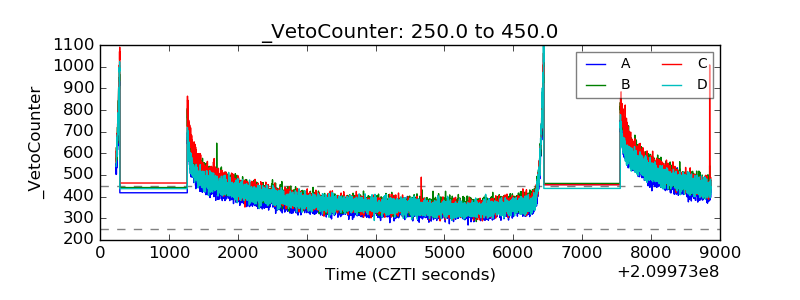 |