| Param | Original file | Final file |
|---|---|---|
| Filename | modeM0/AS1G05_157T01_9000000626_04948cztM0_level2.evt | modeM0/AS1G05_157T01_9000000626_04948cztM0_level2_quad_clean.evt |
| Size (bytes) | 472,458,240 | 91,523,520 |
| Size | 450.6 MB | 87.3 MB |
| Events in quadrant A | 3,310,923 | 590,161 |
| Events in quadrant B | 3,300,640 | 592,984 |
| Events in quadrant C | 3,040,158 | 591,107 |
| Events in quadrant D | 4,223,467 | 552,197 |
| Mode SS | |||
|---|---|---|---|
| Quadrant | BADHDUFLAG | Total packets | Discarded packets |
| A | 0 | 130 | 0 |
| B | 0 | 130 | 0 |
| C | 0 | 130 | 0 |
| D | 0 | 130 | 0 |
| Mode M0 | |||
|---|---|---|---|
| Quadrant | BADHDUFLAG | Total packets | Discarded packets |
| A | 0 | 14022 | 3 |
| B | 0 | 13908 | 2 |
| C | 0 | 13329 | 2 |
| D | 0 | 16765 | 2 |
| Mode M9 | |||
|---|---|---|---|
| Quadrant | BADHDUFLAG | Total packets | Discarded packets |
| A | 0 | 16 | 0 |
| B | 0 | 16 | 0 |
| C | 0 | 16 | 0 |
| D | 0 | 17 | 0 |
| Quadrant | Total seconds | Saturated seconds | Saturation percentage |
|---|---|---|---|
| A | 6377 | 89 | 1.395641% |
| B | 6377 | 67 | 1.050651% |
| C | 6377 | 47 | 0.737024% |
| D | 6377 | 304 | 4.767132% |
Noise dominated data is calculated using 1-second bins in cleaned event files. If a bin has >2000 counts, and if more than 50% of those come from <1% of pixels, then it is considered to be noise-dominated and hence unusable.
| Quadrant | # 1 sec bins | Bins with >0 counts | Bins with >2000 counts | High rate bins dominated by noise | Noise dominated (total time) | Noise dominated (detector-on time) | Marked lightcurve |
|---|---|---|---|---|---|---|---|
| A | 7597 | 6377 | 14 | 14 | 0.18% | 0.22% | 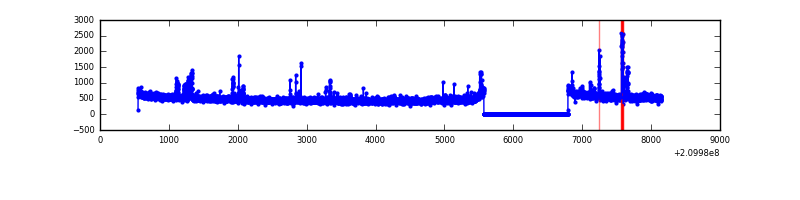 |
| B | 7597 | 6377 | 4 | 4 | 0.05% | 0.06% | 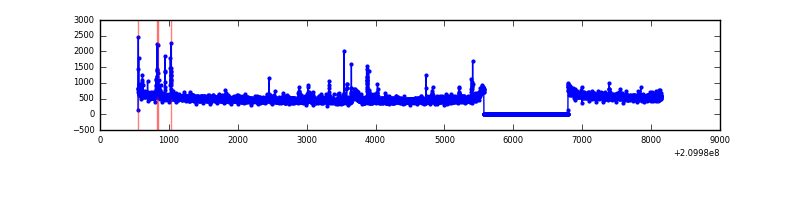 |
| C | 7597 | 6377 | 0 | 0 | 0.00% | 0.00% | 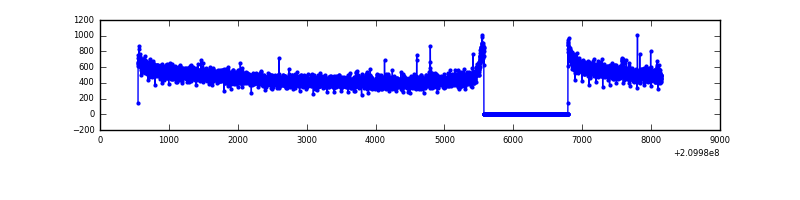 |
| D | 7597 | 6377 | 204 | 204 | 2.69% | 3.20% | 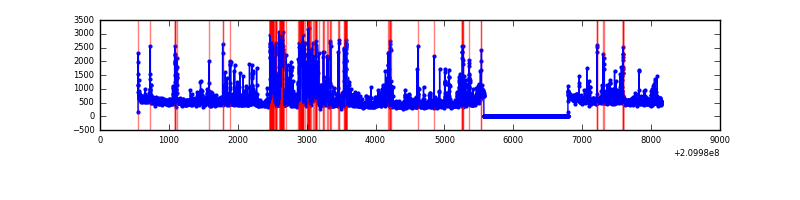 |
Top three noisy pixels from each quadrant. If the there are fewer than three noisy pixels in the level2.evt file, extra rows are filled as -1
| Pixel properties | Quadrant properties | ||||||
|---|---|---|---|---|---|---|---|
| Quadrant | DetID | PixID | Counts | Sigma | Mean | Median | Sigma |
| A | 0 | 31 | 92009 | 565.24 | 803 | 787 | 161.4 |
| A | 0 | 50 | 79962 | 490.59 | 803 | 787 | 161.4 |
| A | 8 | 15 | 39393 | 239.21 | 803 | 787 | 161.4 |
| B | 10 | 16 | 87287 | 575.01 | 804 | 787 | 150.4 |
| B | 15 | 204 | 46082 | 301.1 | 804 | 787 | 150.4 |
| B | 15 | 54 | 16289 | 103.05 | 804 | 787 | 150.4 |
| C | 13 | 61 | 6361 | 31.49 | 776 | 781 | 177.2 |
| C | 14 | 67 | 6207 | 30.62 | 776 | 781 | 177.2 |
| C | 1 | 16 | 4003 | 18.18 | 776 | 781 | 177.2 |
| D | 2 | 33 | 723350 | 3886.54 | 767 | 745 | 185.9 |
| D | 7 | 67 | 184629 | 989.02 | 767 | 745 | 185.9 |
| D | 2 | 234 | 86213 | 459.69 | 767 | 745 | 185.9 |
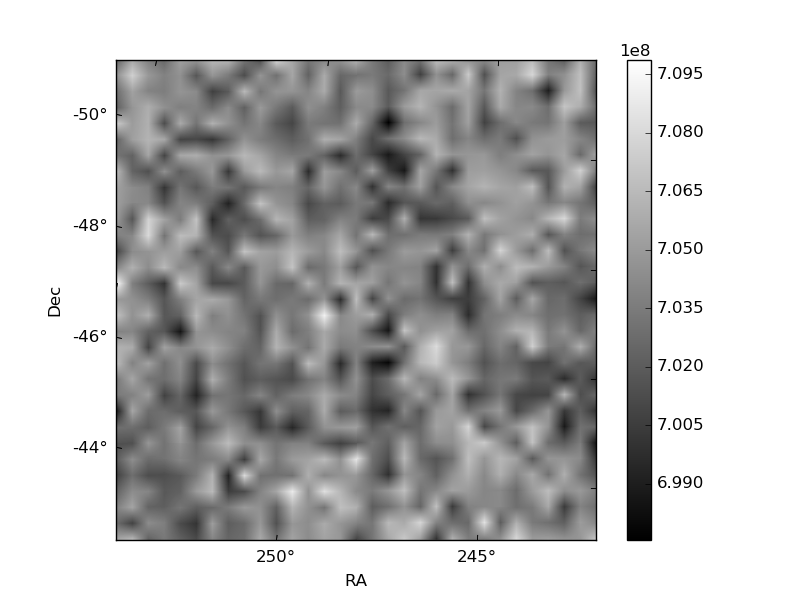
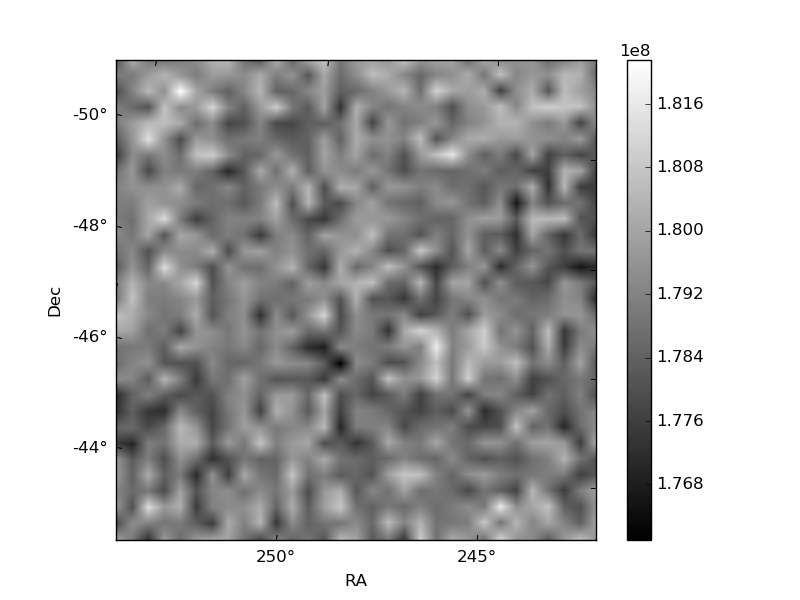
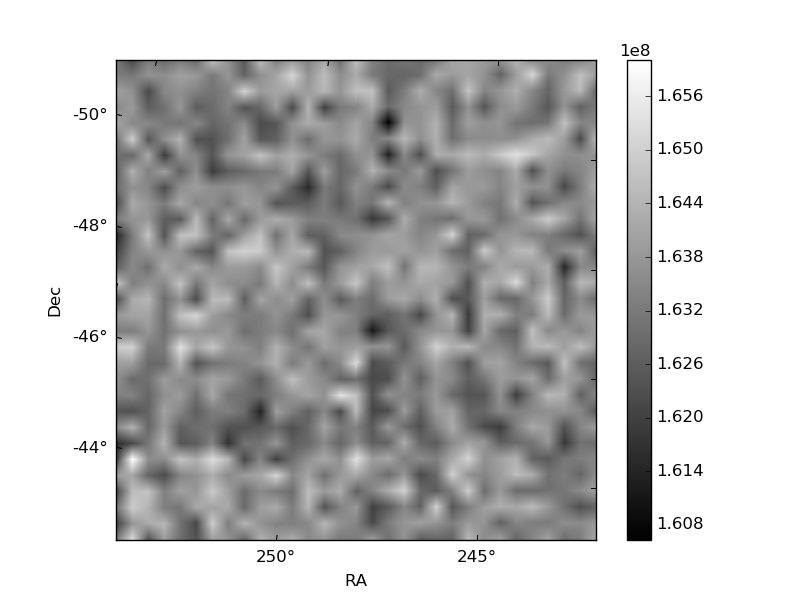
Histogram calculated using DETX and DETY for each event in the final _common_clean file
| Quadrant A | 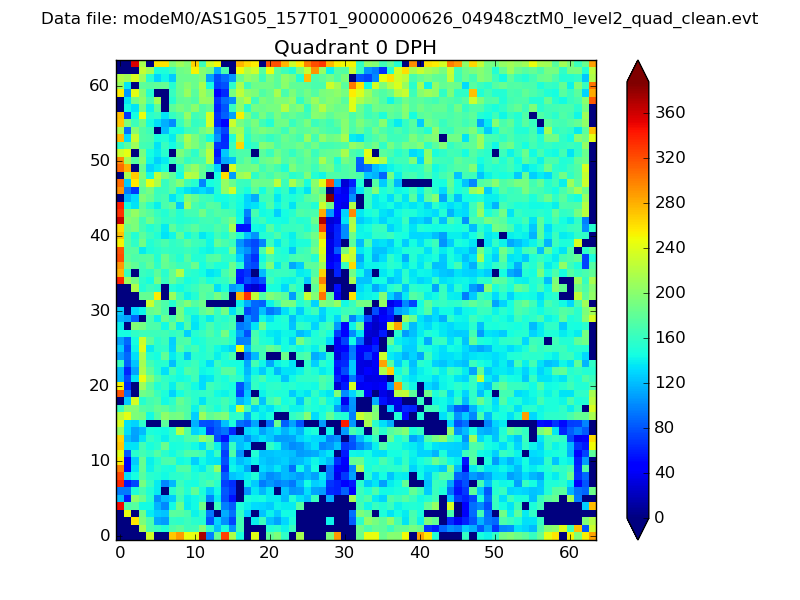 |
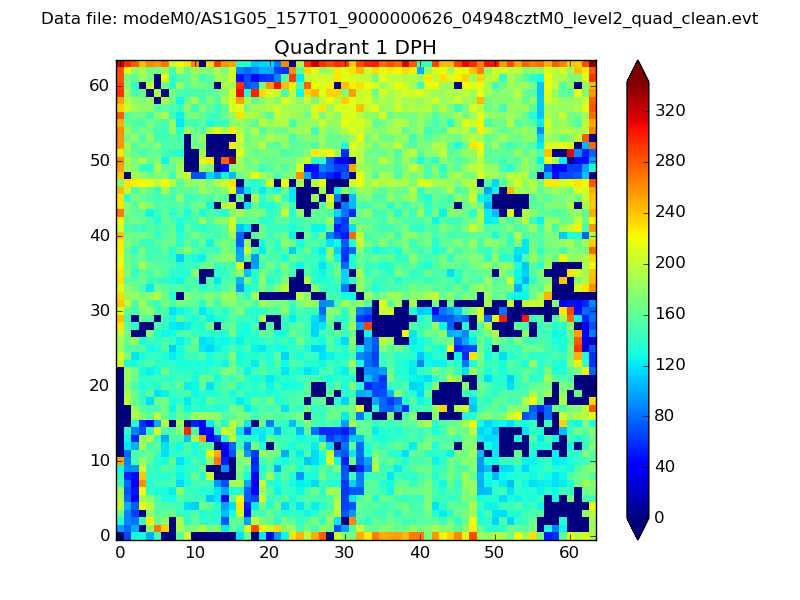 |
Quadrant B |
|---|---|---|---|
| Quadrant D | 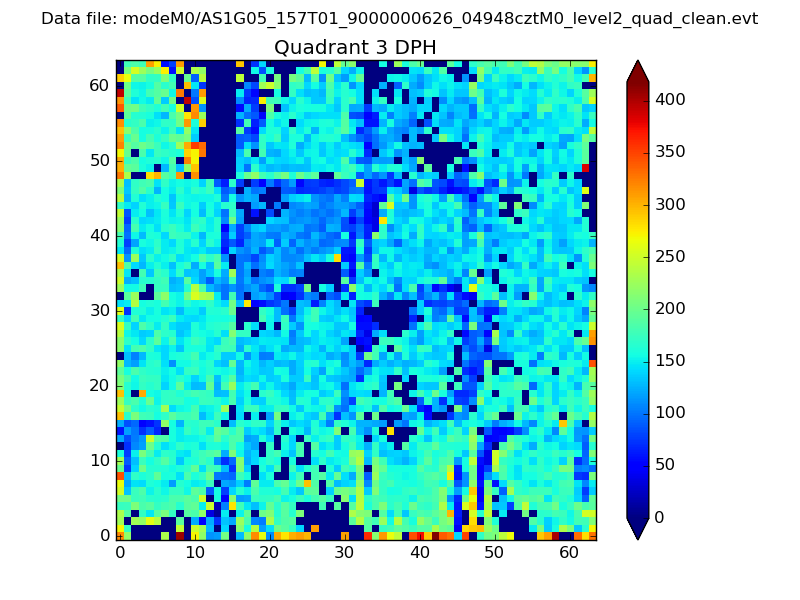 |
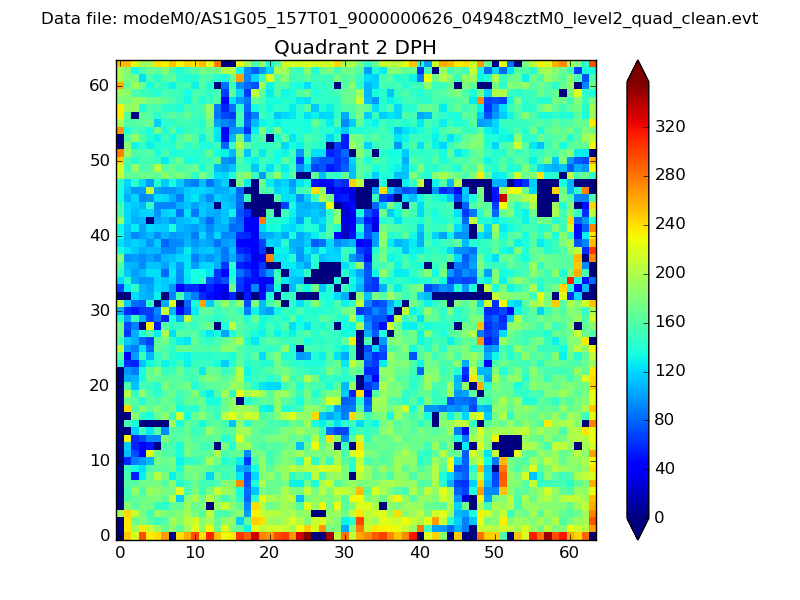 |
Quadrant C |
| Plot type | Count rate plots | Images |
|---|---|---|
| Comparison with Poisson distribution Blue bars denote a histogram of data divided into 1 sec bins. Red curve is a Poisson curve with rate = median count rate of data. |
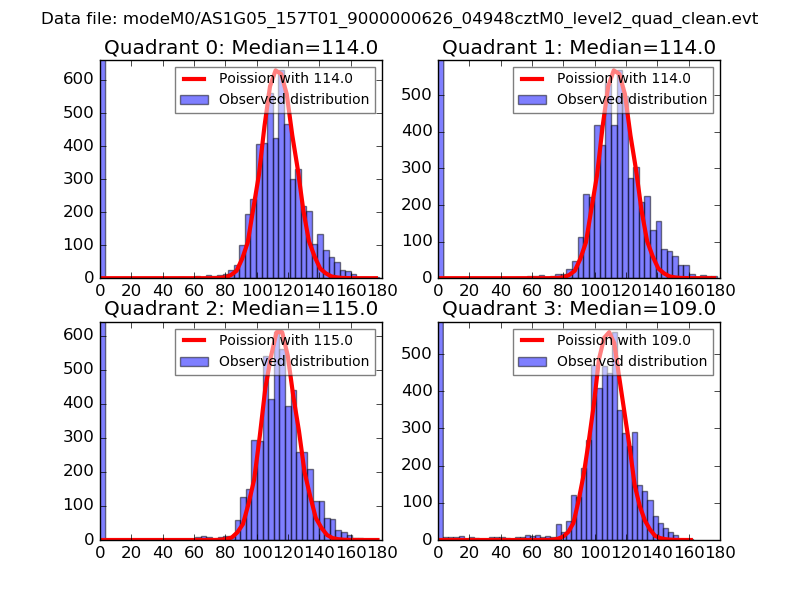 |
 |
| Quadrant-wise count rates Data is divided into 100 sec bins |
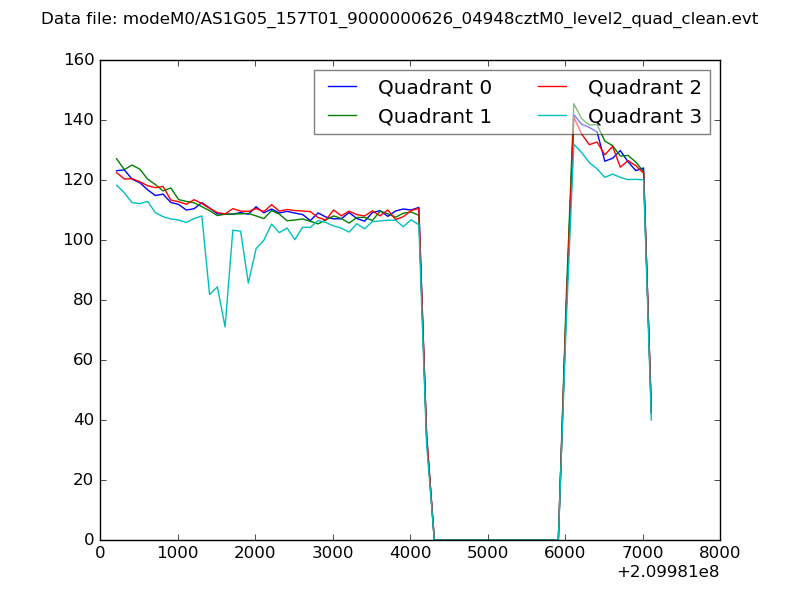 |
|
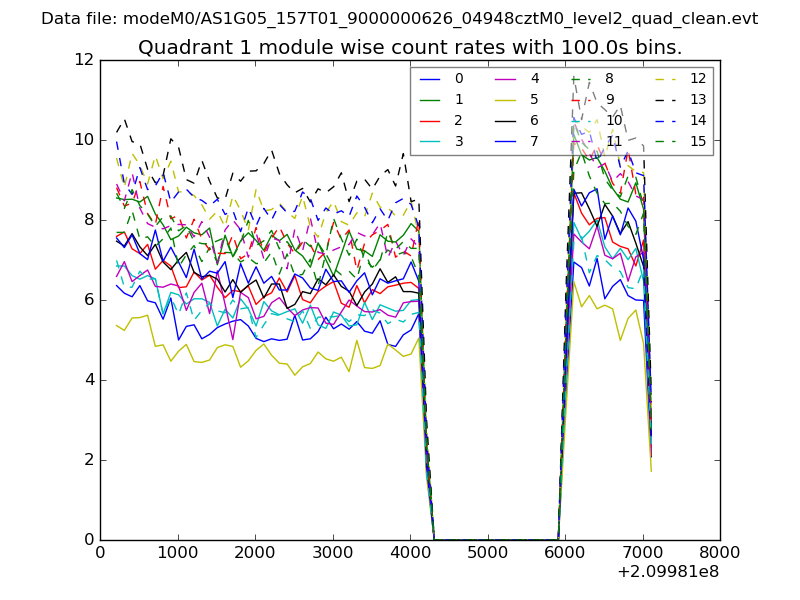
| Module-wise count rates for Quadrant A Data is divided into 100 sec bins |
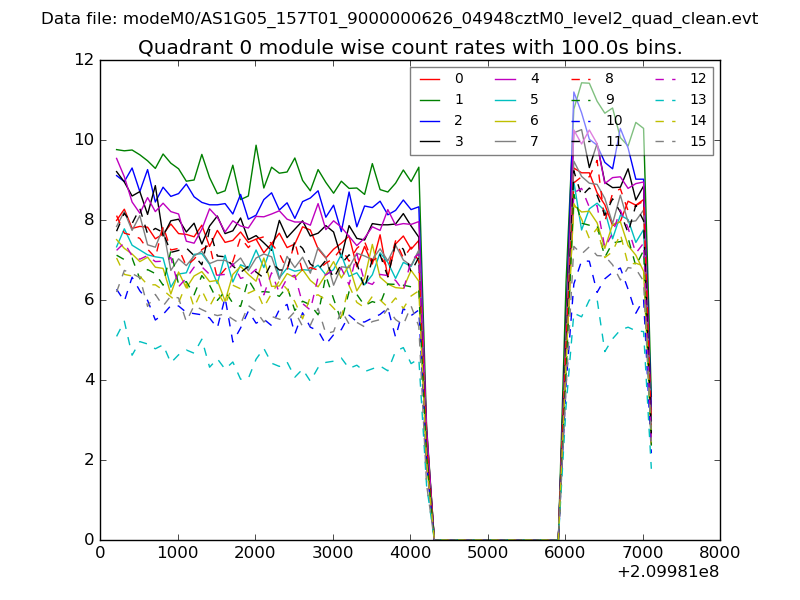 |
 |
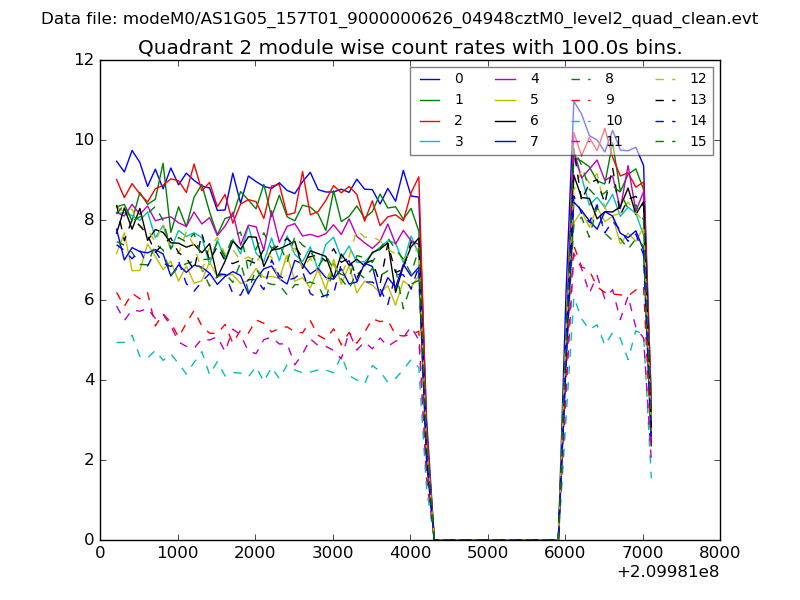
| Module-wise count rates for Quadrant B Data is divided into 100 sec bins |
 |
 |
| Module-wise count rates for Quadrant C Data is divided into 100 sec bins |
 |
 |
| Module-wise count rates for Quadrant D Data is divided into 100 sec bins |
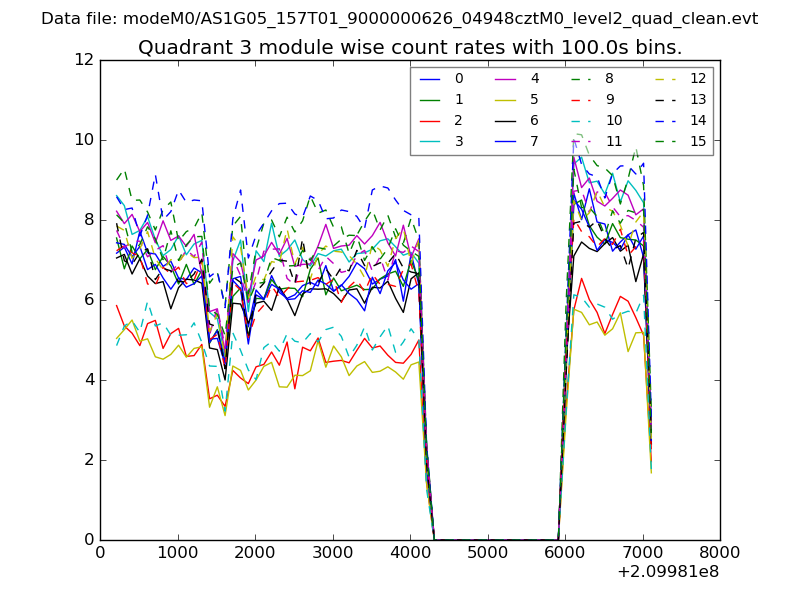 |
 |
| Parameter | Plot |
|---|---|
| CZT HV Monitor | 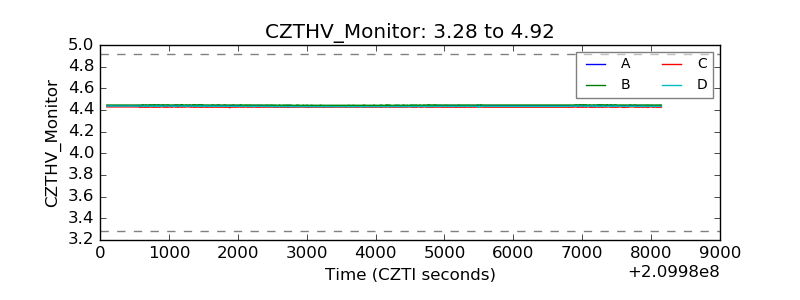 |
| D_VDD | 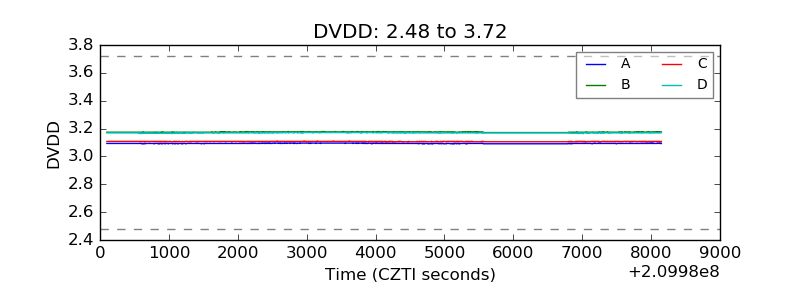 |
| Temperature 1 | 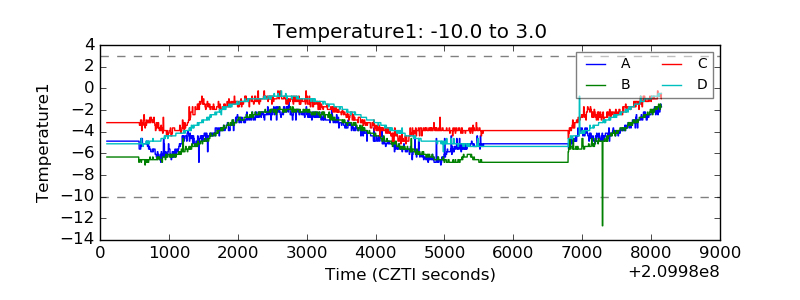 |
| Veto HV Monitor | 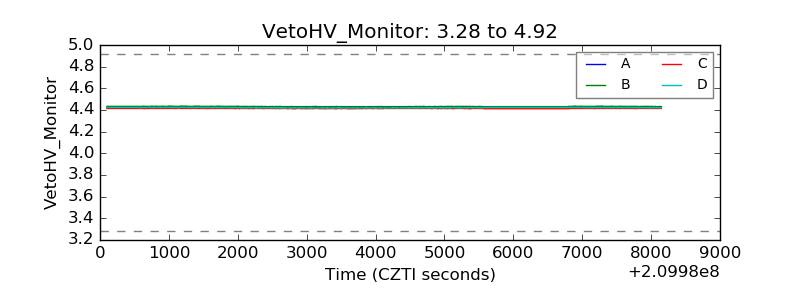 |
| Veto LLD | 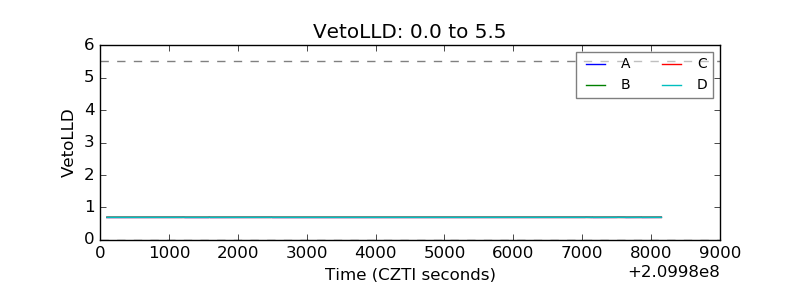 |
| Alpha Counter | 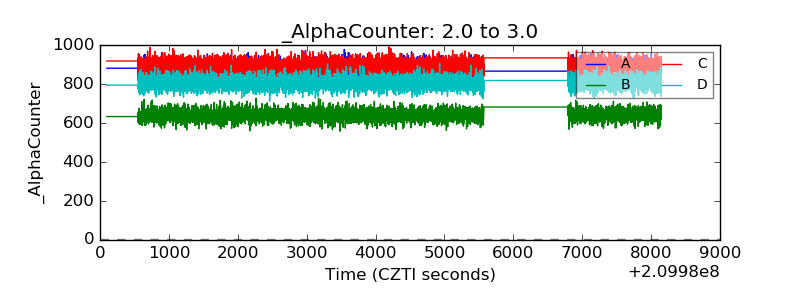 |
| _CPM_Rate | 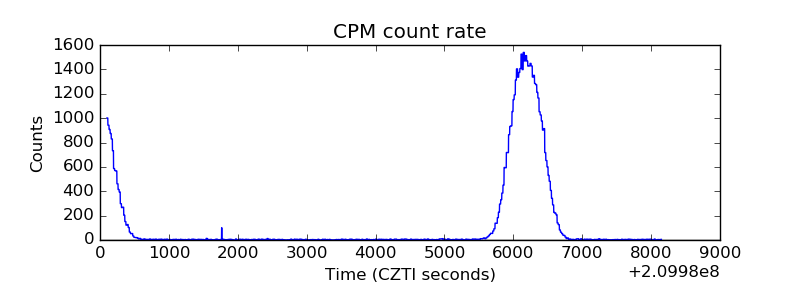 |
| CZT Counter | 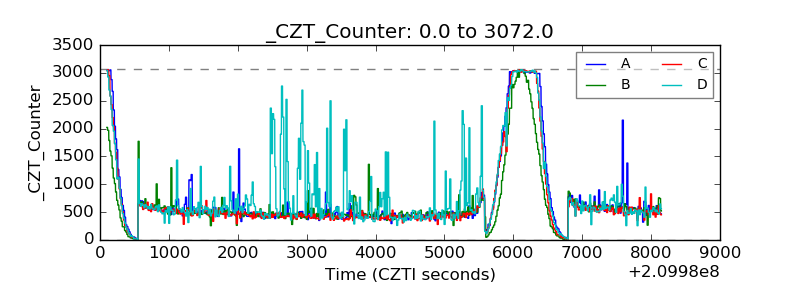 |
| +2.5 Volts monitor |  |
| +5 Volts monitor |  |
| _ROLL_ROT | 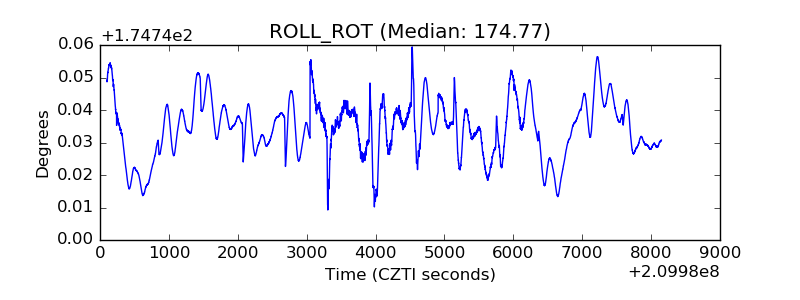 |
| _Roll_DEC | 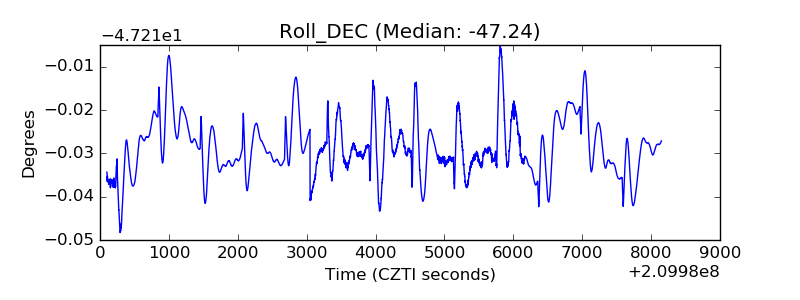 |
| _Roll_RA | 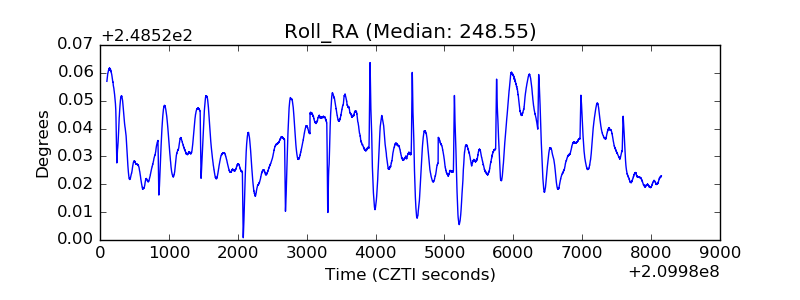 |
| Veto Counter | 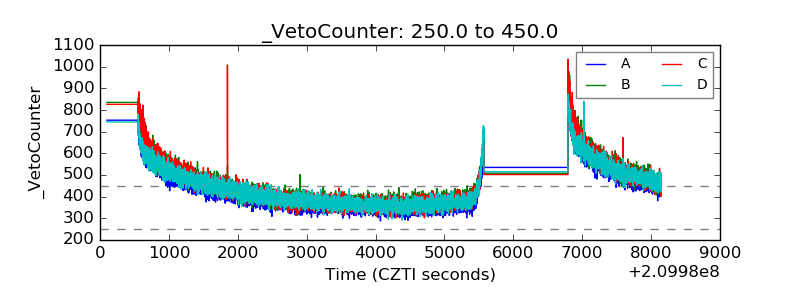 |