| Param | Original file | Final file |
|---|---|---|
| Filename | modeM0/AS1G05_157T01_9000000626_04949cztM0_level2.evt | modeM0/AS1G05_157T01_9000000626_04949cztM0_level2_quad_clean.evt |
| Size (bytes) | 449,467,200 | 95,569,920 |
| Size | 428.6 MB | 91.1 MB |
| Events in quadrant A | 3,209,696 | 632,320 |
| Events in quadrant B | 3,274,843 | 630,249 |
| Events in quadrant C | 2,780,202 | 627,798 |
| Events in quadrant D | 3,948,234 | 593,343 |
| Mode SS | |||
|---|---|---|---|
| Quadrant | BADHDUFLAG | Total packets | Discarded packets |
| A | 0 | 118 | 0 |
| B | 0 | 118 | 0 |
| C | 0 | 118 | 0 |
| D | 0 | 118 | 0 |
| Mode M0 | |||
|---|---|---|---|
| Quadrant | BADHDUFLAG | Total packets | Discarded packets |
| A | 0 | 13280 | 2 |
| B | 0 | 13465 | 1 |
| C | 0 | 12179 | 1 |
| D | 0 | 15674 | 1 |
| Mode M9 | |||
|---|---|---|---|
| Quadrant | BADHDUFLAG | Total packets | Discarded packets |
| A | 0 | 13 | 0 |
| B | 0 | 13 | 0 |
| C | 0 | 13 | 0 |
| D | 0 | 13 | 0 |
| Quadrant | Total seconds | Saturated seconds | Saturation percentage |
|---|---|---|---|
| A | 5880 | 134 | 2.278912% |
| B | 5880 | 121 | 2.057823% |
| C | 5880 | 63 | 1.071429% |
| D | 5880 | 279 | 4.744898% |
Noise dominated data is calculated using 1-second bins in cleaned event files. If a bin has >2000 counts, and if more than 50% of those come from <1% of pixels, then it is considered to be noise-dominated and hence unusable.
| Quadrant | # 1 sec bins | Bins with >0 counts | Bins with >2000 counts | High rate bins dominated by noise | Noise dominated (total time) | Noise dominated (detector-on time) | Marked lightcurve |
|---|---|---|---|---|---|---|---|
| A | 7160 | 5880 | 25 | 25 | 0.35% | 0.43% |  |
| B | 7160 | 5880 | 36 | 36 | 0.50% | 0.61% |  |
| C | 7160 | 5880 | 0 | 0 | 0.00% | 0.00% | 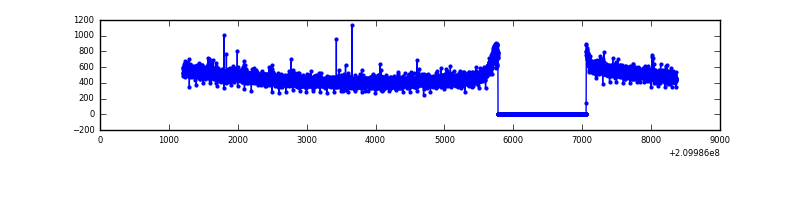 |
| D | 7160 | 5880 | 181 | 181 | 2.53% | 3.08% | 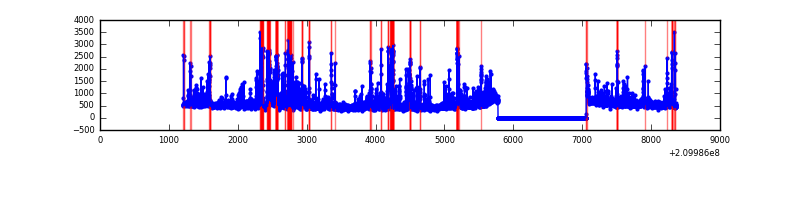 |
Top three noisy pixels from each quadrant. If the there are fewer than three noisy pixels in the level2.evt file, extra rows are filled as -1
| Pixel properties | Quadrant properties | ||||||
|---|---|---|---|---|---|---|---|
| Quadrant | DetID | PixID | Counts | Sigma | Mean | Median | Sigma |
| A | 0 | 31 | 189986 | 1263.94 | 740 | 726 | 149.7 |
| A | 8 | 15 | 91685 | 607.45 | 740 | 726 | 149.7 |
| A | 0 | 50 | 77070 | 509.85 | 740 | 726 | 149.7 |
| B | 10 | 16 | 225729 | 1620.47 | 737 | 722 | 138.9 |
| B | 4 | 80 | 69896 | 498.18 | 737 | 722 | 138.9 |
| B | 15 | 204 | 62996 | 448.49 | 737 | 722 | 138.9 |
| C | 13 | 61 | 5859 | 31.81 | 709 | 713 | 161.7 |
| C | 14 | 67 | 4557 | 23.76 | 709 | 713 | 161.7 |
| C | 1 | 16 | 3389 | 16.54 | 709 | 713 | 161.7 |
| D | 2 | 33 | 394468 | 2296.98 | 708 | 686 | 171.4 |
| D | 2 | 234 | 253276 | 1473.39 | 708 | 686 | 171.4 |
| D | 12 | 233 | 137574 | 798.48 | 708 | 686 | 171.4 |
Histogram calculated using DETX and DETY for each event in the final _common_clean file
| Quadrant A | 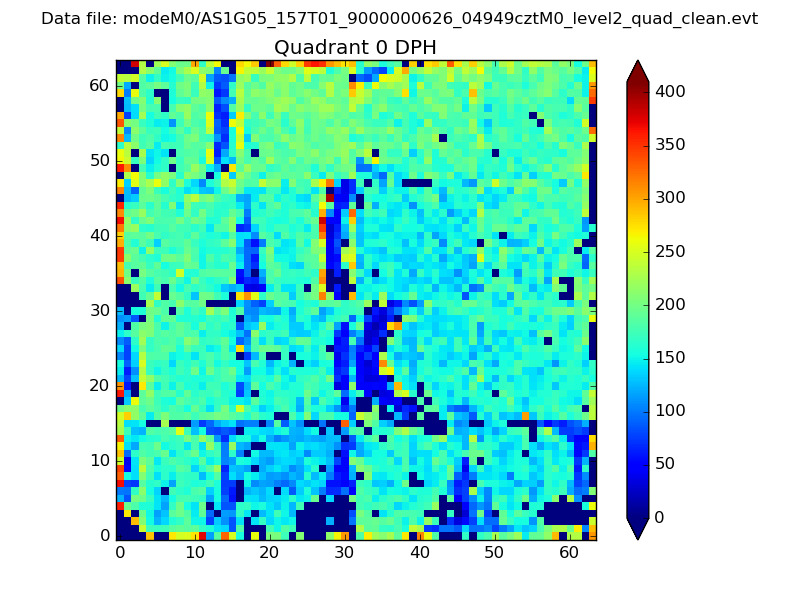 |
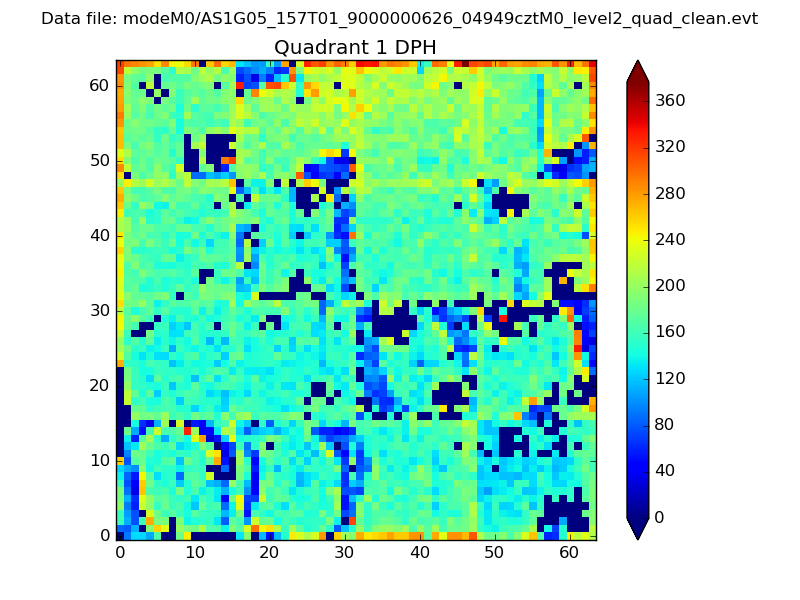 |
Quadrant B |
|---|---|---|---|
| Quadrant D | 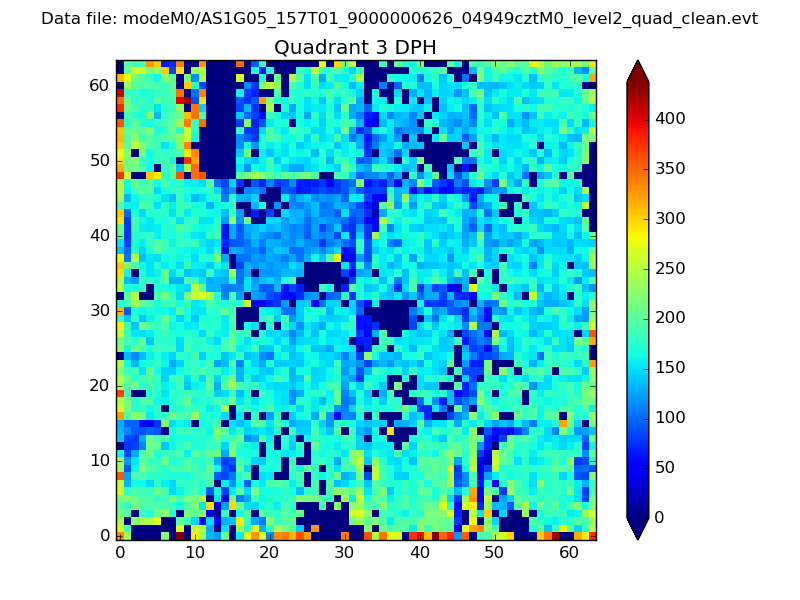 |
 |
Quadrant C |
| Plot type | Count rate plots | Images |
|---|---|---|
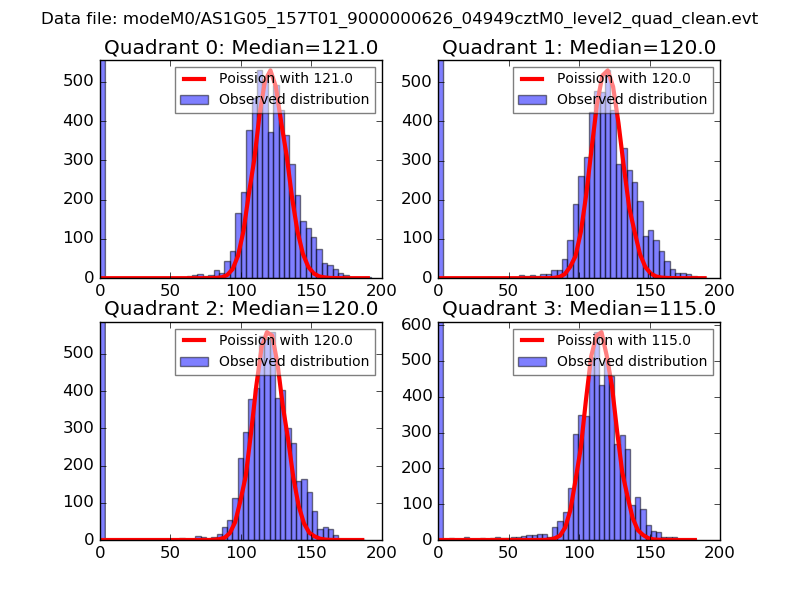
| Comparison with Poisson distribution Blue bars denote a histogram of data divided into 1 sec bins. Red curve is a Poisson curve with rate = median count rate of data. |
 |
 |
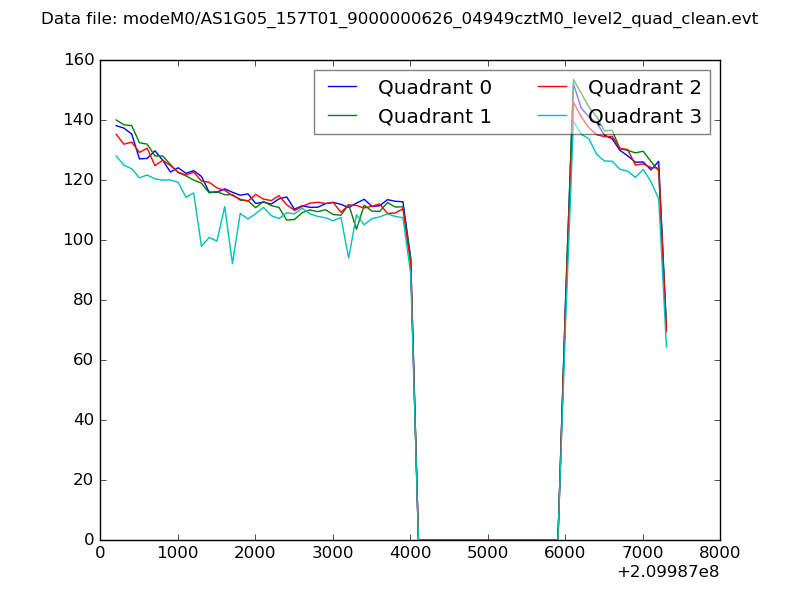
| Quadrant-wise count rates Data is divided into 100 sec bins |
 |
|
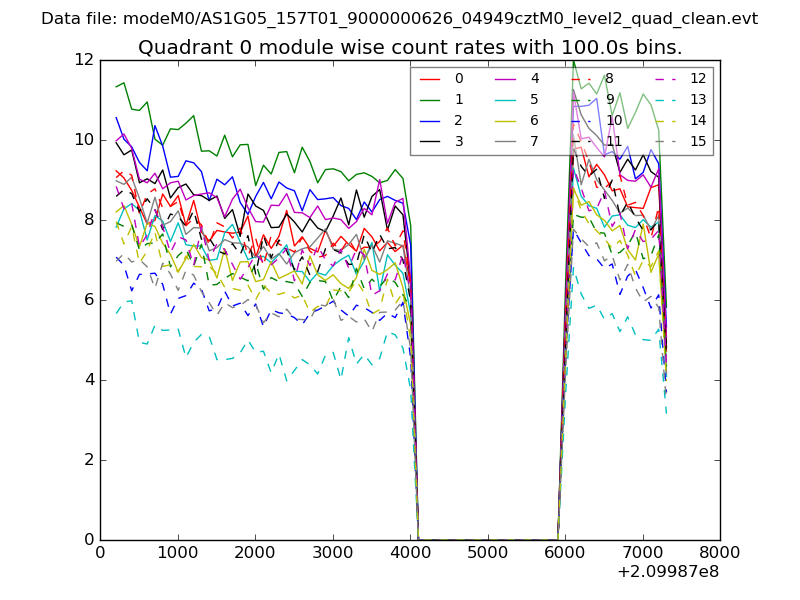
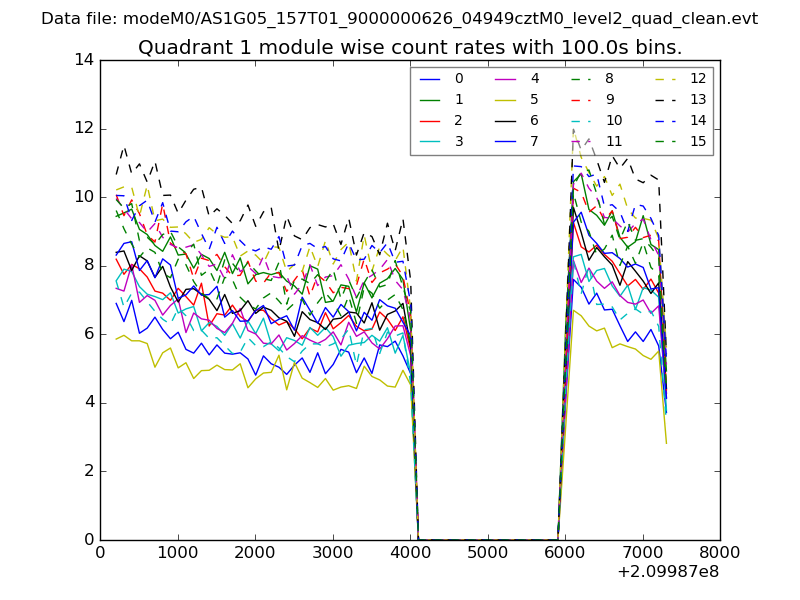
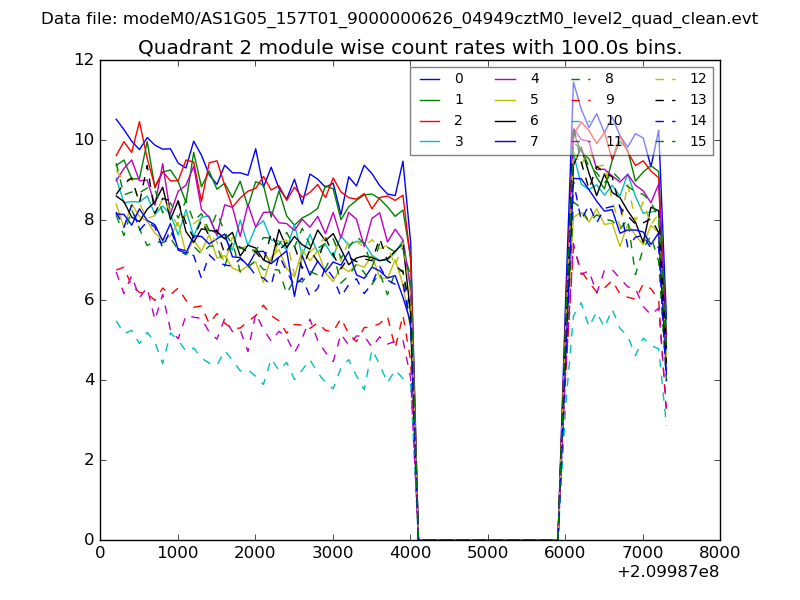
| Module-wise count rates for Quadrant A Data is divided into 100 sec bins |
 |
 |
| Module-wise count rates for Quadrant B Data is divided into 100 sec bins |
 |
 |
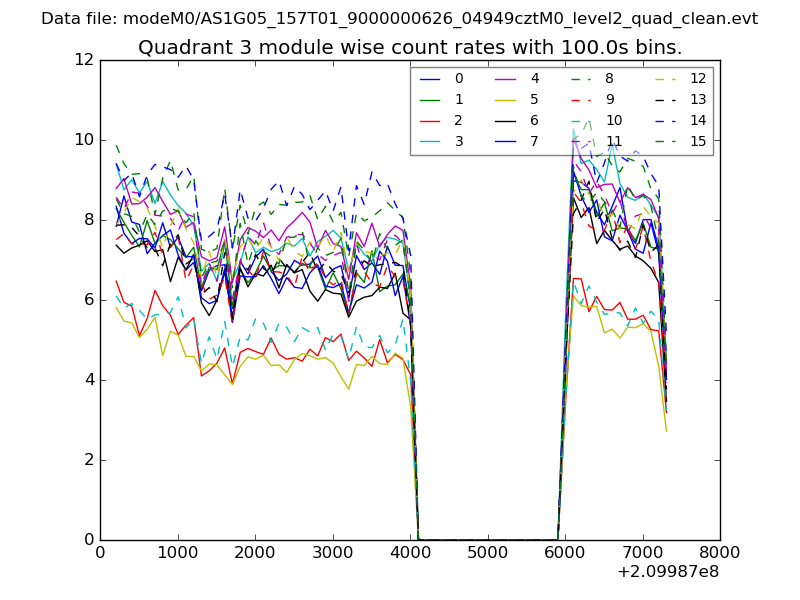
| Module-wise count rates for Quadrant C Data is divided into 100 sec bins |
 |
 |
| Module-wise count rates for Quadrant D Data is divided into 100 sec bins |
 |
 |
| Parameter | Plot |
|---|---|
| CZT HV Monitor | 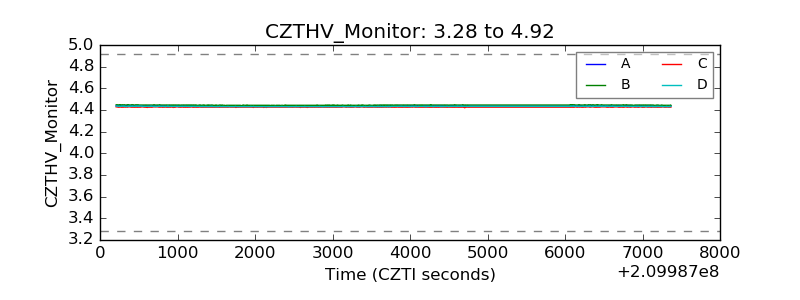 |
| D_VDD | 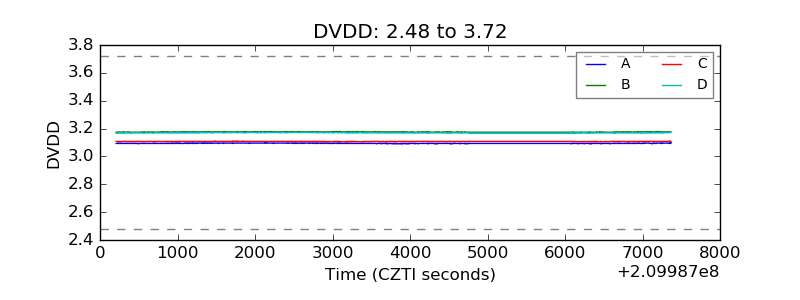 |
| Temperature 1 | 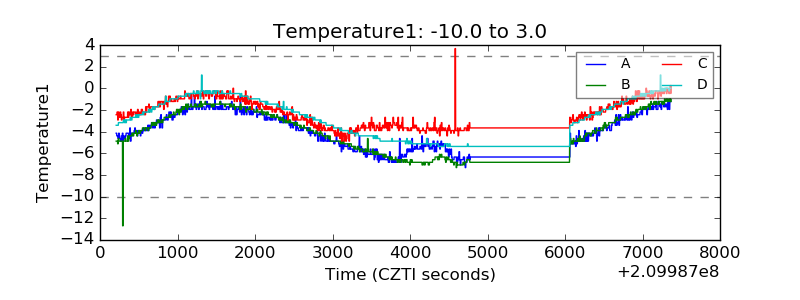 |
| Veto HV Monitor | 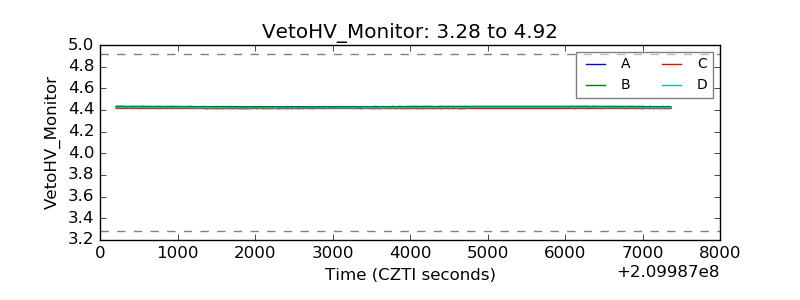 |
| Veto LLD | 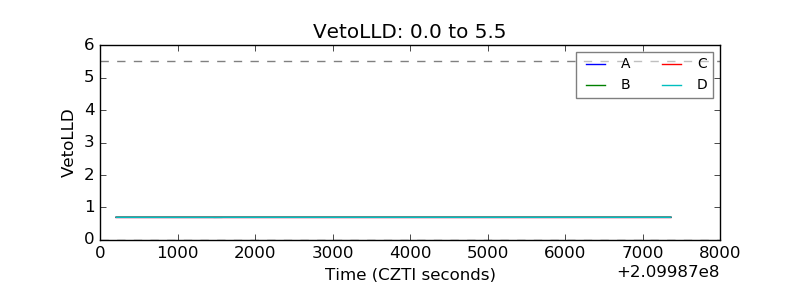 |
| Alpha Counter | 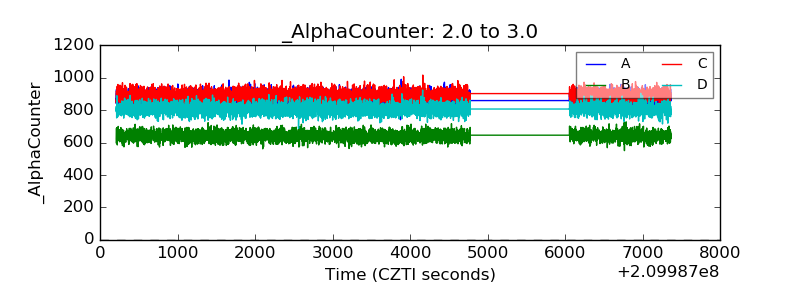 |
| _CPM_Rate | 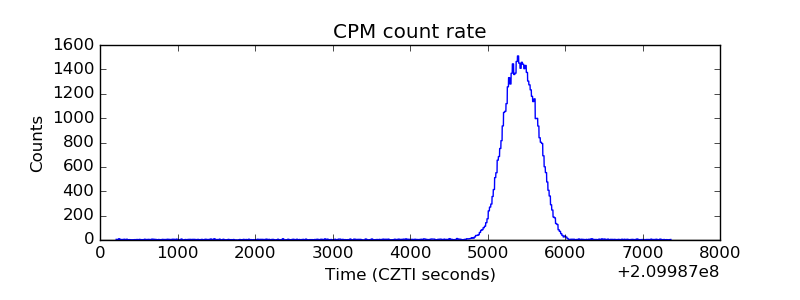 |
| CZT Counter | 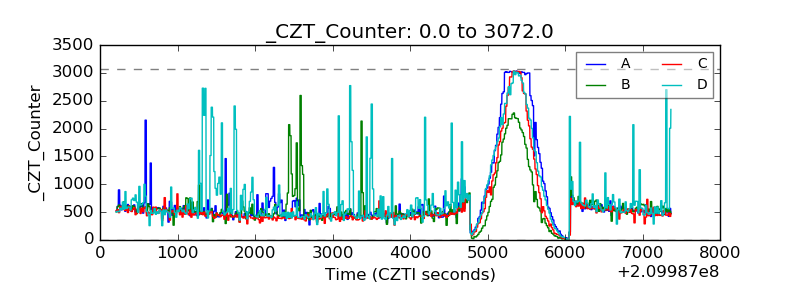 |
| +2.5 Volts monitor |  |
| +5 Volts monitor |  |
| _ROLL_ROT | 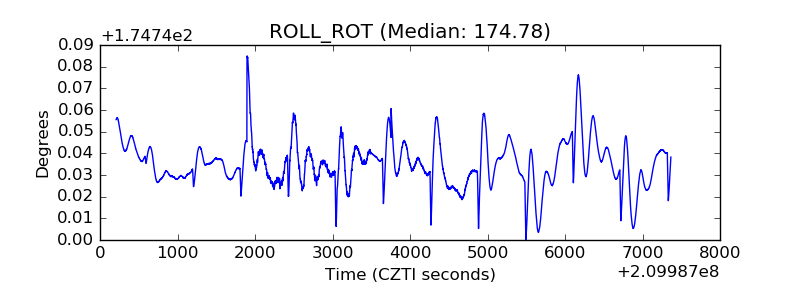 |
| _Roll_DEC | 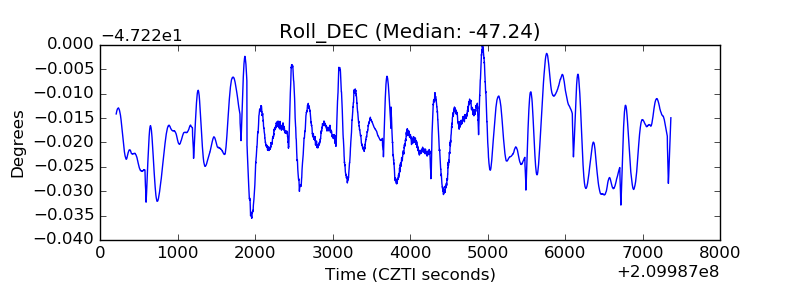 |
| _Roll_RA | 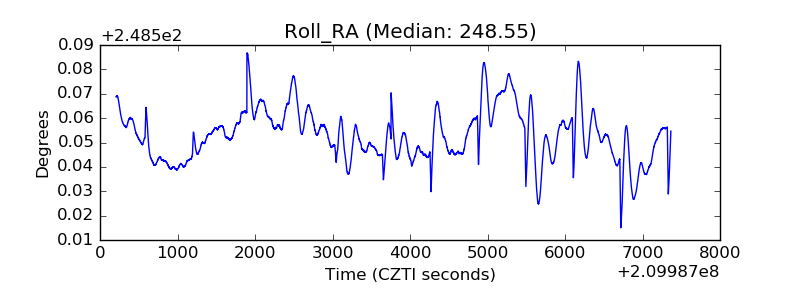 |
| Veto Counter | 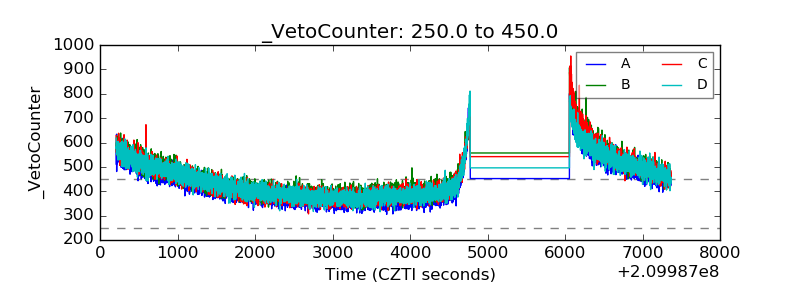 |