| Param | Original file | Final file |
|---|---|---|
| Filename | modeM0/AS1G05_157T01_9000000626_04951cztM0_level2.evt | modeM0/AS1G05_157T01_9000000626_04951cztM0_level2_quad_clean.evt |
| Size (bytes) | 496,065,600 | 83,626,560 |
| Size | 473.1 MB | 79.8 MB |
| Events in quadrant A | 3,615,382 | 527,313 |
| Events in quadrant B | 3,237,419 | 536,024 |
| Events in quadrant C | 2,823,471 | 535,302 |
| Events in quadrant D | 4,920,625 | 495,123 |
| Mode SS | |||
|---|---|---|---|
| Quadrant | BADHDUFLAG | Total packets | Discarded packets |
| A | 0 | 128 | 0 |
| B | 0 | 128 | 0 |
| C | 0 | 128 | 0 |
| D | 0 | 128 | 0 |
| Mode M0 | |||
|---|---|---|---|
| Quadrant | BADHDUFLAG | Total packets | Discarded packets |
| A | 0 | 14908 | 2 |
| B | 0 | 13691 | 1 |
| C | 0 | 12903 | 1 |
| D | 0 | 18785 | 1 |
| Mode M9 | |||
|---|---|---|---|
| Quadrant | BADHDUFLAG | Total packets | Discarded packets |
| A | 0 | 12 | 0 |
| B | 0 | 12 | 0 |
| C | 0 | 12 | 0 |
| D | 0 | 12 | 0 |
| Quadrant | Total seconds | Saturated seconds | Saturation percentage |
|---|---|---|---|
| A | 6279 | 281 | 4.475235% |
| B | 6279 | 87 | 1.385571% |
| C | 6279 | 50 | 0.796305% |
| D | 6279 | 447 | 7.118968% |
Noise dominated data is calculated using 1-second bins in cleaned event files. If a bin has >2000 counts, and if more than 50% of those come from <1% of pixels, then it is considered to be noise-dominated and hence unusable.
| Quadrant | # 1 sec bins | Bins with >0 counts | Bins with >2000 counts | High rate bins dominated by noise | Noise dominated (total time) | Noise dominated (detector-on time) | Marked lightcurve |
|---|---|---|---|---|---|---|---|
| A | 7474 | 6279 | 166 | 166 | 2.22% | 2.64% | 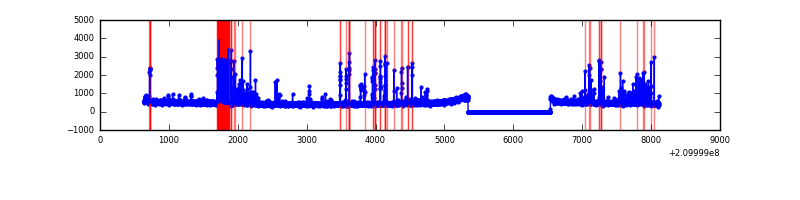 |
| B | 7474 | 6279 | 8 | 8 | 0.11% | 0.13% | 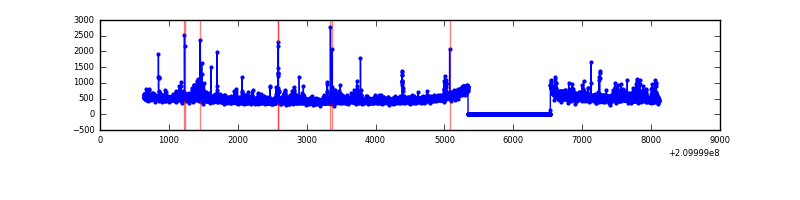 |
| C | 7474 | 6280 | 0 | 0 | 0.00% | 0.00% | 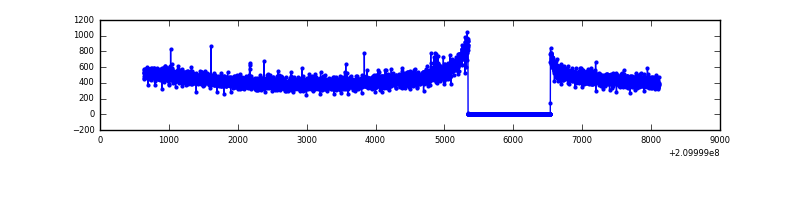 |
| D | 7474 | 6279 | 343 | 343 | 4.59% | 5.46% | 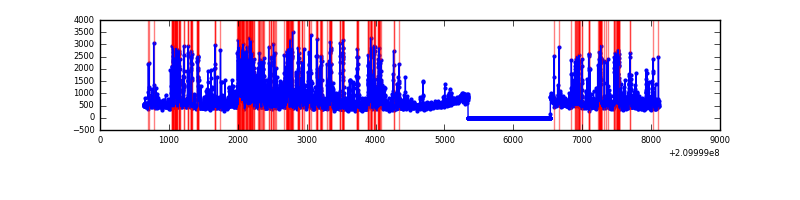 |
Top three noisy pixels from each quadrant. If the there are fewer than three noisy pixels in the level2.evt file, extra rows are filled as -1
| Pixel properties | Quadrant properties | ||||||
|---|---|---|---|---|---|---|---|
| Quadrant | DetID | PixID | Counts | Sigma | Mean | Median | Sigma |
| A | 0 | 31 | 724289 | 4734.17 | 744 | 728 | 152.8 |
| A | 4 | 2 | 13042 | 80.57 | 744 | 728 | 152.8 |
| A | 15 | 174 | 12589 | 77.61 | 744 | 728 | 152.8 |
| B | 15 | 204 | 113531 | 780.13 | 757 | 741 | 144.6 |
| B | 10 | 16 | 81292 | 557.15 | 757 | 741 | 144.6 |
| B | 4 | 80 | 69525 | 475.76 | 757 | 741 | 144.6 |
| C | 12 | 4 | 7163 | 39.04 | 720 | 723 | 165.0 |
| C | 13 | 61 | 5915 | 31.47 | 720 | 723 | 165.0 |
| C | 1 | 16 | 4066 | 20.27 | 720 | 723 | 165.0 |
| D | 2 | 33 | 889729 | 5088.28 | 711 | 689 | 174.7 |
| D | 1 | 7 | 465983 | 2663.04 | 711 | 689 | 174.7 |
| D | 13 | 235 | 446688 | 2552.61 | 711 | 689 | 174.7 |
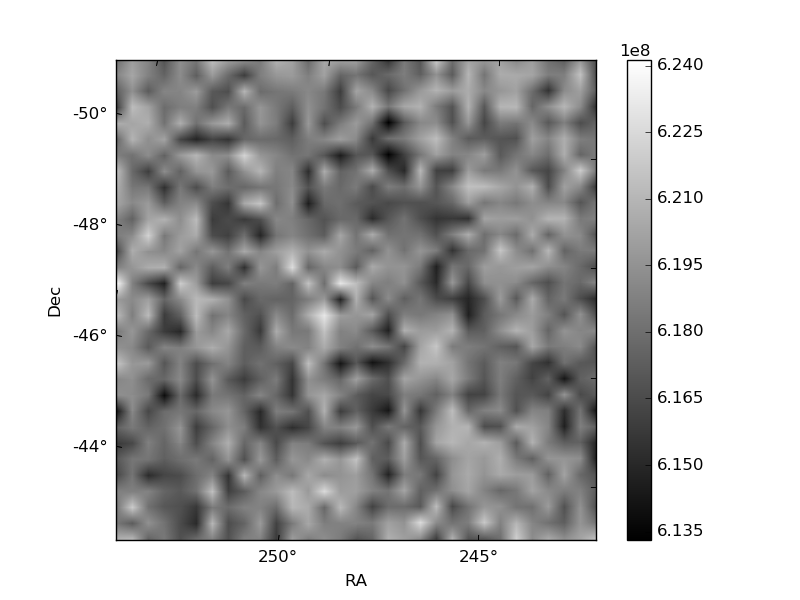
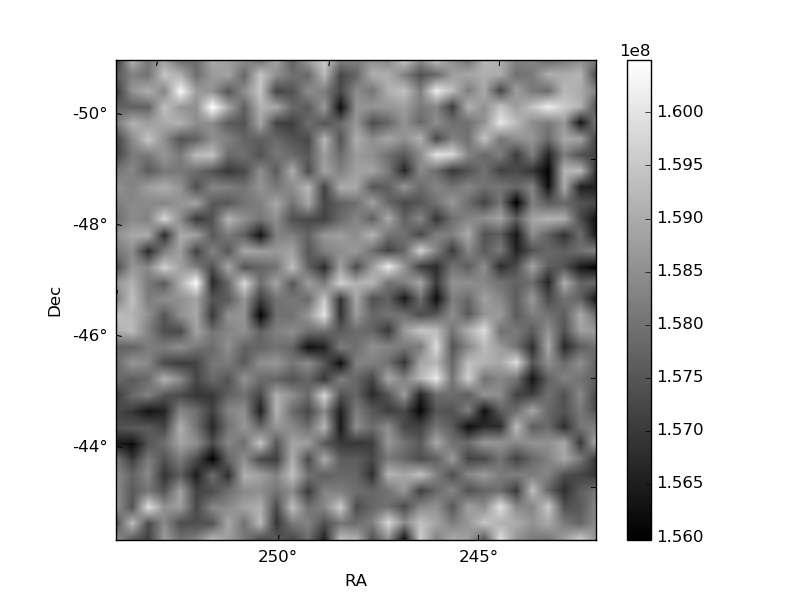
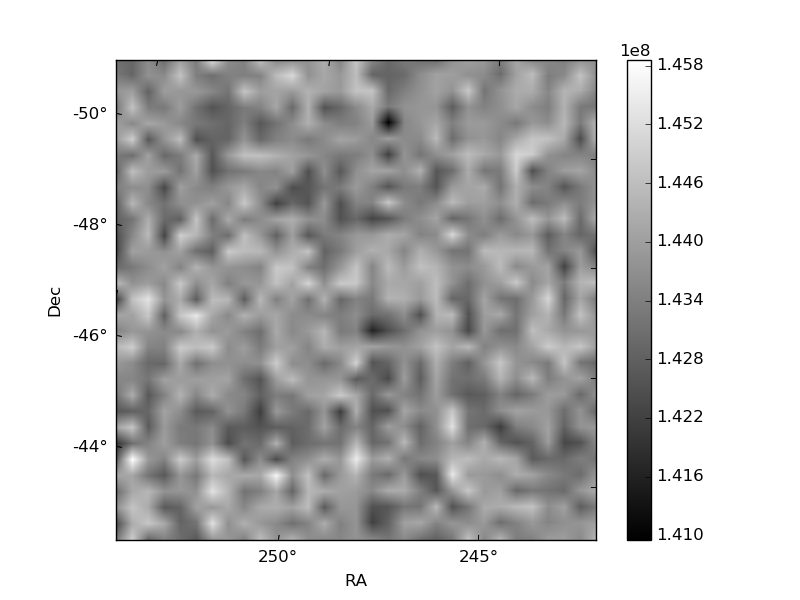
Histogram calculated using DETX and DETY for each event in the final _common_clean file
| Quadrant A | 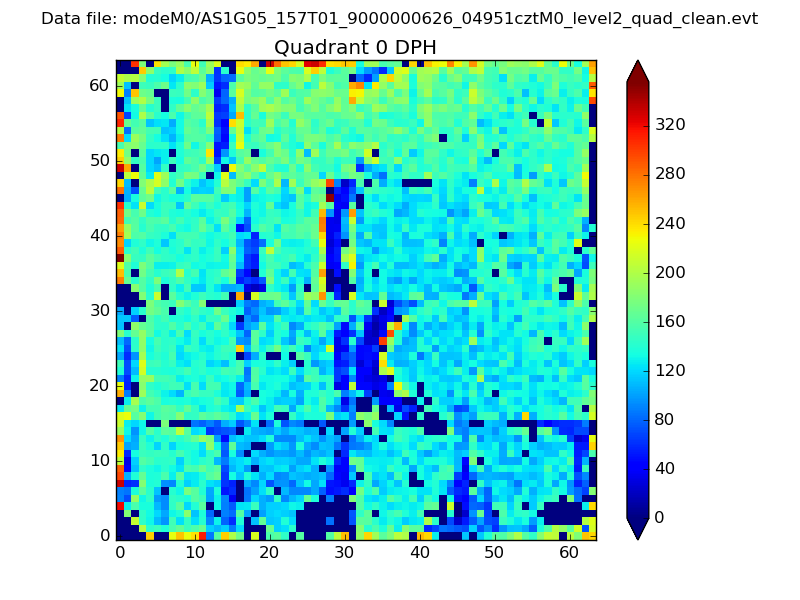 |
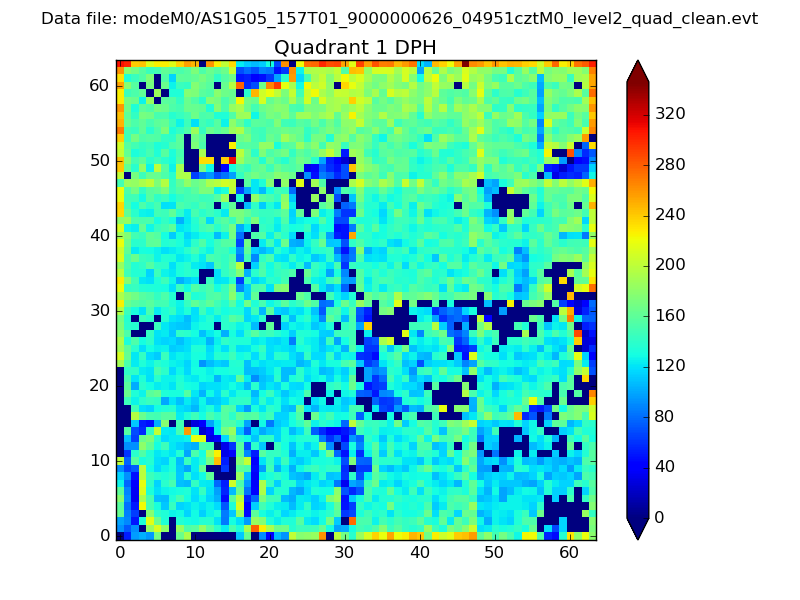 |
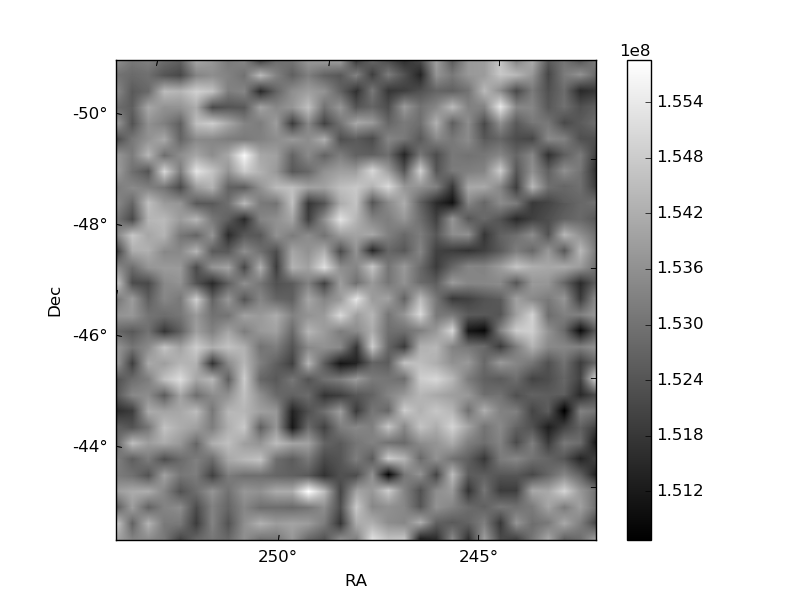
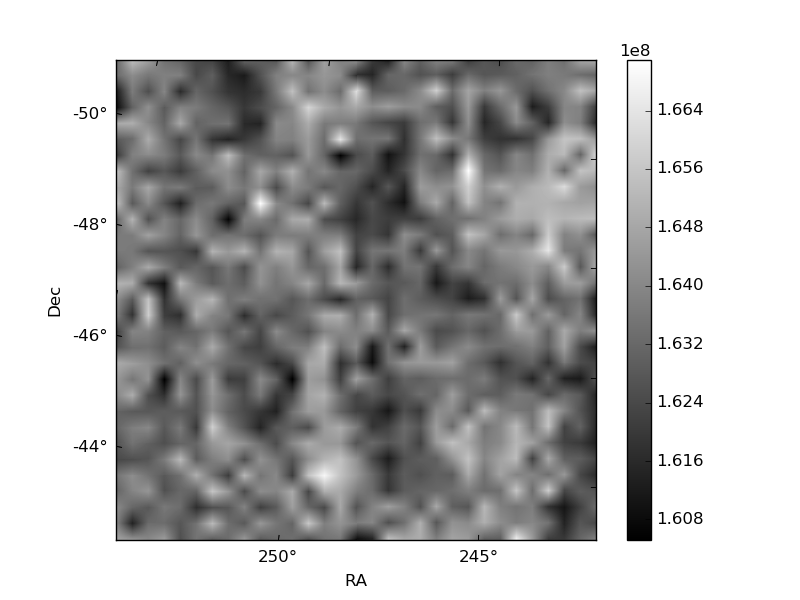
Quadrant B |
|---|---|---|---|
| Quadrant D | 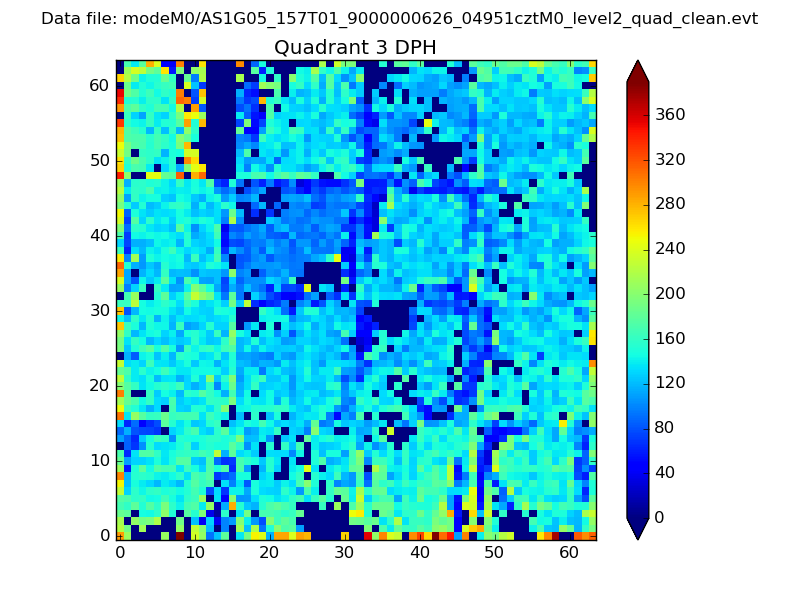 |
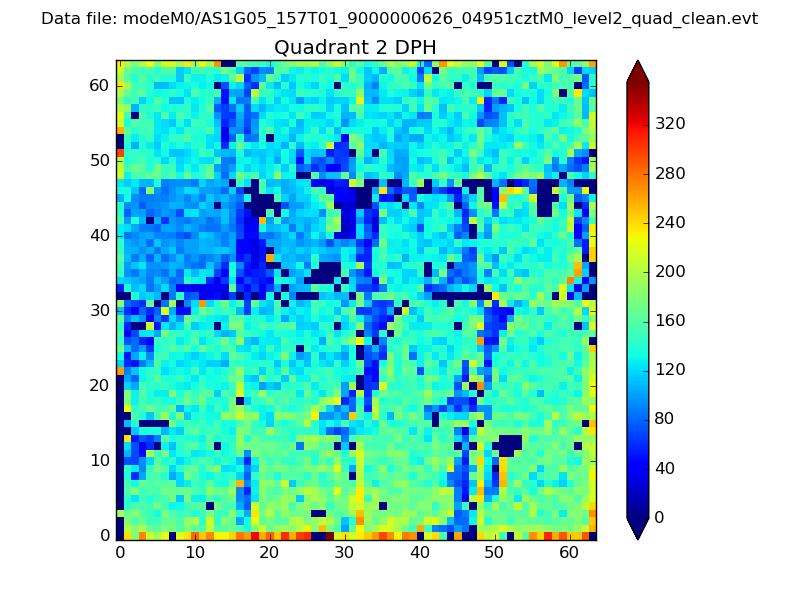 |
Quadrant C |
| Plot type | Count rate plots | Images |
|---|---|---|
| Comparison with Poisson distribution Blue bars denote a histogram of data divided into 1 sec bins. Red curve is a Poisson curve with rate = median count rate of data. |
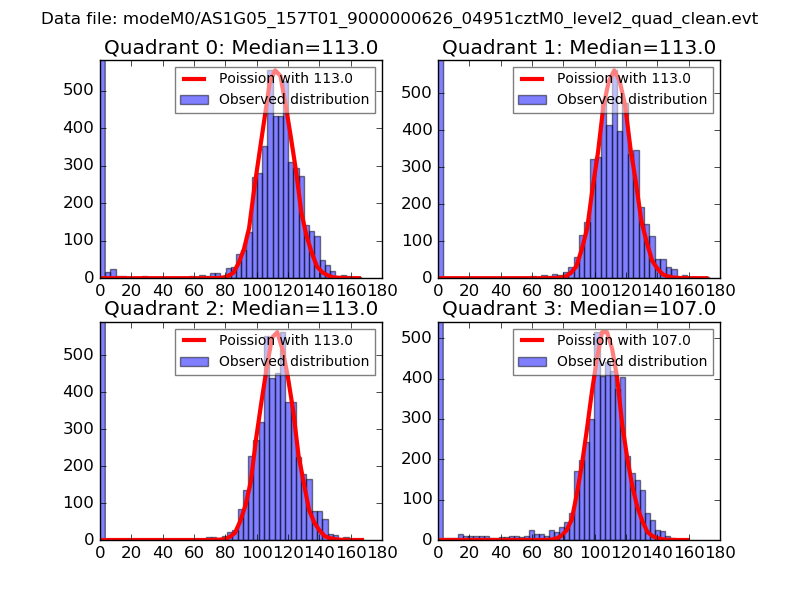 |
 |
| Quadrant-wise count rates Data is divided into 100 sec bins |
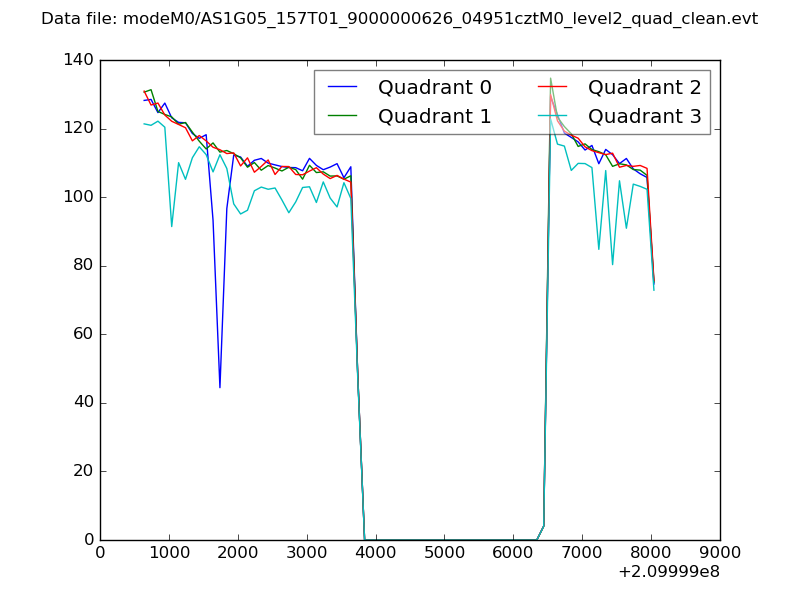 |
|
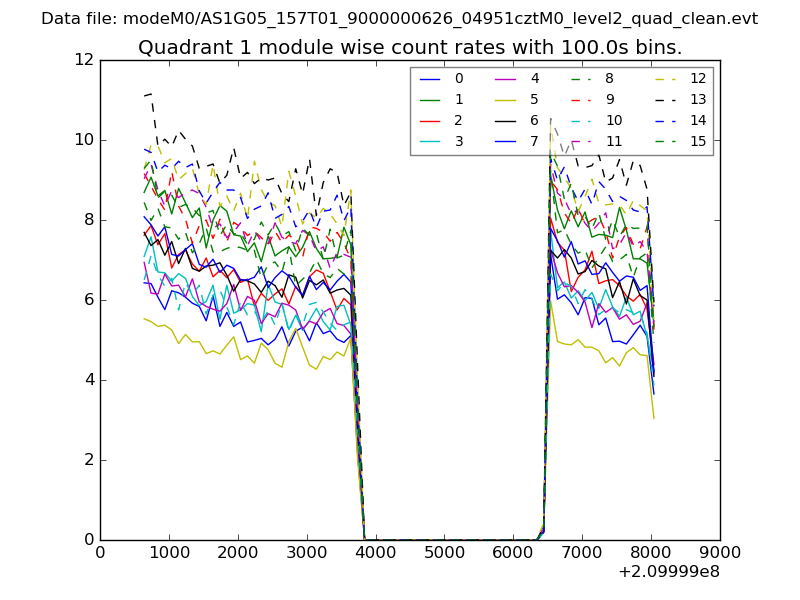
| Module-wise count rates for Quadrant A Data is divided into 100 sec bins |
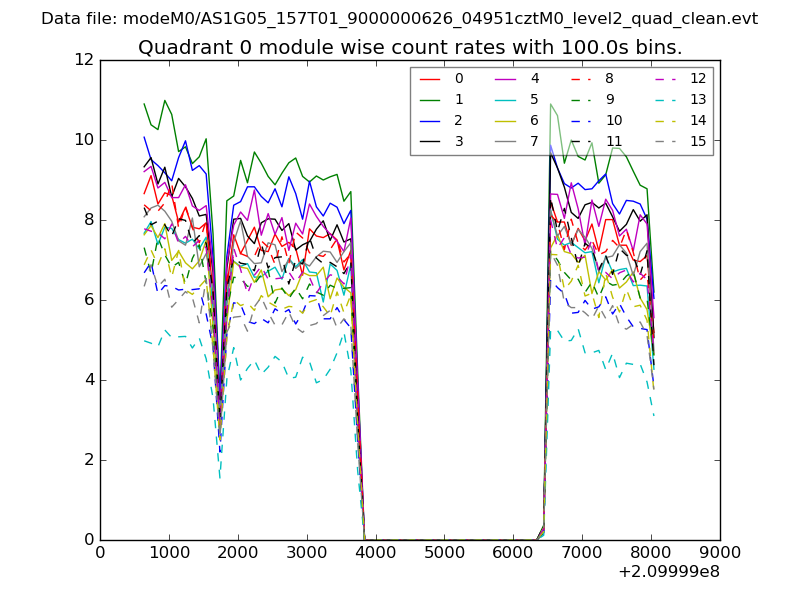 |
 |
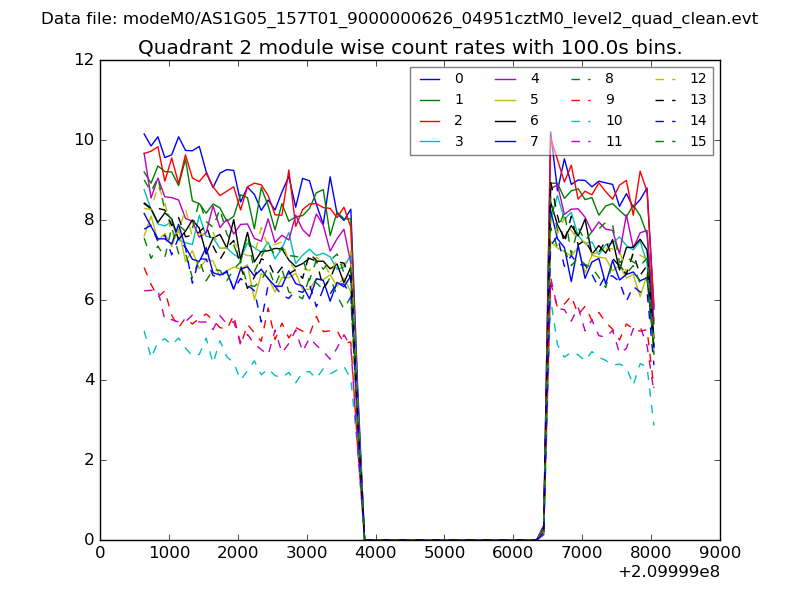
| Module-wise count rates for Quadrant B Data is divided into 100 sec bins |
 |
 |
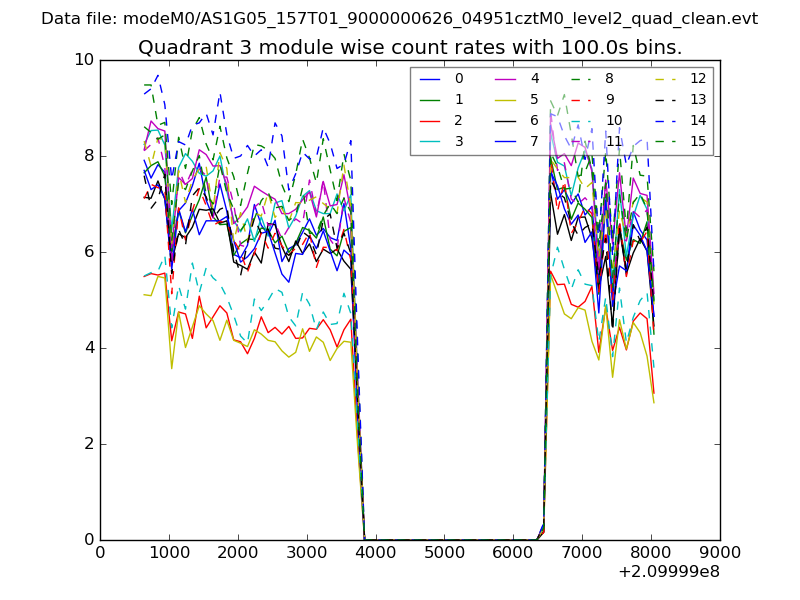
| Module-wise count rates for Quadrant C Data is divided into 100 sec bins |
 |
 |
| Module-wise count rates for Quadrant D Data is divided into 100 sec bins |
 |
 |
| Parameter | Plot |
|---|---|
| CZT HV Monitor | 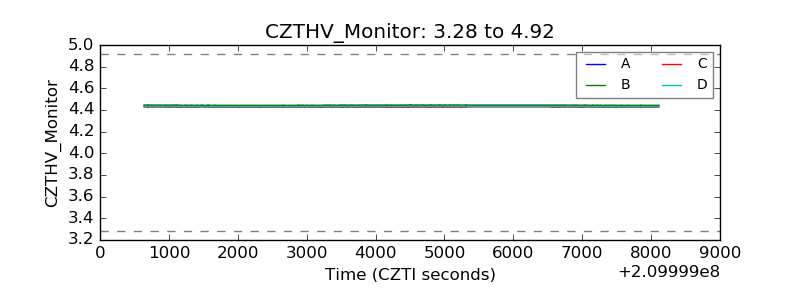 |
| D_VDD | 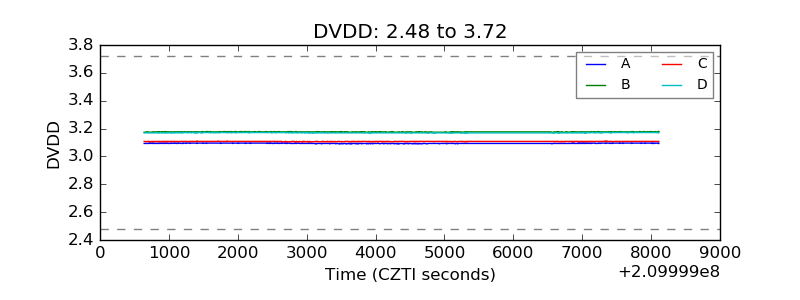 |
| Temperature 1 | 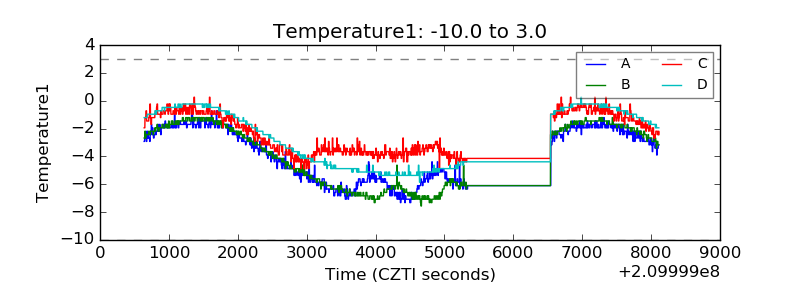 |
| Veto HV Monitor | 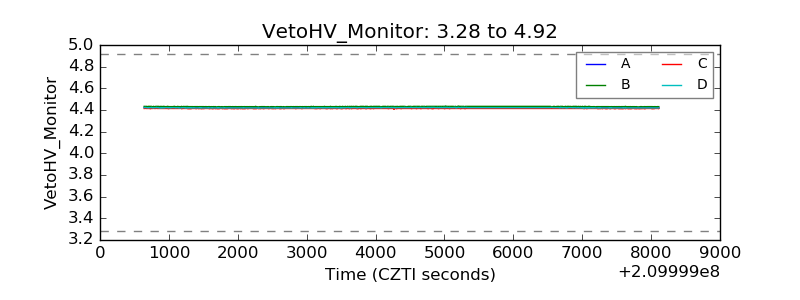 |
| Veto LLD | 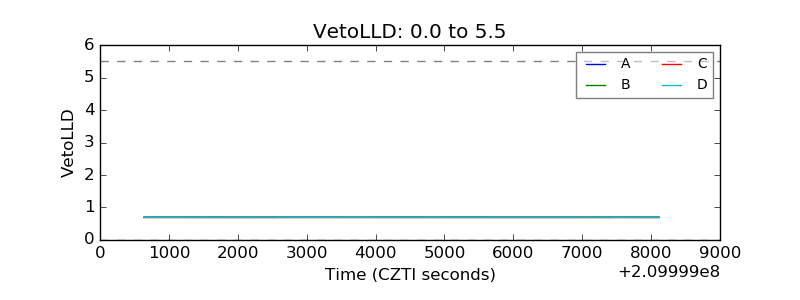 |
| Alpha Counter | 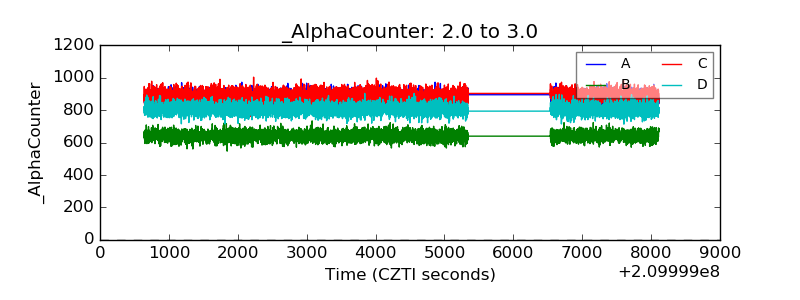 |
| _CPM_Rate | 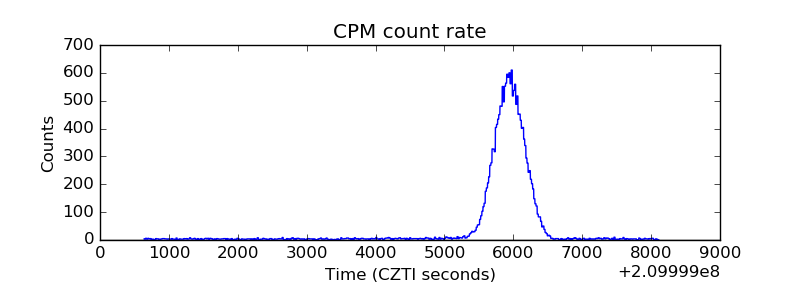 |
| CZT Counter | 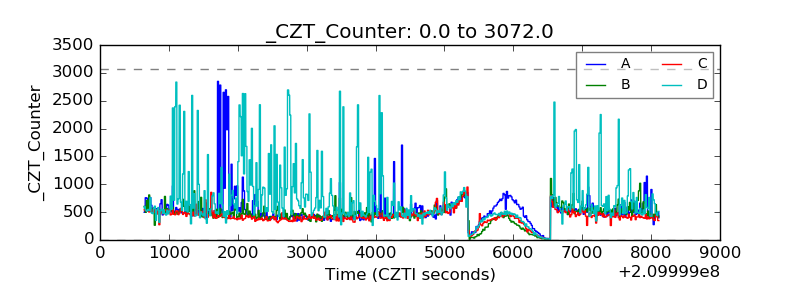 |
| +2.5 Volts monitor |  |
| +5 Volts monitor |  |
| _ROLL_ROT | 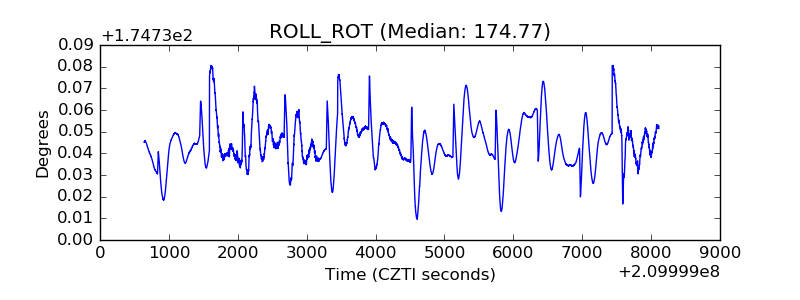 |
| _Roll_DEC | 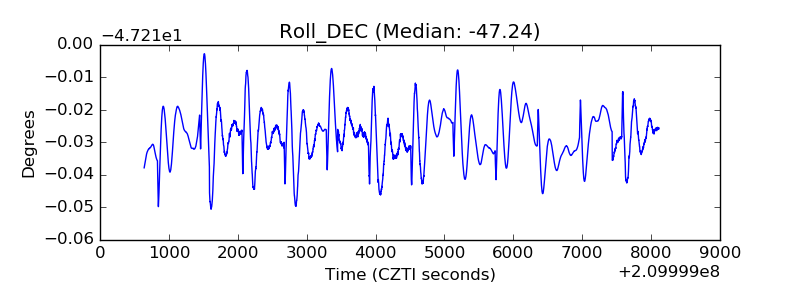 |
| _Roll_RA | 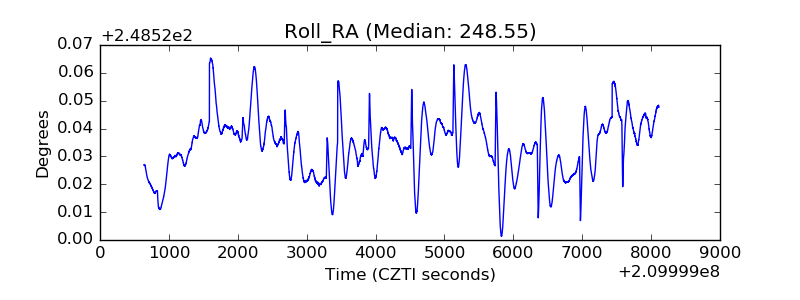 |
| Veto Counter | 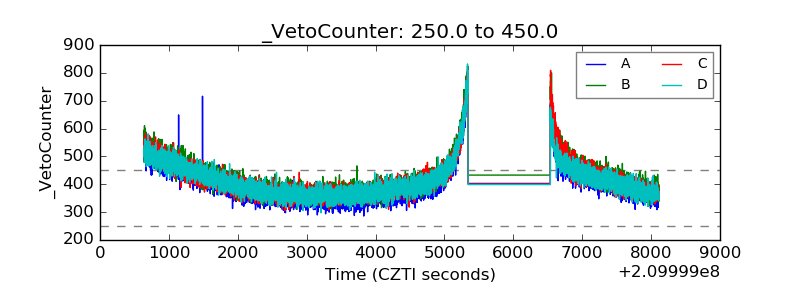 |