| Param | Original file | Final file |
|---|---|---|
| Filename | modeM0/AS1G05_157T01_9000000626_04952cztM0_level2.evt | modeM0/AS1G05_157T01_9000000626_04952cztM0_level2_quad_clean.evt |
| Size (bytes) | 565,479,360 | 72,648,000 |
| Size | 539.3 MB | 69.3 MB |
| Events in quadrant A | 4,886,431 | 411,154 |
| Events in quadrant B | 3,274,697 | 464,628 |
| Events in quadrant C | 2,692,371 | 471,126 |
| Events in quadrant D | 5,852,437 | 420,130 |
| Mode SS | |||
|---|---|---|---|
| Quadrant | BADHDUFLAG | Total packets | Discarded packets |
| A | 0 | 126 | 0 |
| B | 0 | 126 | 0 |
| C | 0 | 126 | 0 |
| D | 0 | 126 | 0 |
| Mode M0 | |||
|---|---|---|---|
| Quadrant | BADHDUFLAG | Total packets | Discarded packets |
| A | 0 | 18776 | 2 |
| B | 0 | 13922 | 1 |
| C | 0 | 12666 | 1 |
| D | 0 | 21674 | 1 |
| Mode M9 | |||
|---|---|---|---|
| Quadrant | BADHDUFLAG | Total packets | Discarded packets |
| A | 0 | 10 | 0 |
| B | 0 | 10 | 0 |
| C | 0 | 10 | 0 |
| D | 0 | 10 | 0 |
| Quadrant | Total seconds | Saturated seconds | Saturation percentage |
|---|---|---|---|
| A | 6189 | 820 | 13.249313% |
| B | 6189 | 104 | 1.680401% |
| C | 6189 | 16 | 0.258523% |
| D | 6189 | 653 | 10.550978% |
Noise dominated data is calculated using 1-second bins in cleaned event files. If a bin has >2000 counts, and if more than 50% of those come from <1% of pixels, then it is considered to be noise-dominated and hence unusable.
| Quadrant | # 1 sec bins | Bins with >0 counts | Bins with >2000 counts | High rate bins dominated by noise | Noise dominated (total time) | Noise dominated (detector-on time) | Marked lightcurve |
|---|---|---|---|---|---|---|---|
| A | 7178 | 6189 | 743 | 743 | 10.35% | 12.01% | 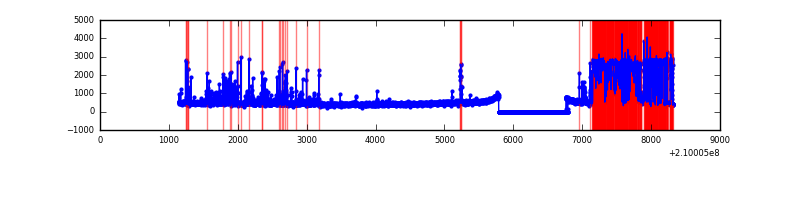 |
| B | 7179 | 6190 | 57 | 57 | 0.79% | 0.92% | 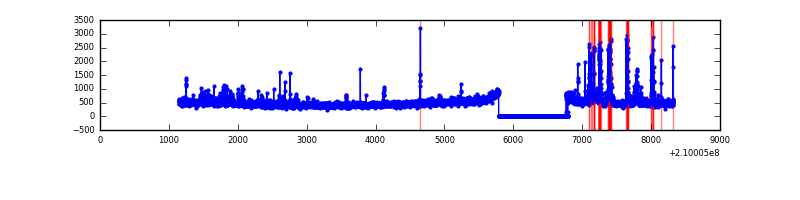 |
| C | 7179 | 6190 | 0 | 0 | 0.00% | 0.00% | 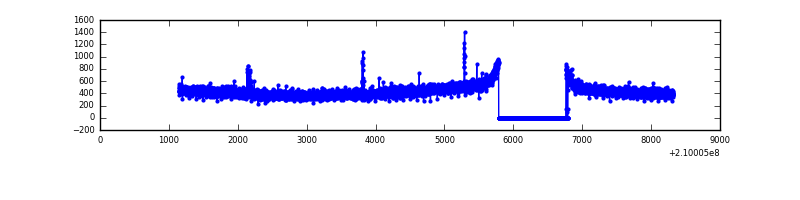 |
| D | 7178 | 6190 | 579 | 579 | 8.07% | 9.35% | 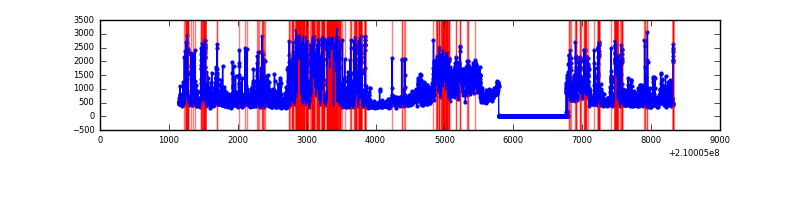 |
Top three noisy pixels from each quadrant. If the there are fewer than three noisy pixels in the level2.evt file, extra rows are filled as -1
| Pixel properties | Quadrant properties | ||||||
|---|---|---|---|---|---|---|---|
| Quadrant | DetID | PixID | Counts | Sigma | Mean | Median | Sigma |
| A | 0 | 31 | 2057111 | 15416.26 | 655 | 642 | 133.4 |
| A | 4 | 2 | 214472 | 1602.97 | 655 | 642 | 133.4 |
| A | 0 | 50 | 84114 | 625.74 | 655 | 642 | 133.4 |
| B | 10 | 16 | 277552 | 1989.13 | 715 | 699 | 139.2 |
| B | 15 | 204 | 78441 | 558.56 | 715 | 699 | 139.2 |
| B | 4 | 80 | 37072 | 261.33 | 715 | 699 | 139.2 |
| C | 1 | 16 | 13353 | 80.34 | 683 | 686 | 157.7 |
| C | 12 | 4 | 9242 | 54.26 | 683 | 686 | 157.7 |
| C | 13 | 61 | 5590 | 31.1 | 683 | 686 | 157.7 |
| D | 2 | 33 | 1494358 | 9309.56 | 656 | 636 | 160.5 |
| D | 1 | 7 | 1148137 | 7151.75 | 656 | 636 | 160.5 |
| D | 13 | 235 | 174116 | 1081.21 | 656 | 636 | 160.5 |
Histogram calculated using DETX and DETY for each event in the final _common_clean file
| Quadrant A | 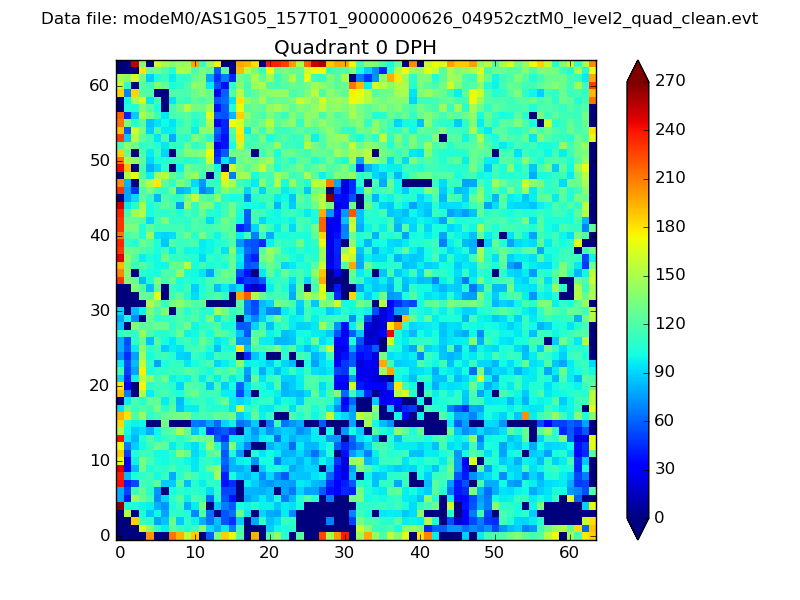 |
 |
Quadrant B |
|---|---|---|---|
| Quadrant D |  |
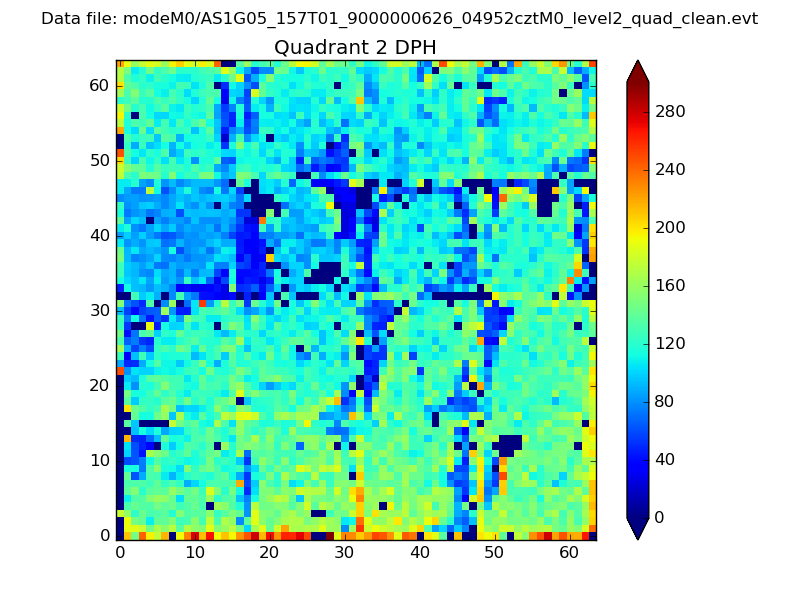 |
Quadrant C |
| Plot type | Count rate plots | Images |
|---|---|---|
| Comparison with Poisson distribution Blue bars denote a histogram of data divided into 1 sec bins. Red curve is a Poisson curve with rate = median count rate of data. |
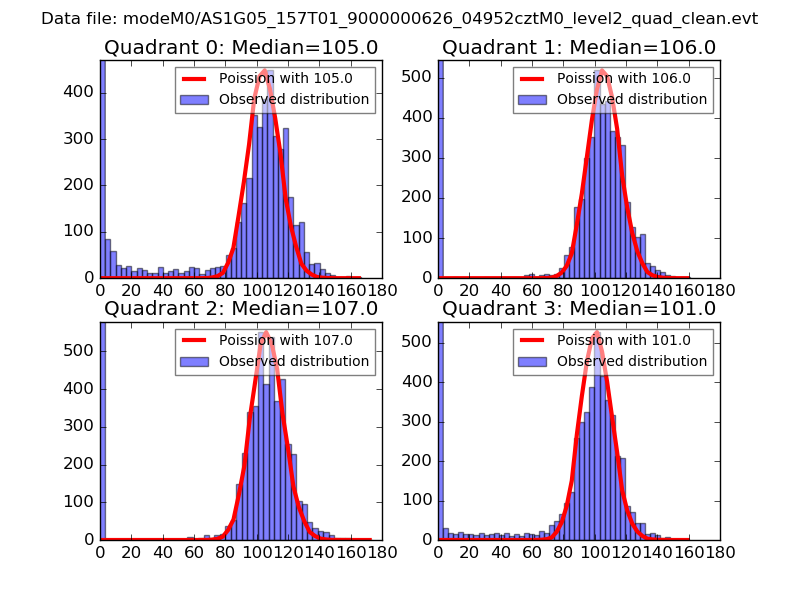 |
 |
| Quadrant-wise count rates Data is divided into 100 sec bins |
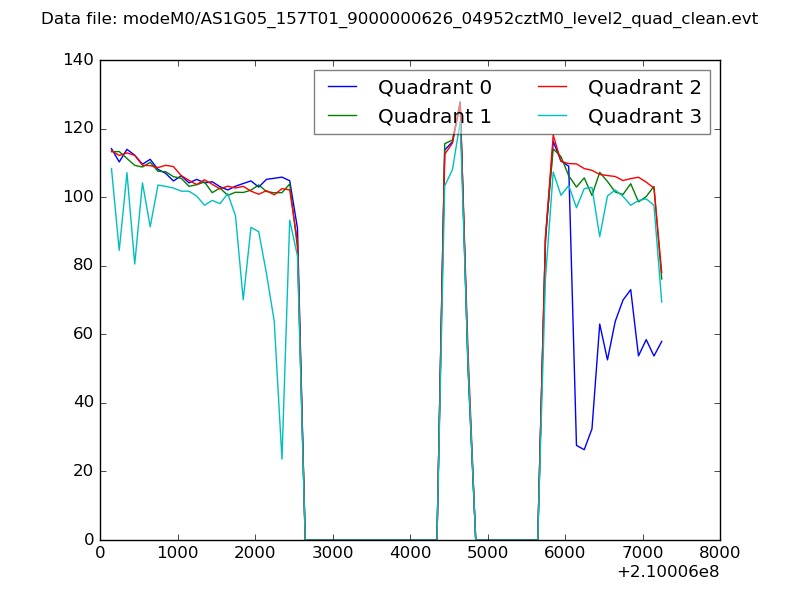 |
|
| Module-wise count rates for Quadrant A Data is divided into 100 sec bins |
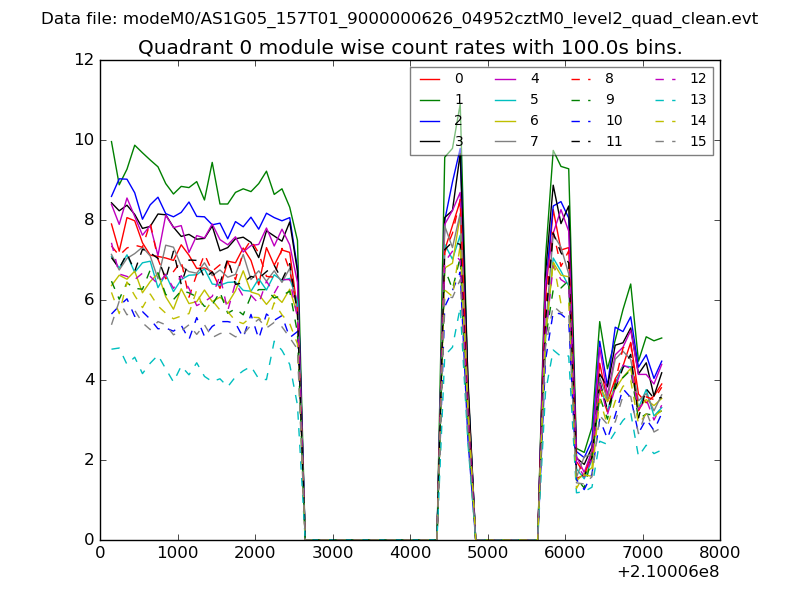 |
 |
| Module-wise count rates for Quadrant B Data is divided into 100 sec bins |
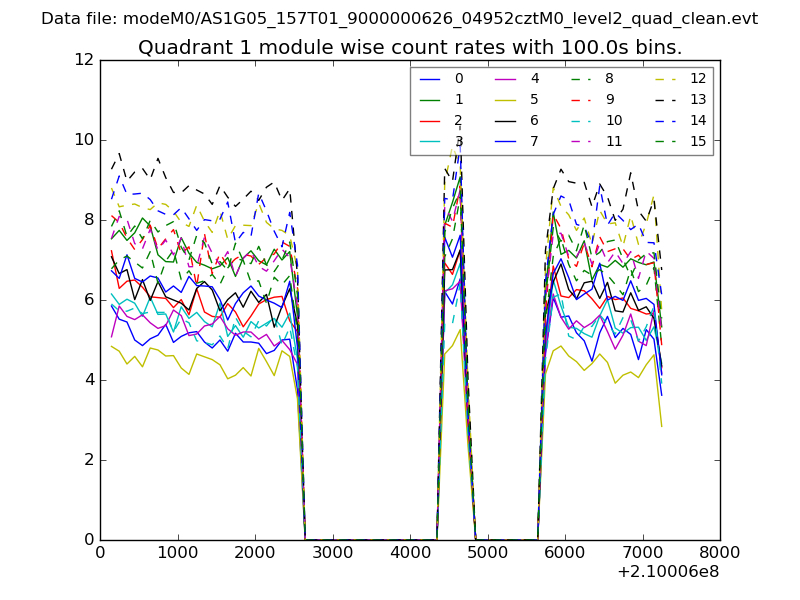 |
 |
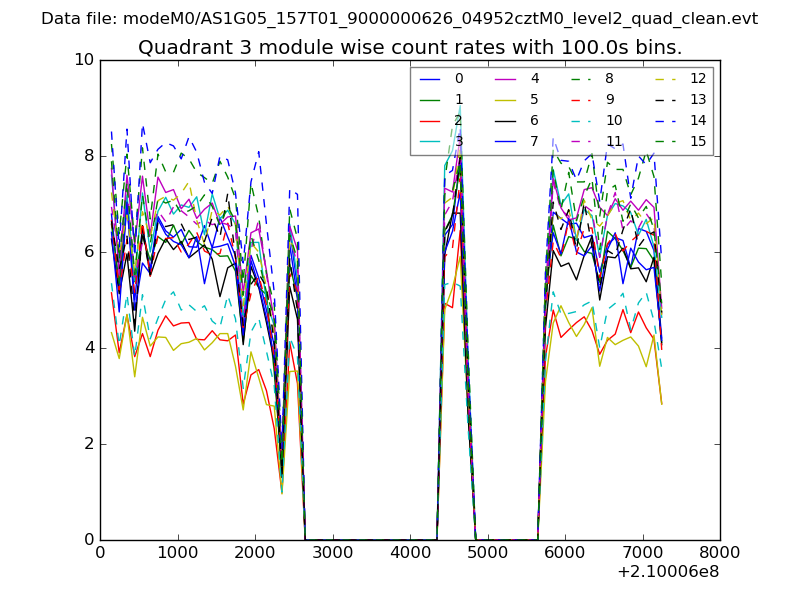
| Module-wise count rates for Quadrant C Data is divided into 100 sec bins |
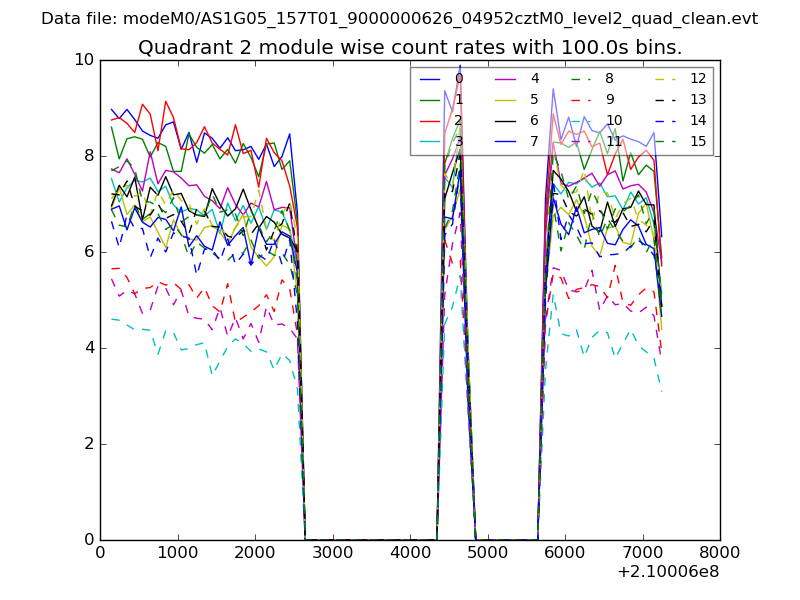 |
 |
| Module-wise count rates for Quadrant D Data is divided into 100 sec bins |
 |
 |
| Parameter | Plot |
|---|---|
| CZT HV Monitor | 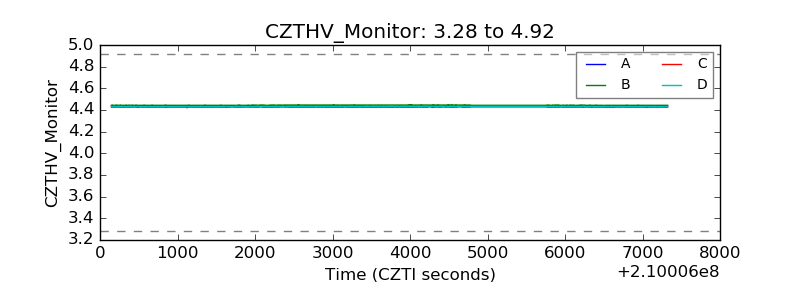 |
| D_VDD | 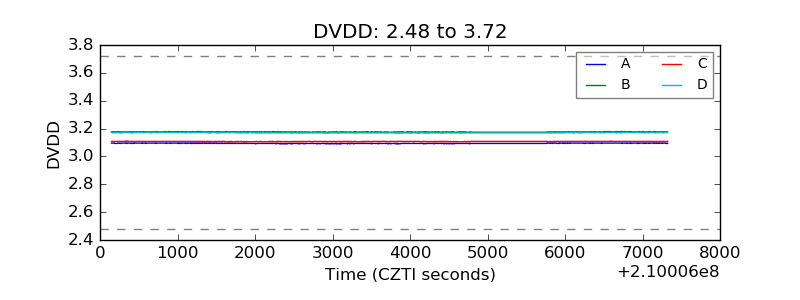 |
| Temperature 1 | 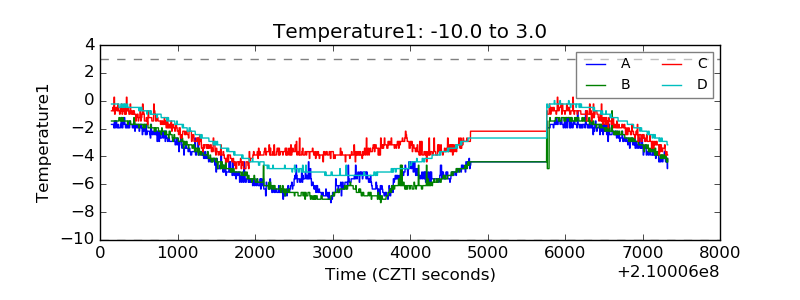 |
| Veto HV Monitor | 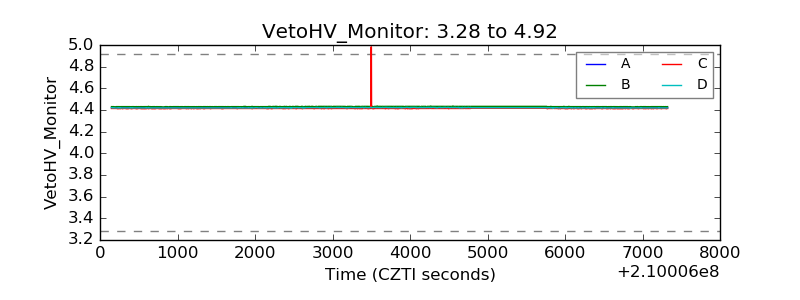 |
| Veto LLD |  |
| Alpha Counter | 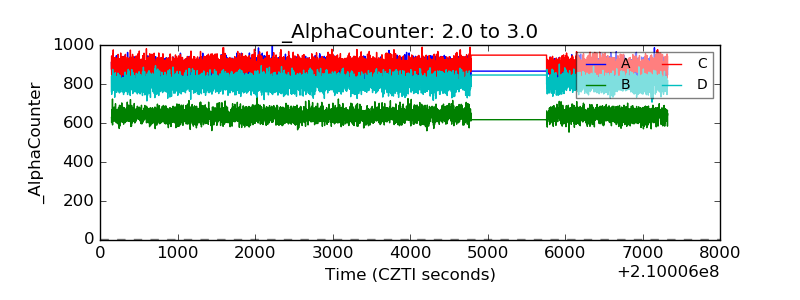 |
| _CPM_Rate | 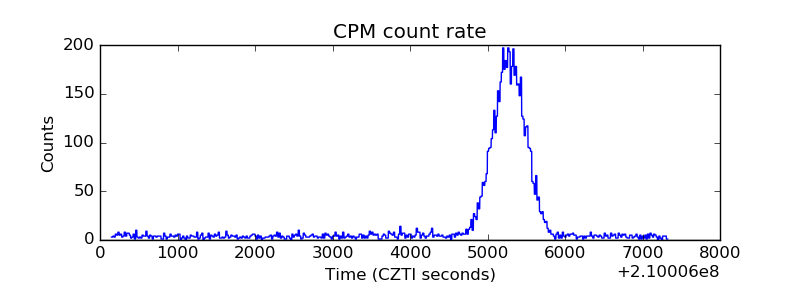 |
| CZT Counter | 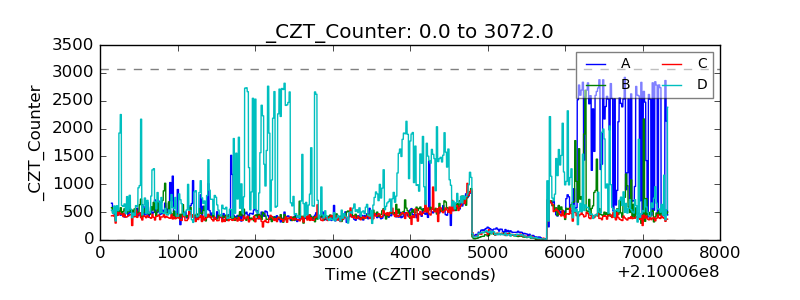 |
| +2.5 Volts monitor |  |
| +5 Volts monitor | 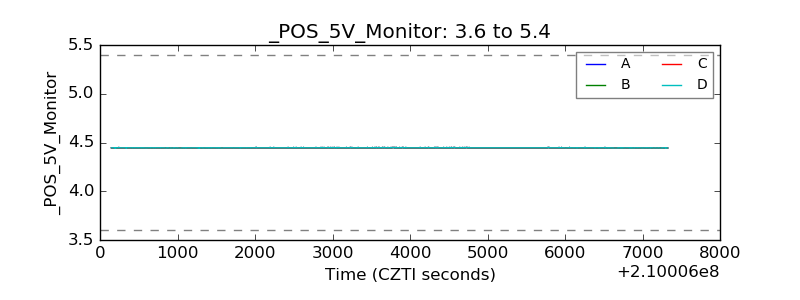 |
| _ROLL_ROT | 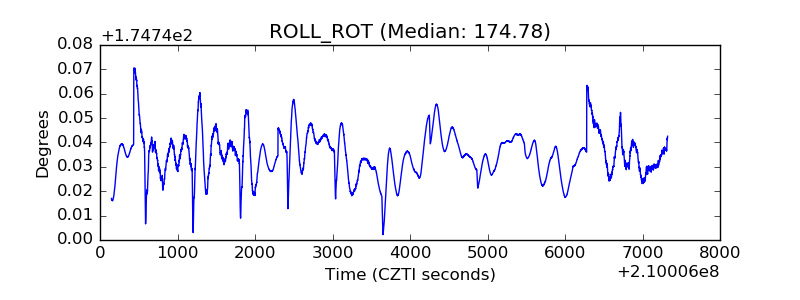 |
| _Roll_DEC | 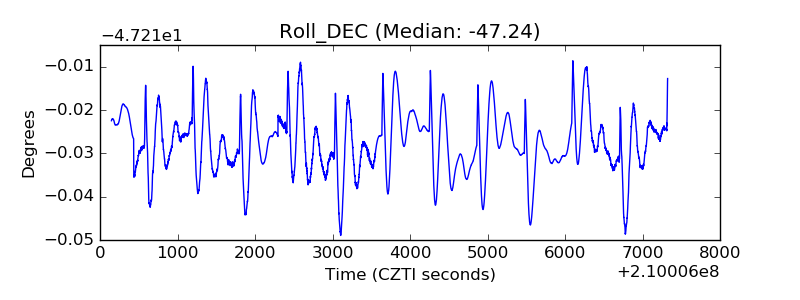 |
| _Roll_RA | 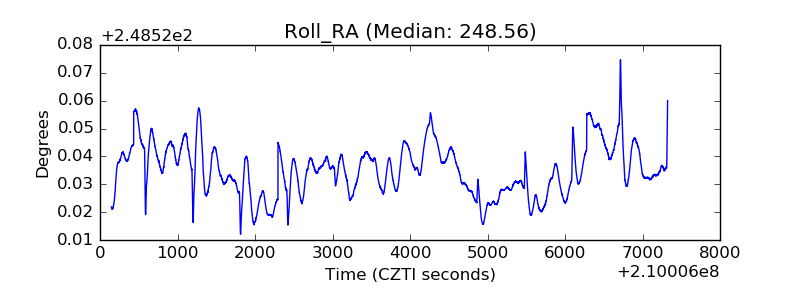 |
| Veto Counter | 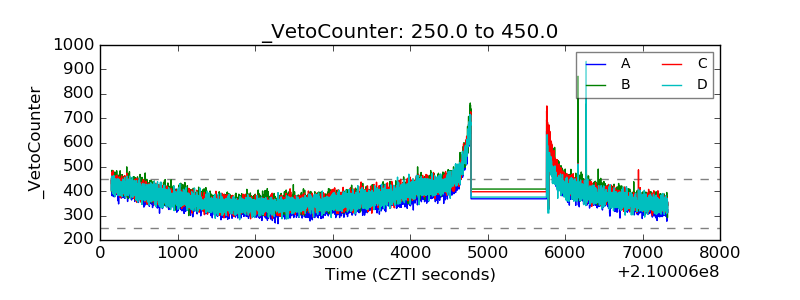 |