| Param | Original file | Final file |
|---|---|---|
| Filename | modeM0/AS1G05_157T01_9000000626_04953cztM0_level2.evt | modeM0/AS1G05_157T01_9000000626_04953cztM0_level2_quad_clean.evt |
| Size (bytes) | 599,063,040 | 83,419,200 |
| Size | 571.3 MB | 79.6 MB |
| Events in quadrant A | 5,883,610 | 456,826 |
| Events in quadrant B | 3,639,342 | 539,419 |
| Events in quadrant C | 3,050,274 | 543,760 |
| Events in quadrant D | 5,099,450 | 502,581 |
| Mode SS | |||
|---|---|---|---|
| Quadrant | BADHDUFLAG | Total packets | Discarded packets |
| A | 0 | 140 | 0 |
| B | 0 | 140 | 0 |
| C | 0 | 140 | 0 |
| D | 0 | 140 | 0 |
| Mode M0 | |||
|---|---|---|---|
| Quadrant | BADHDUFLAG | Total packets | Discarded packets |
| A | 0 | 22269 | 2 |
| B | 0 | 15528 | 1 |
| C | 0 | 14265 | 1 |
| D | 0 | 19933 | 1 |
| Mode M9 | |||
|---|---|---|---|
| Quadrant | BADHDUFLAG | Total packets | Discarded packets |
| A | 0 | 6 | 0 |
| B | 0 | 6 | 0 |
| C | 0 | 6 | 0 |
| D | 0 | 6 | 0 |
| Quadrant | Total seconds | Saturated seconds | Saturation percentage |
|---|---|---|---|
| A | 6933 | 1101 | 15.880571% |
| B | 6933 | 137 | 1.976057% |
| C | 6933 | 11 | 0.158661% |
| D | 6933 | 362 | 5.221405% |
Noise dominated data is calculated using 1-second bins in cleaned event files. If a bin has >2000 counts, and if more than 50% of those come from <1% of pixels, then it is considered to be noise-dominated and hence unusable.
| Quadrant | # 1 sec bins | Bins with >0 counts | Bins with >2000 counts | High rate bins dominated by noise | Noise dominated (total time) | Noise dominated (detector-on time) | Marked lightcurve |
|---|---|---|---|---|---|---|---|
| A | 7513 | 6934 | 1041 | 1041 | 13.86% | 15.01% | 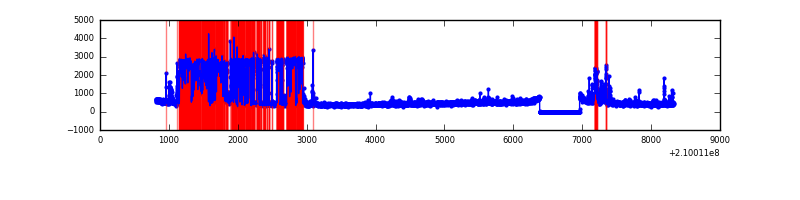 |
| B | 7513 | 6934 | 92 | 92 | 1.22% | 1.33% | 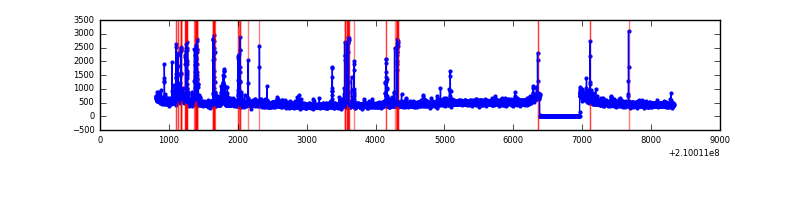 |
| C | 7513 | 6934 | 0 | 0 | 0.00% | 0.00% | 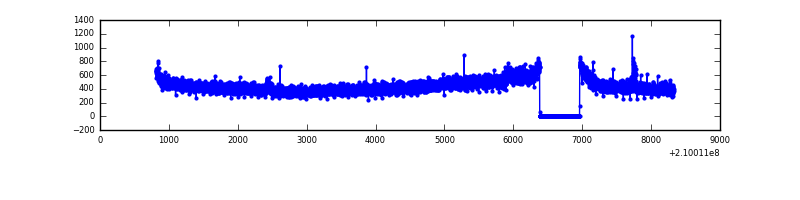 |
| D | 7513 | 6934 | 312 | 312 | 4.15% | 4.50% | 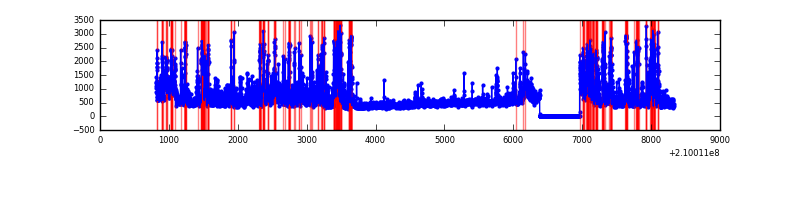 |
Top three noisy pixels from each quadrant. If the there are fewer than three noisy pixels in the level2.evt file, extra rows are filled as -1
| Pixel properties | Quadrant properties | ||||||
|---|---|---|---|---|---|---|---|
| Quadrant | DetID | PixID | Counts | Sigma | Mean | Median | Sigma |
| A | 0 | 31 | 2645304 | 18230.53 | 716 | 701 | 145.1 |
| A | 0 | 50 | 236942 | 1628.52 | 716 | 701 | 145.1 |
| A | 4 | 2 | 199511 | 1370.49 | 716 | 701 | 145.1 |
| B | 10 | 16 | 398853 | 2583.23 | 800 | 781 | 154.1 |
| B | 15 | 204 | 58896 | 377.13 | 800 | 781 | 154.1 |
| B | 8 | 3 | 18811 | 117.0 | 800 | 781 | 154.1 |
| C | 14 | 67 | 40867 | 224.75 | 768 | 771 | 178.4 |
| C | 12 | 4 | 10462 | 54.32 | 768 | 771 | 178.4 |
| C | 13 | 61 | 6324 | 31.13 | 768 | 771 | 178.4 |
| D | 2 | 33 | 796768 | 4313.82 | 752 | 731 | 184.5 |
| D | 1 | 7 | 380404 | 2057.49 | 752 | 731 | 184.5 |
| D | 13 | 235 | 371378 | 2008.58 | 752 | 731 | 184.5 |
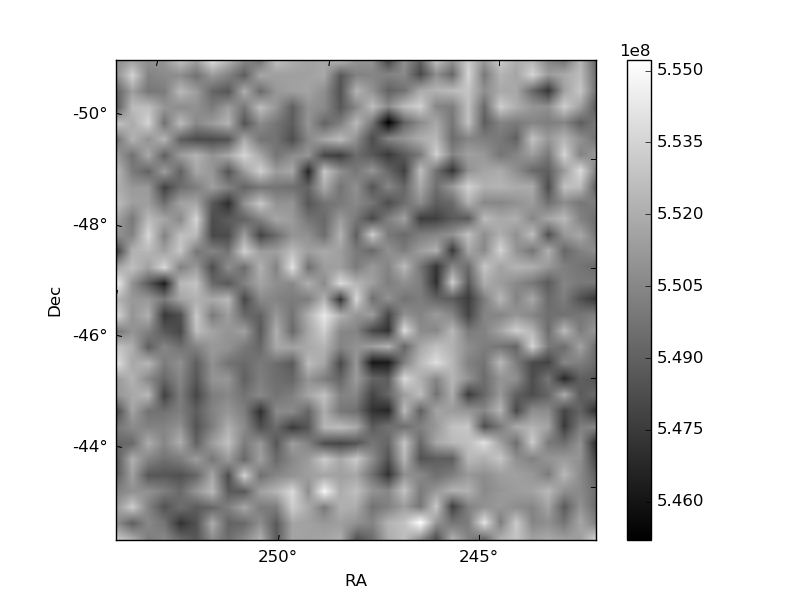
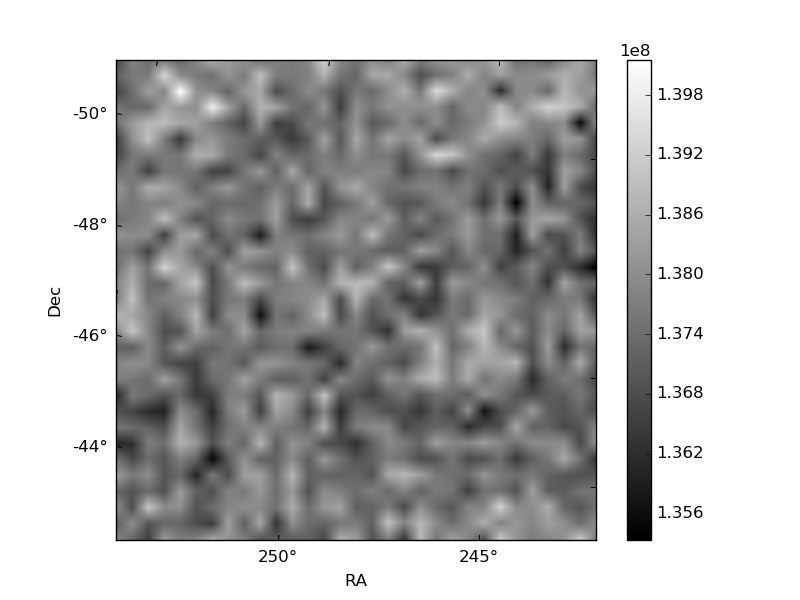
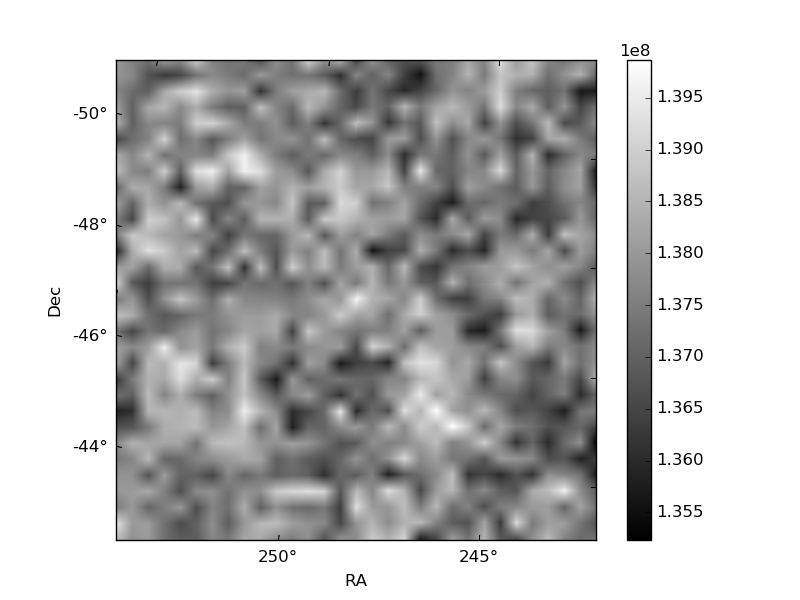
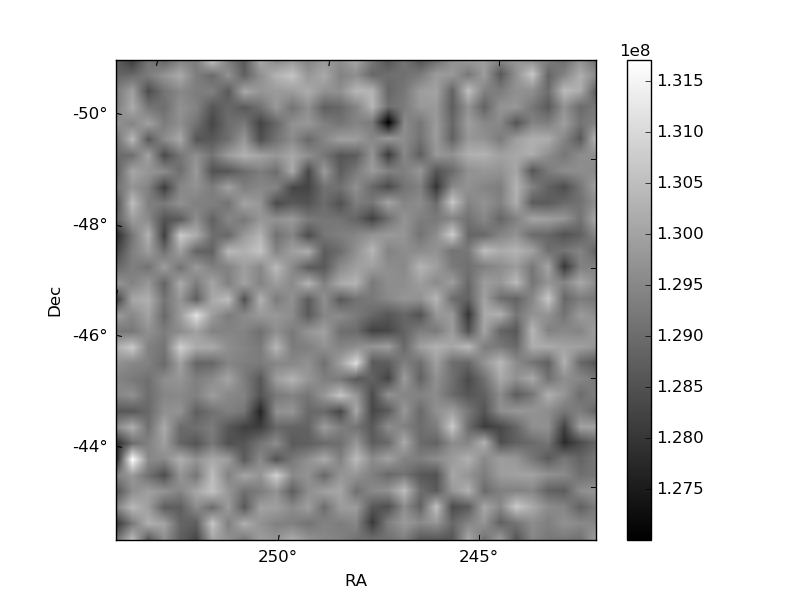
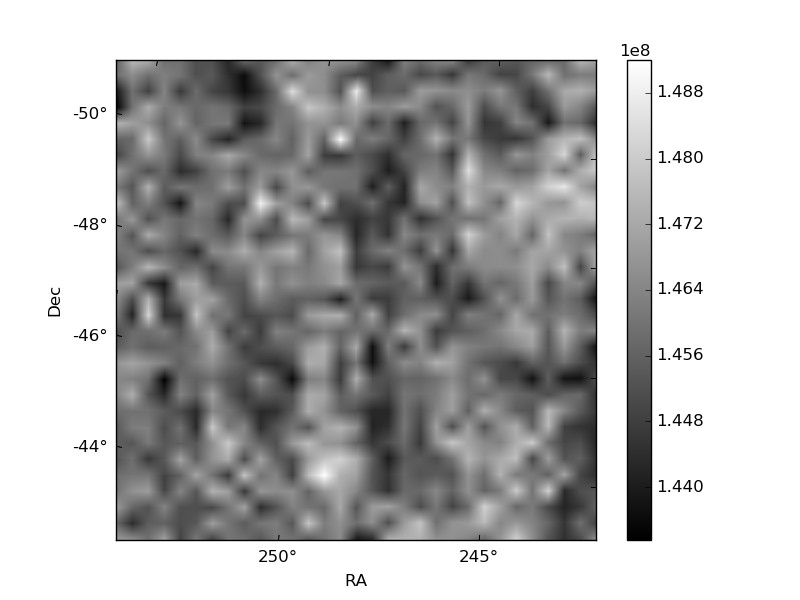
Histogram calculated using DETX and DETY for each event in the final _common_clean file
| Quadrant A | 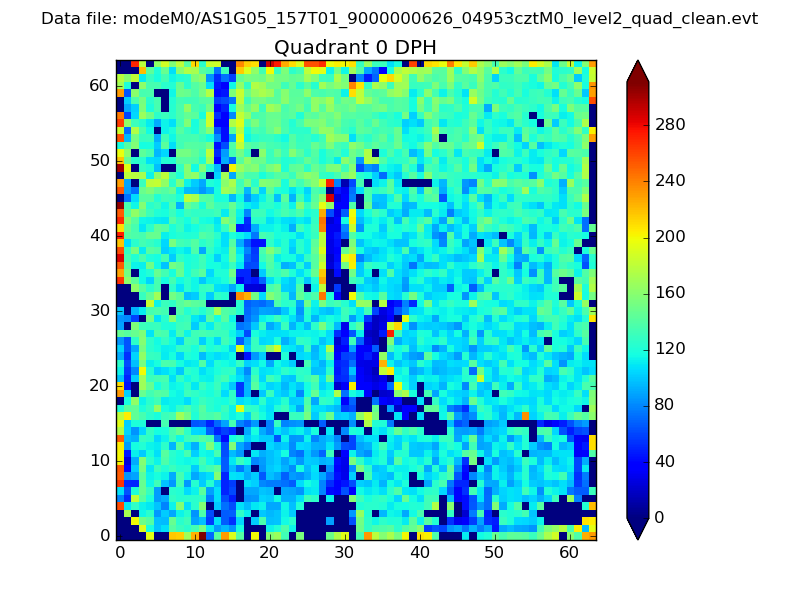 |
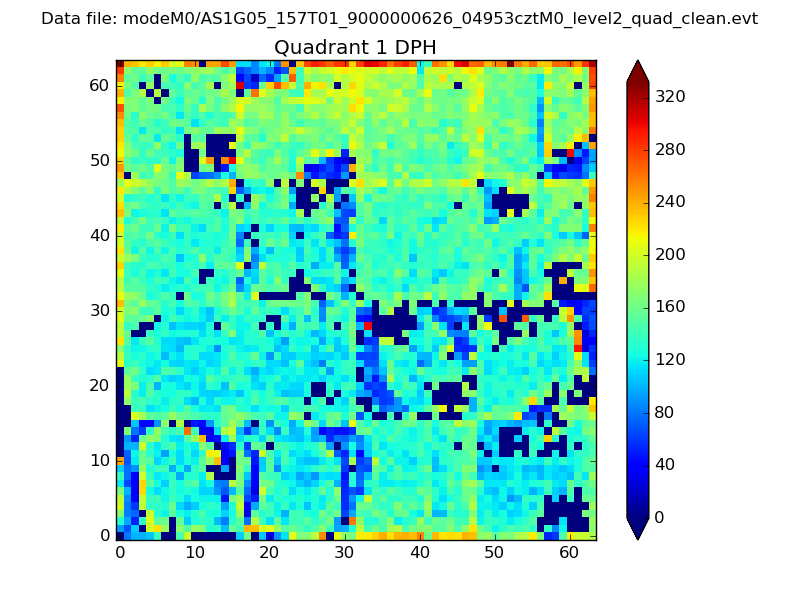 |
Quadrant B |
|---|---|---|---|
| Quadrant D | 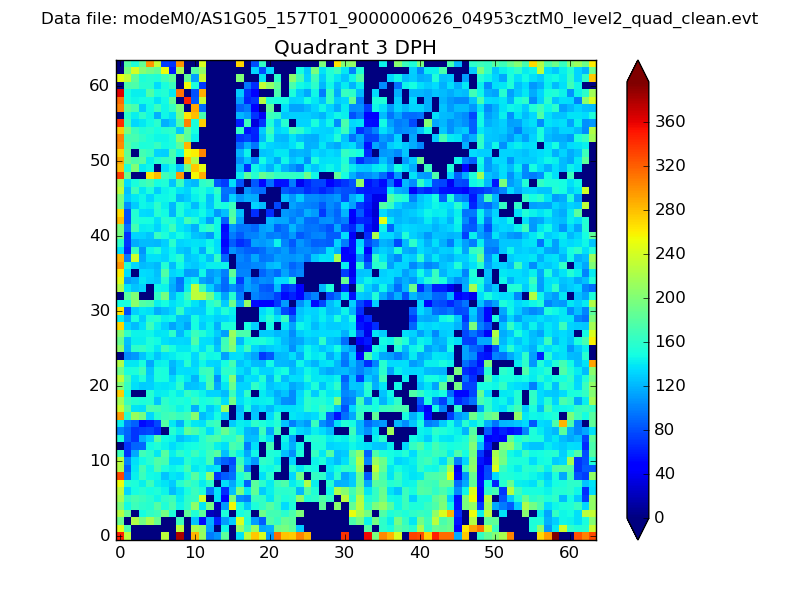 |
 |
Quadrant C |
| Plot type | Count rate plots | Images |
|---|---|---|
| Comparison with Poisson distribution Blue bars denote a histogram of data divided into 1 sec bins. Red curve is a Poisson curve with rate = median count rate of data. |
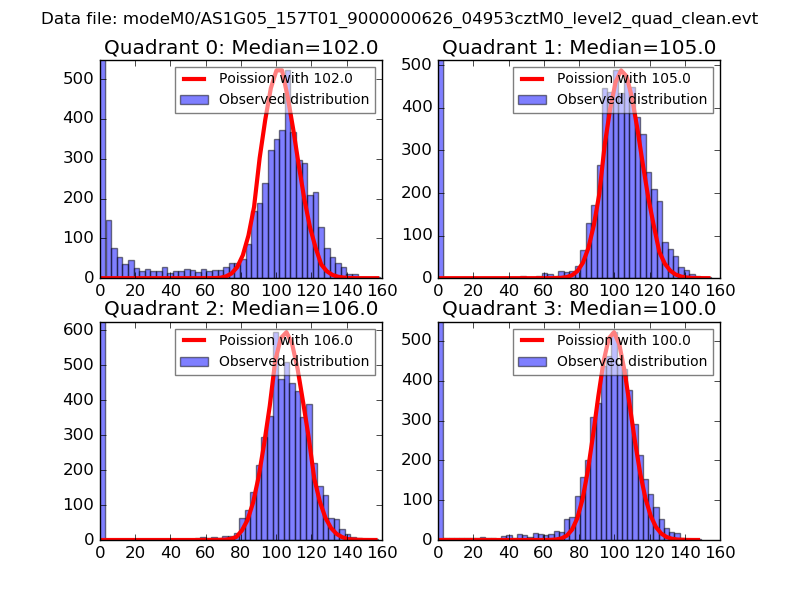 |
 |
| Quadrant-wise count rates Data is divided into 100 sec bins |
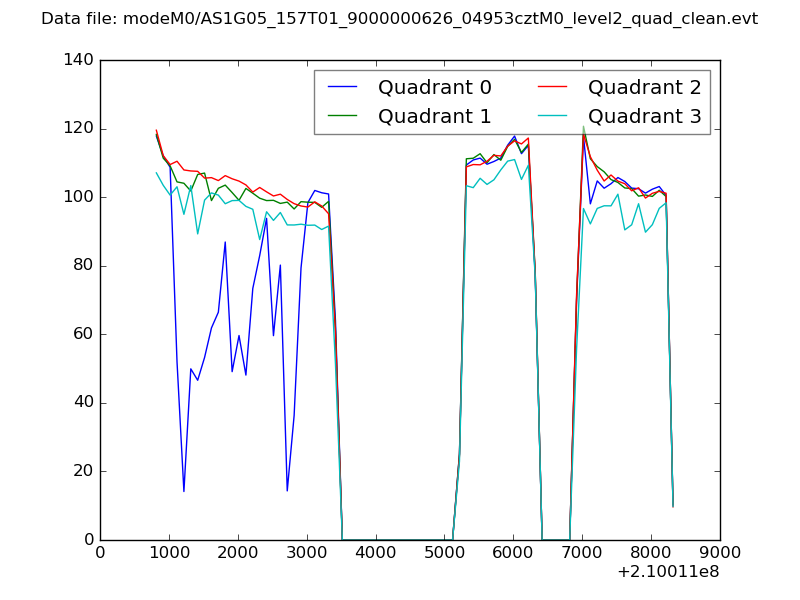 |
|
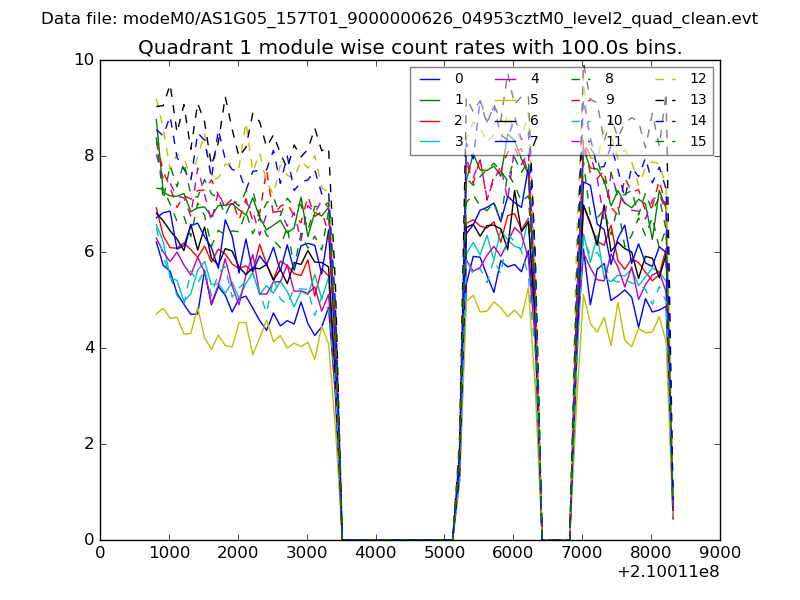
| Module-wise count rates for Quadrant A Data is divided into 100 sec bins |
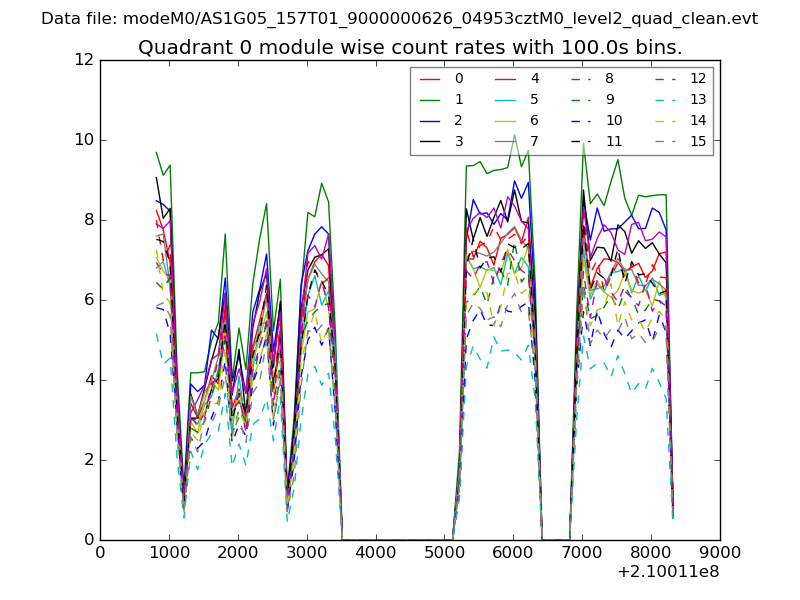 |
 |
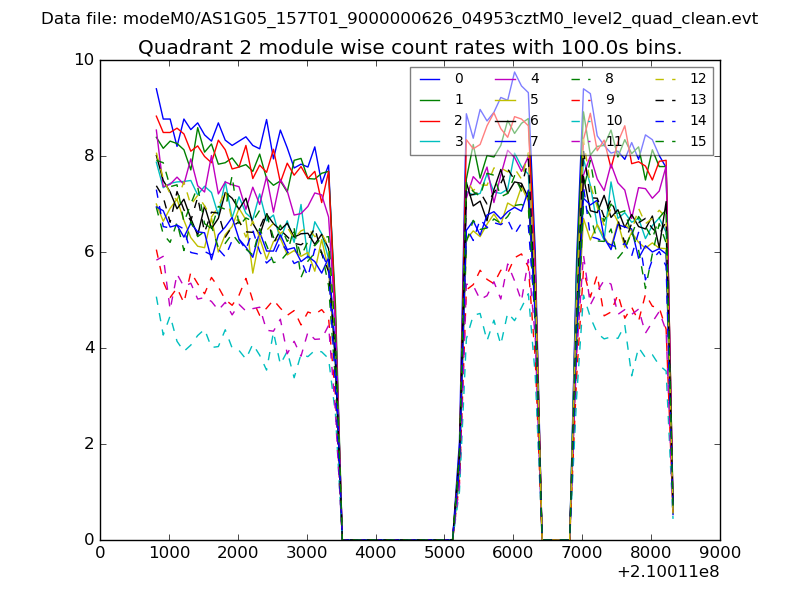
| Module-wise count rates for Quadrant B Data is divided into 100 sec bins |
 |
 |
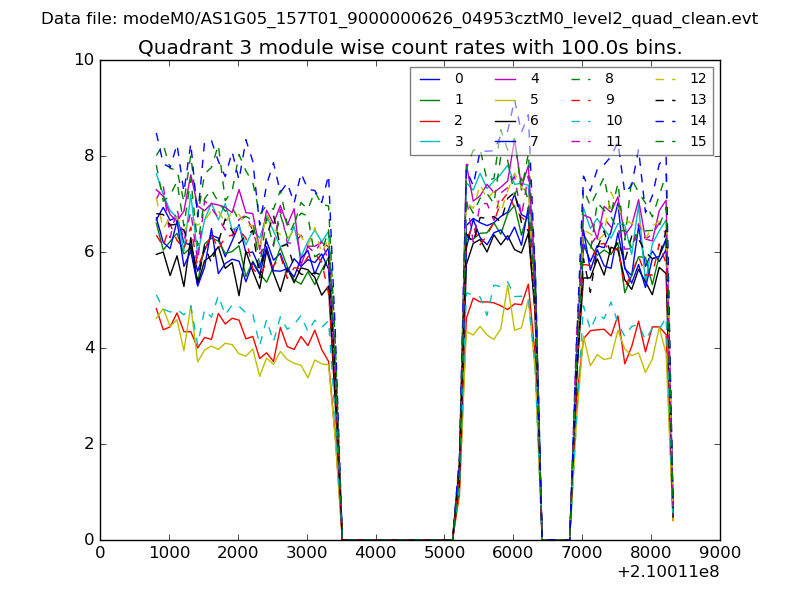
| Module-wise count rates for Quadrant C Data is divided into 100 sec bins |
 |
 |
| Module-wise count rates for Quadrant D Data is divided into 100 sec bins |
 |
 |
| Parameter | Plot |
|---|---|
| CZT HV Monitor | 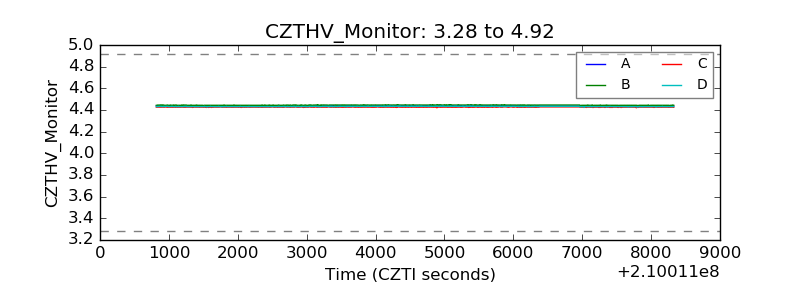 |
| D_VDD | 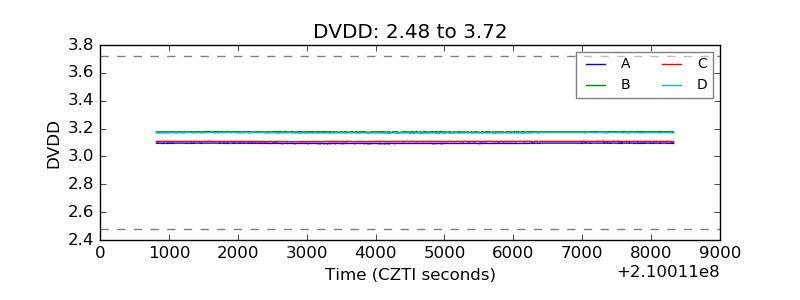 |
| Temperature 1 | 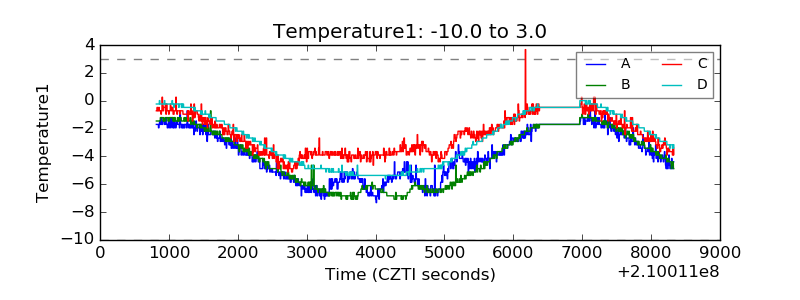 |
| Veto HV Monitor | 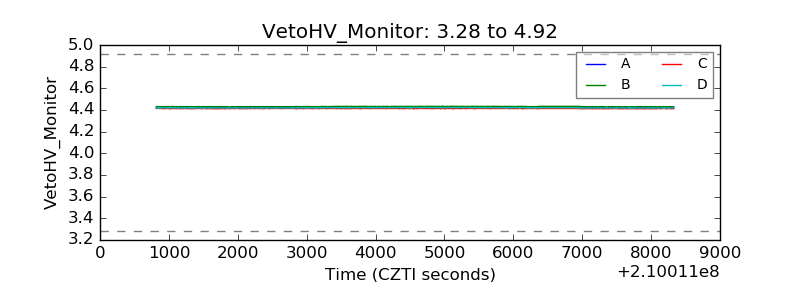 |
| Veto LLD | 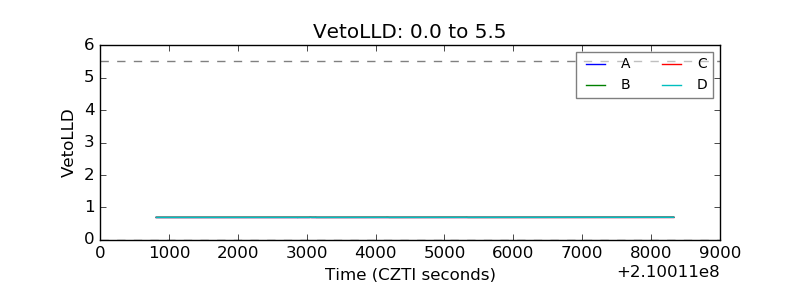 |
| Alpha Counter | 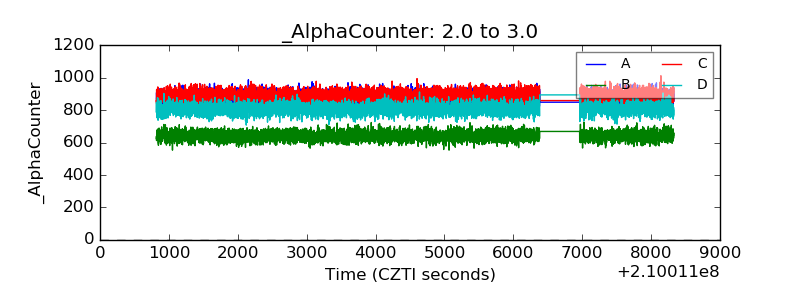 |
| _CPM_Rate | 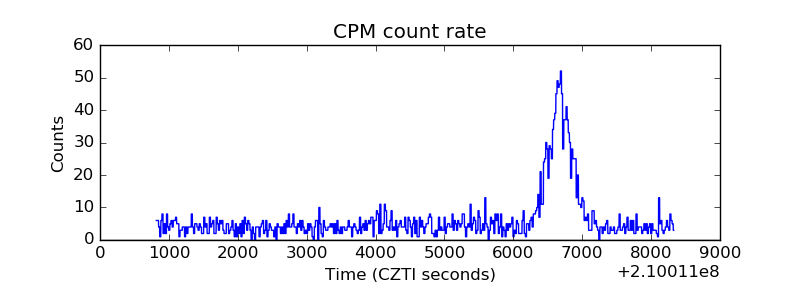 |
| CZT Counter |  |
| +2.5 Volts monitor |  |
| +5 Volts monitor | 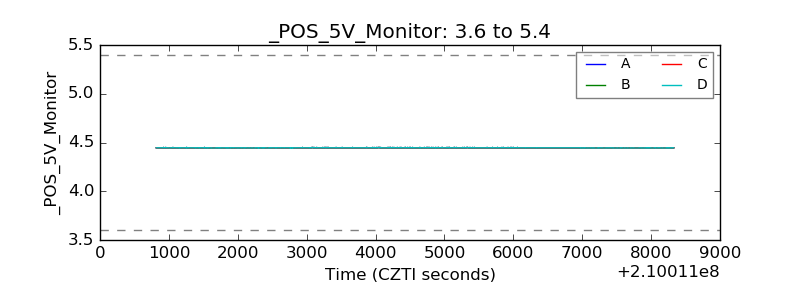 |
| _ROLL_ROT | 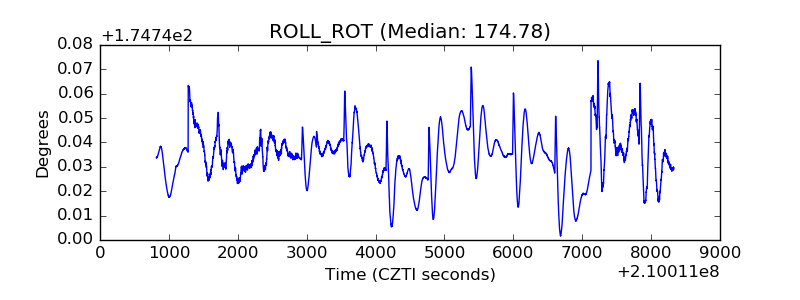 |
| _Roll_DEC | 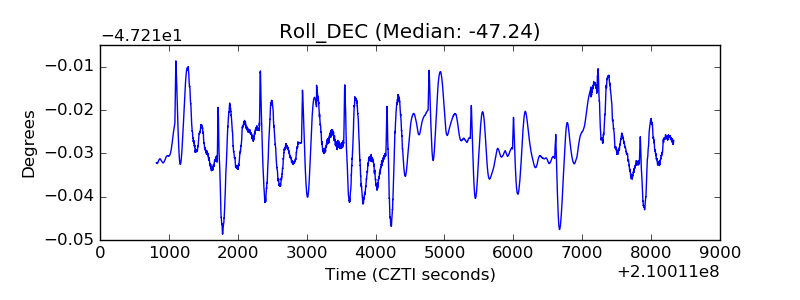 |
| _Roll_RA |  |
| Veto Counter | 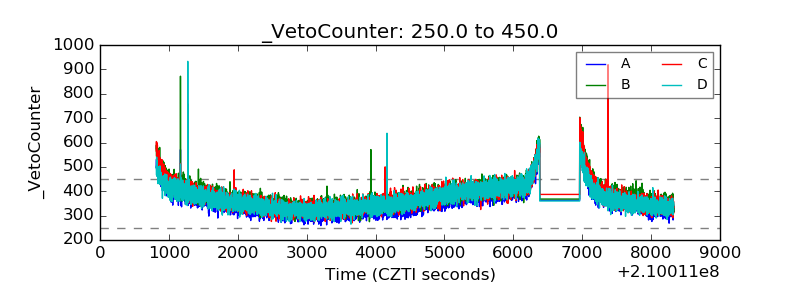 |