| Param | Original file | Final file |
|---|---|---|
| Filename | modeM0/AS1G05_157T01_9000000626_04954cztM0_level2.evt | modeM0/AS1G05_157T01_9000000626_04954cztM0_level2_quad_clean.evt |
| Size (bytes) | 573,428,160 | 93,372,480 |
| Size | 546.9 MB | 89.0 MB |
| Events in quadrant A | 4,032,948 | 589,477 |
| Events in quadrant B | 4,256,581 | 578,698 |
| Events in quadrant C | 3,221,708 | 593,249 |
| Events in quadrant D | 5,349,339 | 547,205 |
| Mode SS | |||
|---|---|---|---|
| Quadrant | BADHDUFLAG | Total packets | Discarded packets |
| A | 0 | 152 | 0 |
| B | 0 | 152 | 0 |
| C | 0 | 152 | 0 |
| D | 0 | 152 | 0 |
| Mode M0 | |||
|---|---|---|---|
| Quadrant | BADHDUFLAG | Total packets | Discarded packets |
| A | 0 | 17084 | 2 |
| B | 0 | 17751 | 1 |
| C | 0 | 15169 | 1 |
| D | 0 | 21039 | 1 |
| Mode M9 | |||
|---|---|---|---|
| Quadrant | BADHDUFLAG | Total packets | Discarded packets |
| A | 0 | 2 | 0 |
| B | 0 | 2 | 0 |
| C | 0 | 2 | 0 |
| D | 0 | 2 | 0 |
| Quadrant | Total seconds | Saturated seconds | Saturation percentage |
|---|---|---|---|
| A | 7457 | 108 | 1.448304% |
| B | 7457 | 313 | 4.197398% |
| C | 7457 | 15 | 0.201153% |
| D | 7457 | 494 | 6.624648% |
Noise dominated data is calculated using 1-second bins in cleaned event files. If a bin has >2000 counts, and if more than 50% of those come from <1% of pixels, then it is considered to be noise-dominated and hence unusable.
| Quadrant | # 1 sec bins | Bins with >0 counts | Bins with >2000 counts | High rate bins dominated by noise | Noise dominated (total time) | Noise dominated (detector-on time) | Marked lightcurve |
|---|---|---|---|---|---|---|---|
| A | 7622 | 7459 | 58 | 58 | 0.76% | 0.78% | 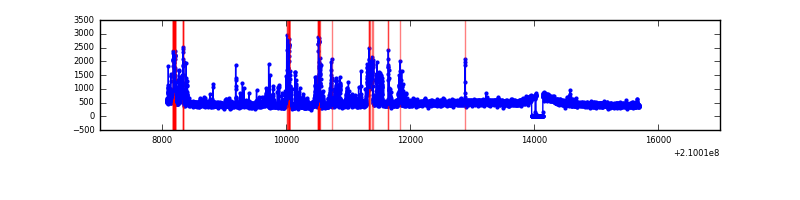 |
| B | 7622 | 7458 | 166 | 166 | 2.18% | 2.23% | 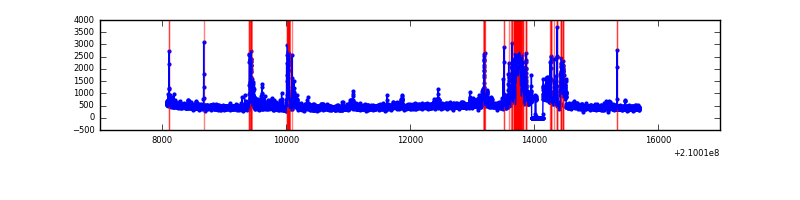 |
| C | 7622 | 7459 | 0 | 0 | 0.00% | 0.00% |  |
| D | 7621 | 7458 | 414 | 414 | 5.43% | 5.55% | 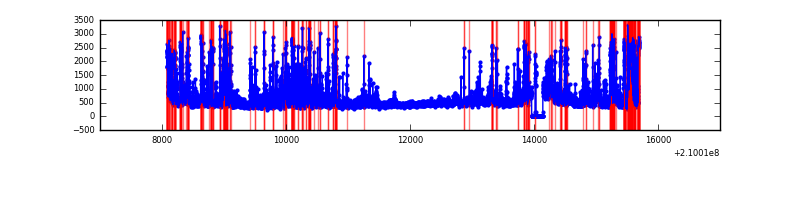 |
Top three noisy pixels from each quadrant. If the there are fewer than three noisy pixels in the level2.evt file, extra rows are filled as -1
| Pixel properties | Quadrant properties | ||||||
|---|---|---|---|---|---|---|---|
| Quadrant | DetID | PixID | Counts | Sigma | Mean | Median | Sigma |
| A | 13 | 251 | 549592 | 3125.66 | 851 | 832 | 175.6 |
| A | 0 | 50 | 175948 | 997.44 | 851 | 832 | 175.6 |
| A | 8 | 15 | 10047 | 52.49 | 851 | 832 | 175.6 |
| B | 10 | 16 | 440516 | 2693.78 | 849 | 829 | 163.2 |
| B | 8 | 3 | 368661 | 2253.56 | 849 | 829 | 163.2 |
| B | 5 | 6 | 61813 | 373.62 | 849 | 829 | 163.2 |
| C | 12 | 4 | 13416 | 65.71 | 821 | 823 | 191.6 |
| C | 13 | 61 | 6708 | 30.71 | 821 | 823 | 191.6 |
| C | 14 | 67 | 5554 | 24.69 | 821 | 823 | 191.6 |
| D | 2 | 33 | 968876 | 4863.91 | 800 | 773 | 199.0 |
| D | 13 | 235 | 654976 | 3286.83 | 800 | 773 | 199.0 |
| D | 2 | 136 | 256440 | 1284.51 | 800 | 773 | 199.0 |
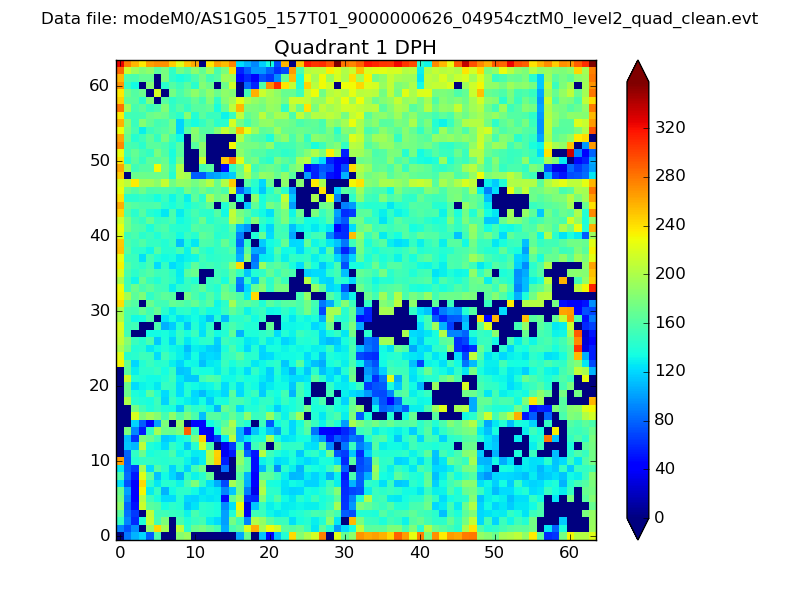
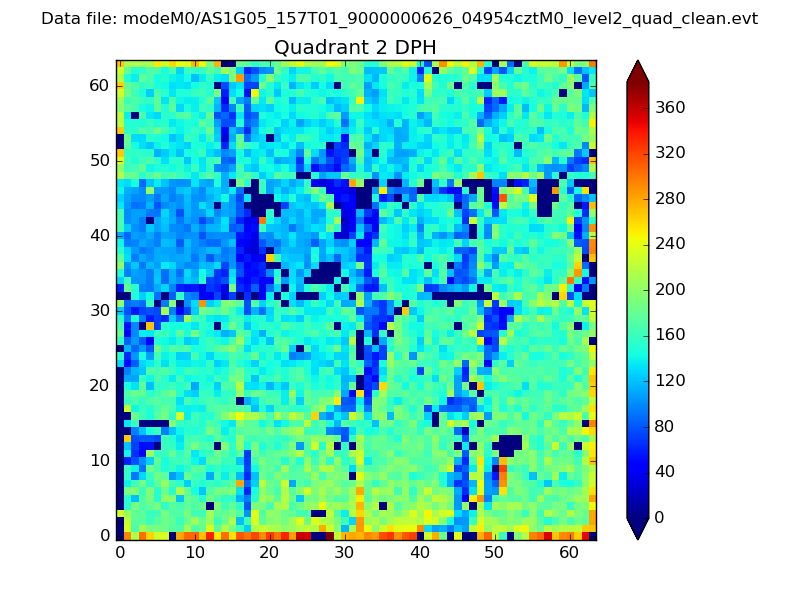
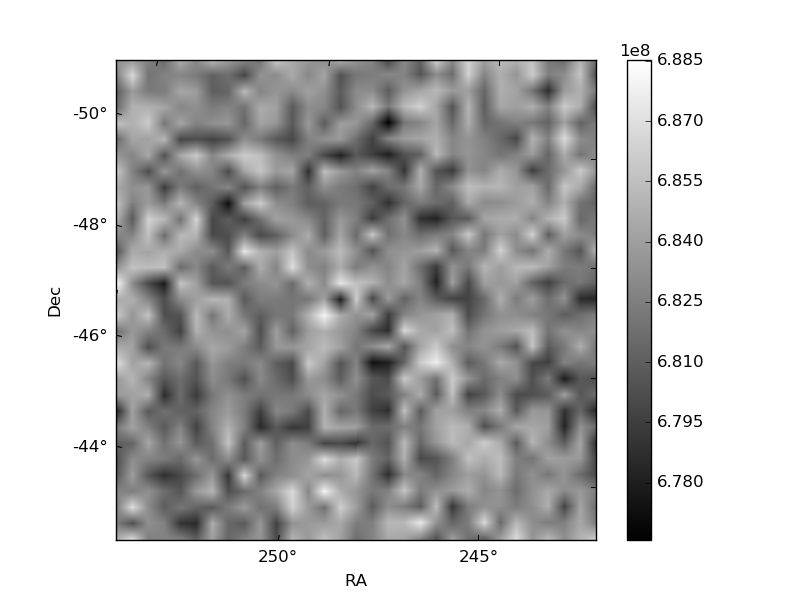
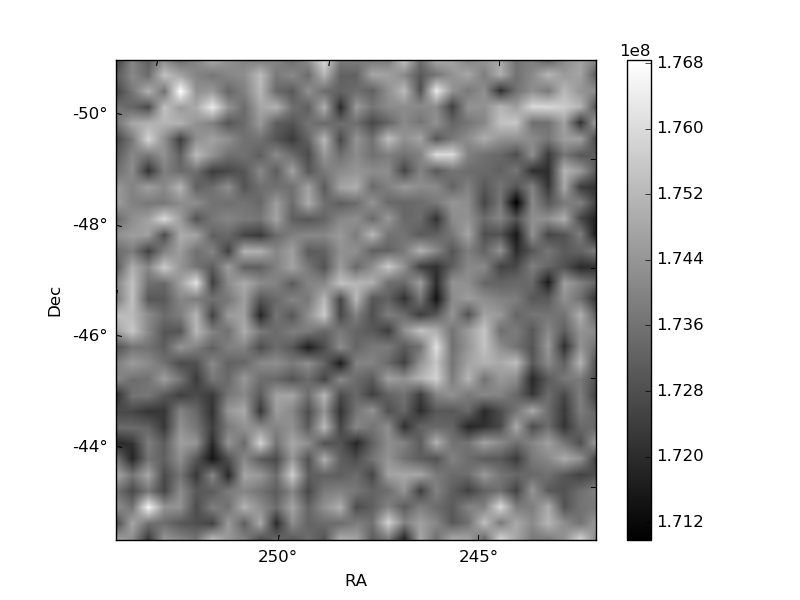
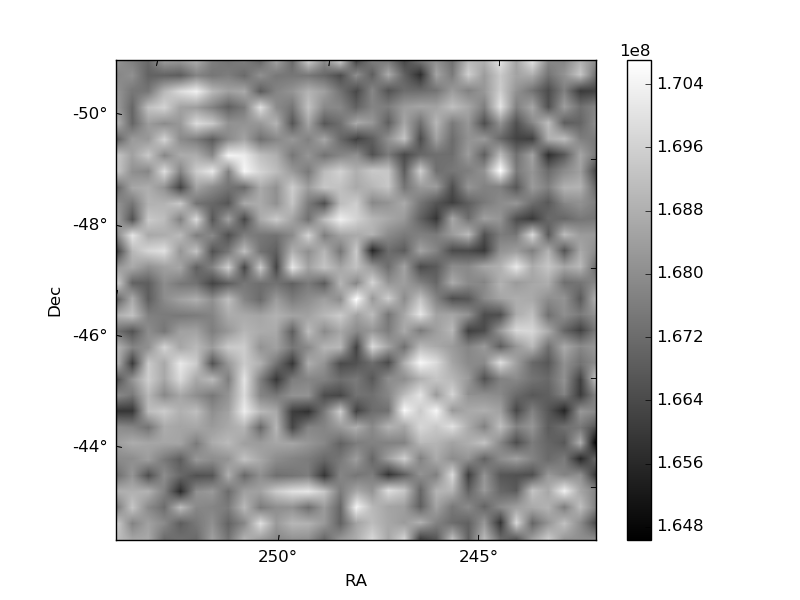
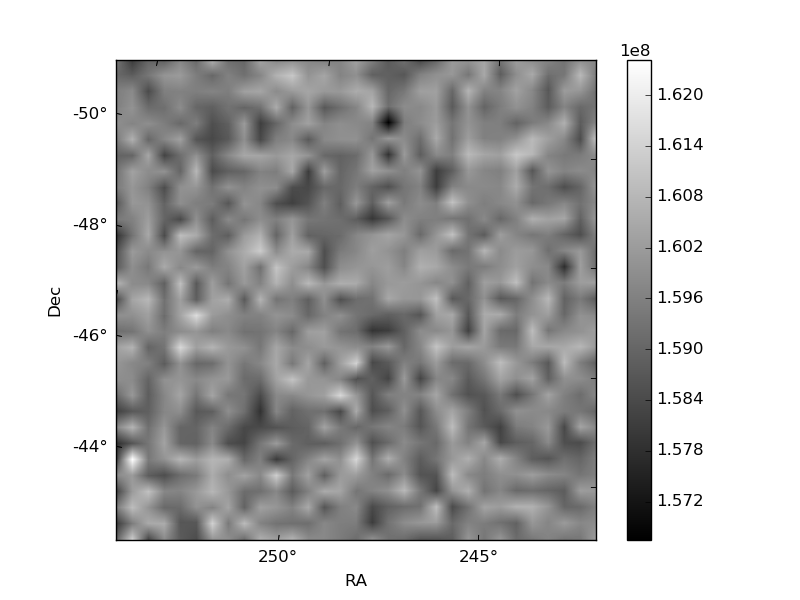
Histogram calculated using DETX and DETY for each event in the final _common_clean file
| Quadrant A | 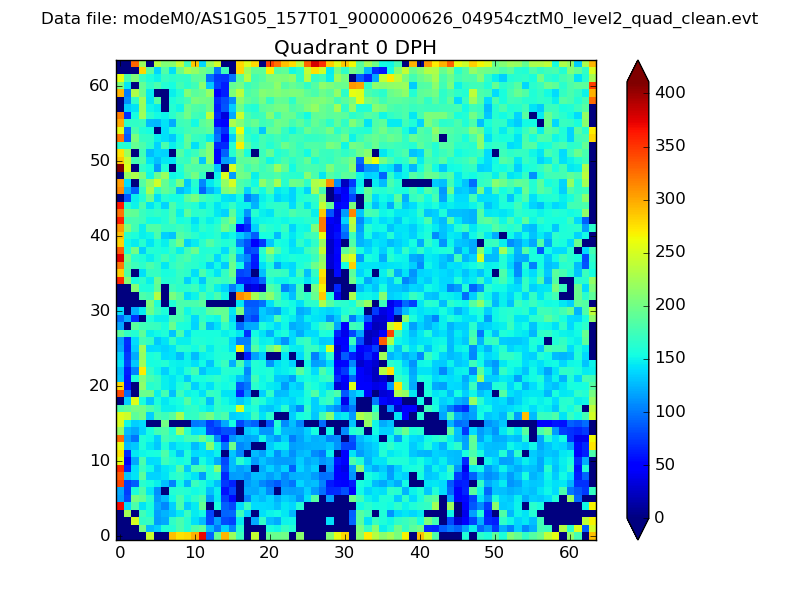 |
 |
Quadrant B |
|---|---|---|---|
| Quadrant D | 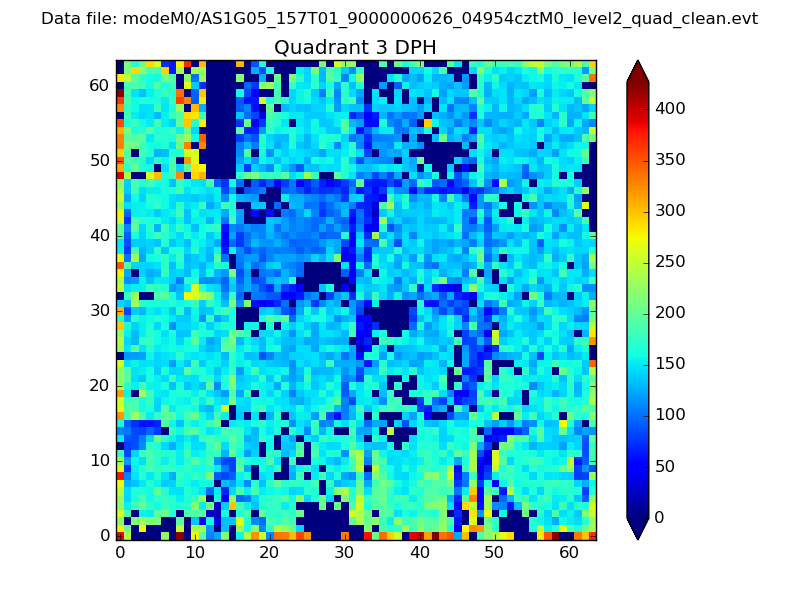 |
 |
Quadrant C |
| Plot type | Count rate plots | Images |
|---|---|---|
| Comparison with Poisson distribution Blue bars denote a histogram of data divided into 1 sec bins. Red curve is a Poisson curve with rate = median count rate of data. |
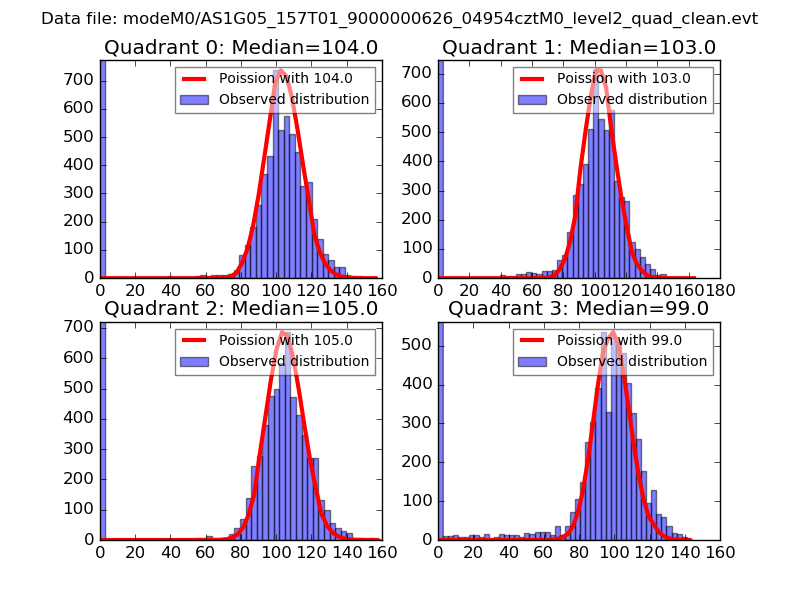 |
 |
| Quadrant-wise count rates Data is divided into 100 sec bins |
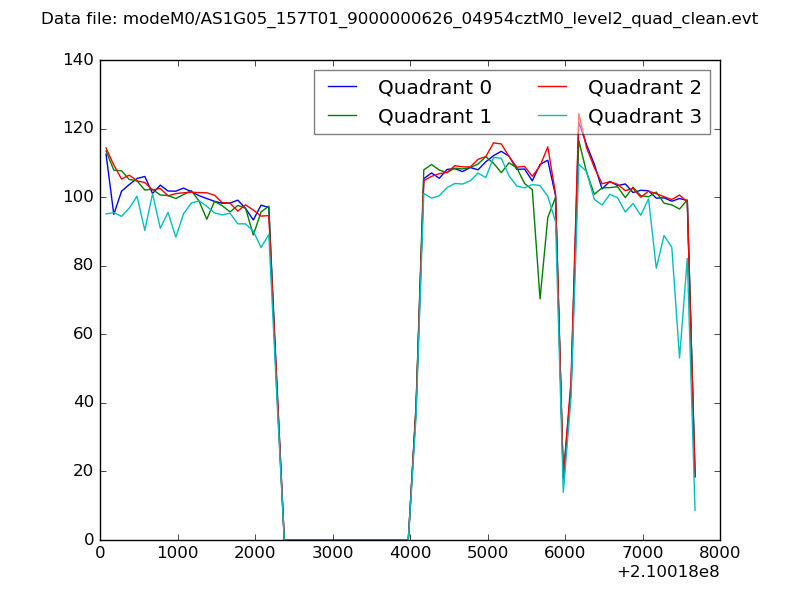 |
|
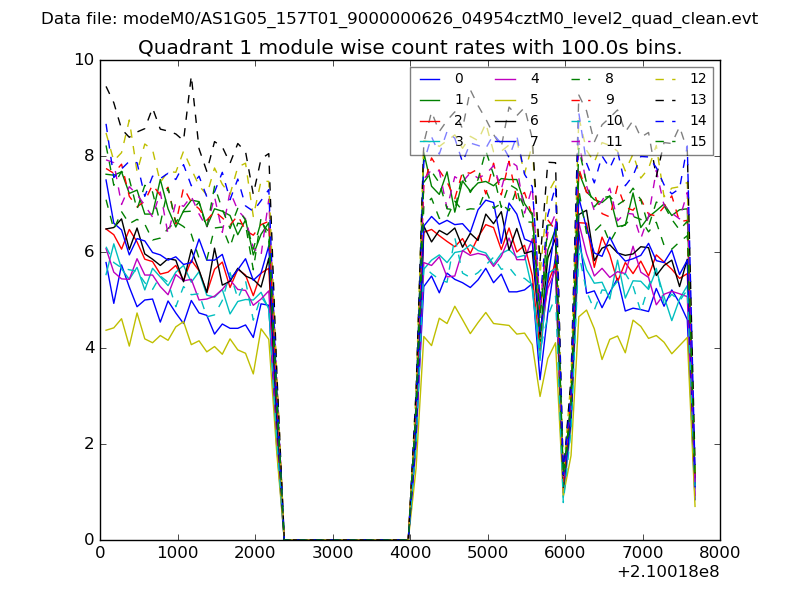
| Module-wise count rates for Quadrant A Data is divided into 100 sec bins |
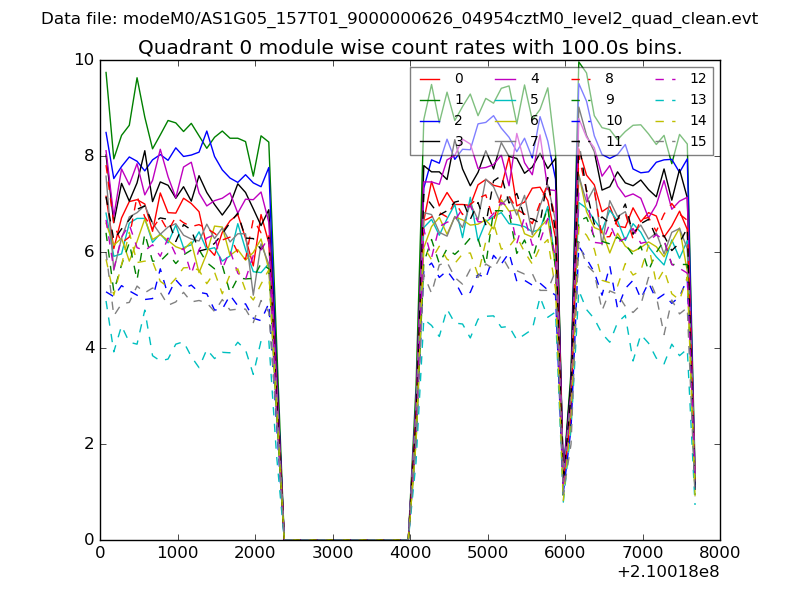 |
 |
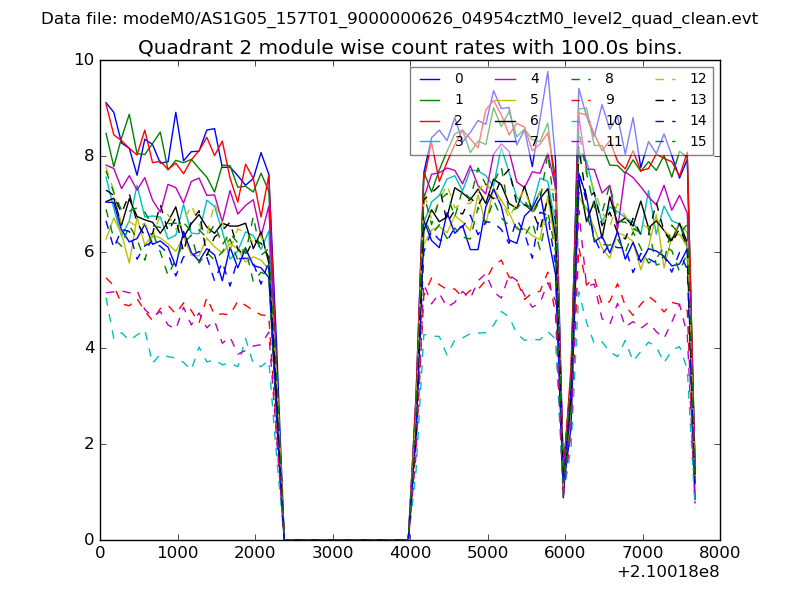
| Module-wise count rates for Quadrant B Data is divided into 100 sec bins |
 |
 |
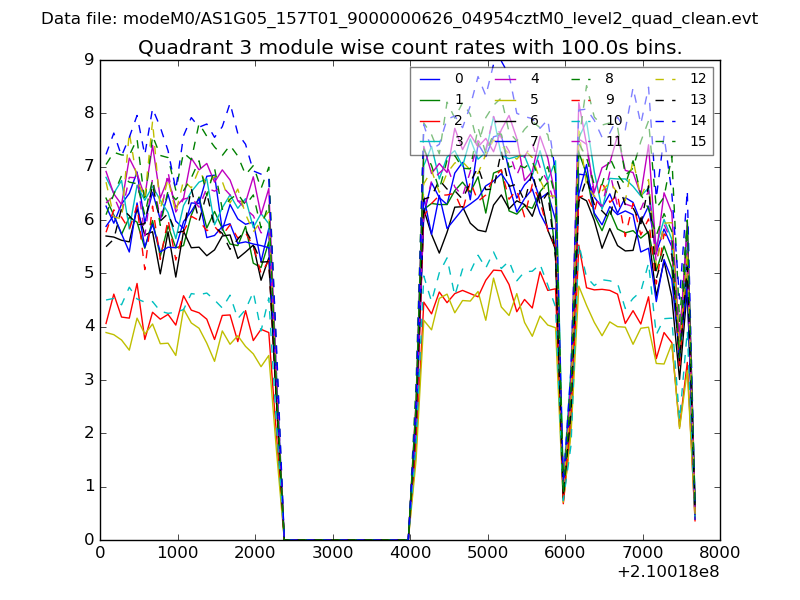
| Module-wise count rates for Quadrant C Data is divided into 100 sec bins |
 |
 |
| Module-wise count rates for Quadrant D Data is divided into 100 sec bins |
 |
 |
| Parameter | Plot |
|---|---|
| CZT HV Monitor | 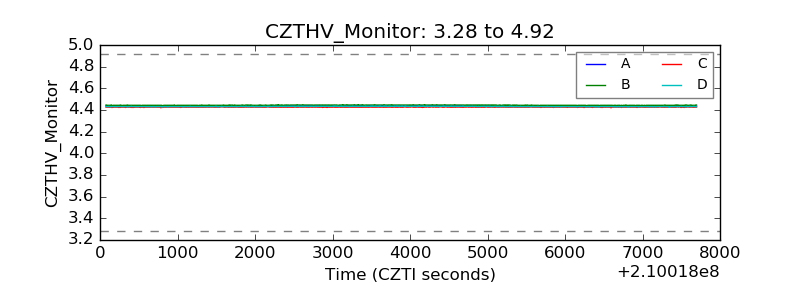 |
| D_VDD | 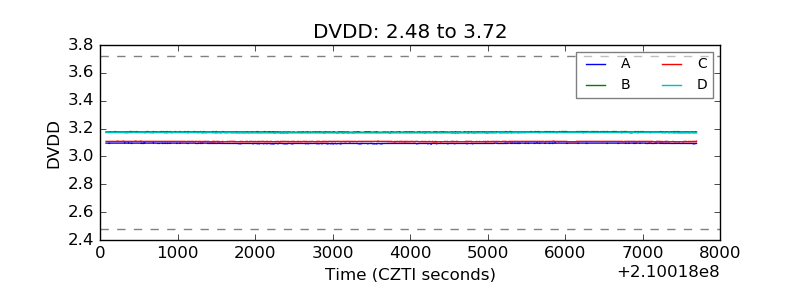 |
| Temperature 1 | 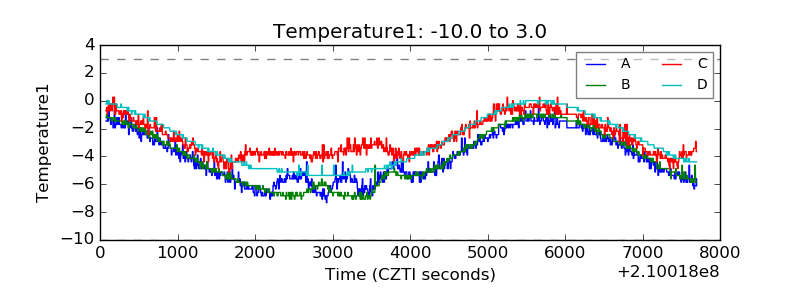 |
| Veto HV Monitor | 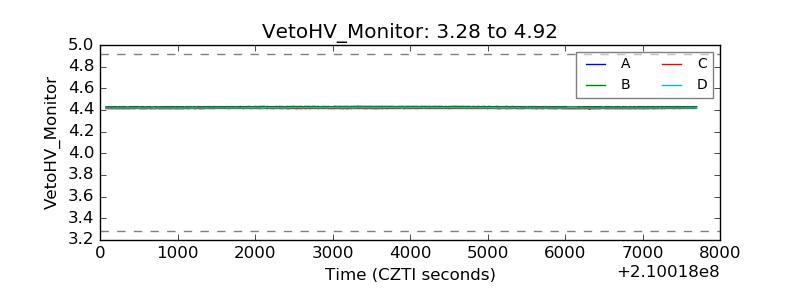 |
| Veto LLD | 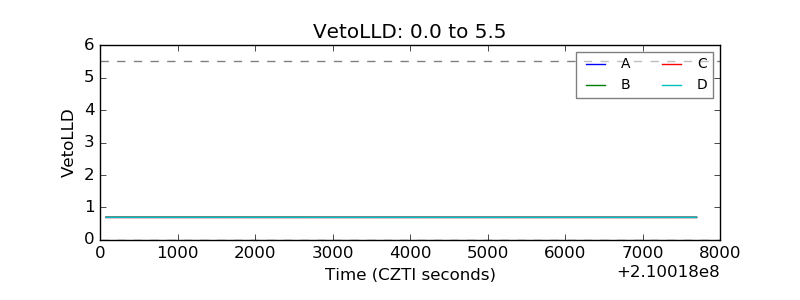 |
| Alpha Counter | 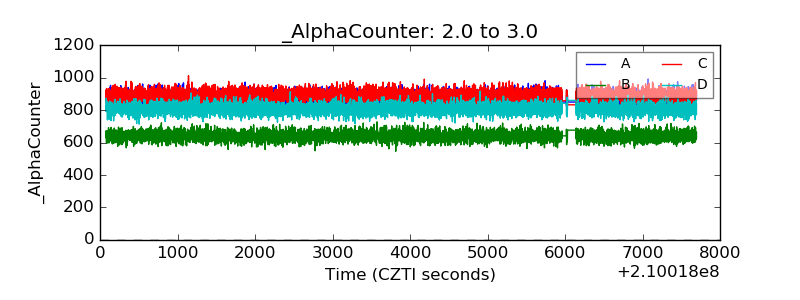 |
| _CPM_Rate | 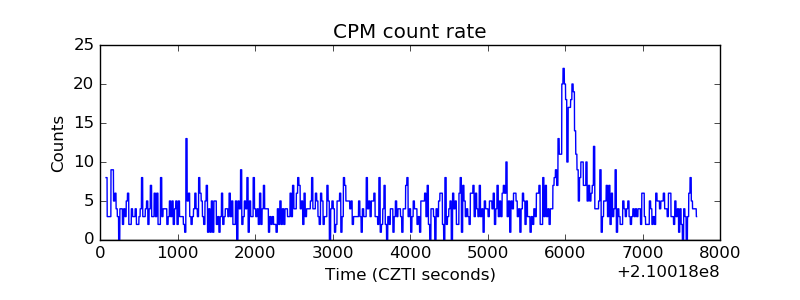 |
| CZT Counter | 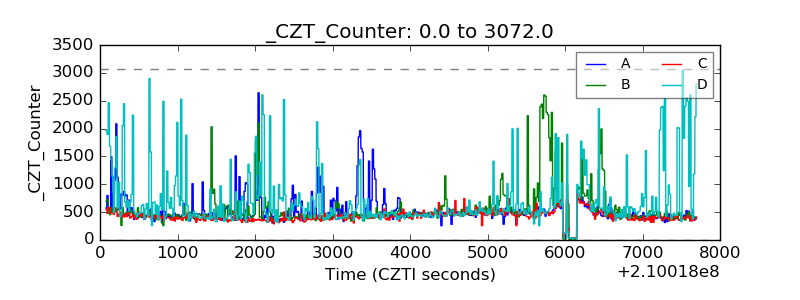 |
| +2.5 Volts monitor |  |
| +5 Volts monitor |  |
| _ROLL_ROT | 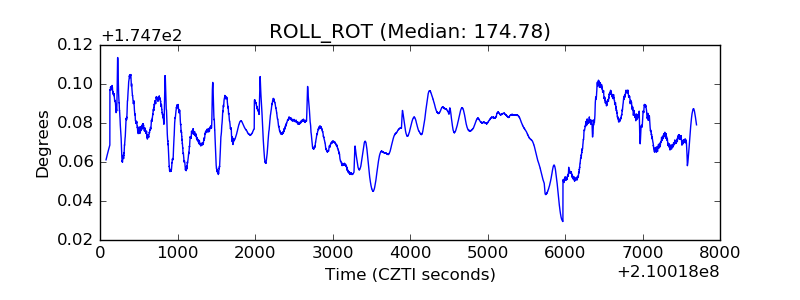 |
| _Roll_DEC | 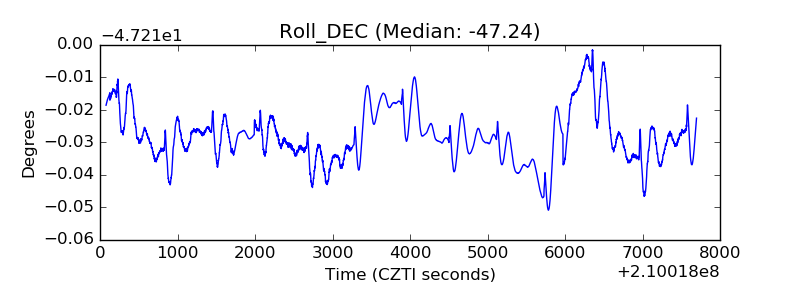 |
| _Roll_RA | 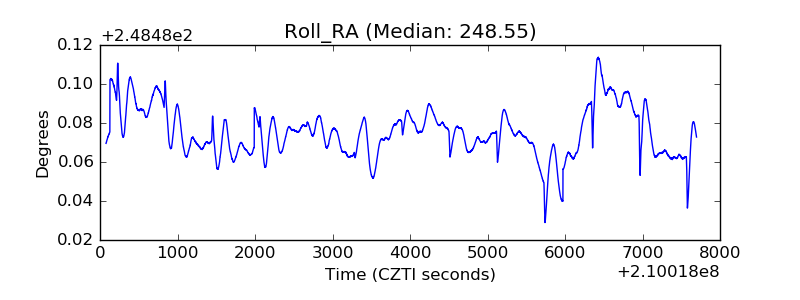 |
| Veto Counter | 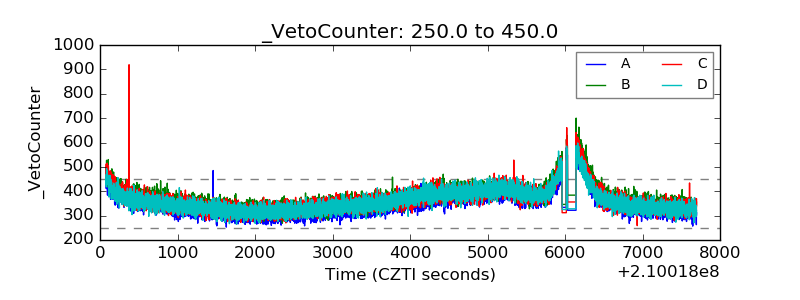 |