| Param | Original file | Final file |
|---|---|---|
| Filename | modeM0/AS1G05_157T01_9000000626_04955cztM0_level2.evt | modeM0/AS1G05_157T01_9000000626_04955cztM0_level2_quad_clean.evt |
| Size (bytes) | 637,943,040 | 103,913,280 |
| Size | 608.4 MB | 99.1 MB |
| Events in quadrant A | 4,128,538 | 663,295 |
| Events in quadrant B | 4,511,620 | 647,735 |
| Events in quadrant C | 3,601,529 | 661,857 |
| Events in quadrant D | 6,522,746 | 604,169 |
| Mode SS | |||
|---|---|---|---|
| Quadrant | BADHDUFLAG | Total packets | Discarded packets |
| A | 0 | 170 | 0 |
| B | 0 | 170 | 0 |
| C | 0 | 170 | 0 |
| D | 0 | 170 | 0 |
| Mode M0 | |||
|---|---|---|---|
| Quadrant | BADHDUFLAG | Total packets | Discarded packets |
| A | 0 | 18085 | 3 |
| B | 0 | 19078 | 10 |
| C | 0 | 16856 | 2 |
| D | 0 | 25187 | 2 |
| Mode M9 | |||
|---|---|---|---|
| Quadrant | BADHDUFLAG | Total packets | Discarded packets |
| A | 0 | 4 | 0 |
| B | 0 | 4 | 0 |
| C | 0 | 4 | 0 |
| D | 0 | 4 | 0 |
| Quadrant | Total seconds | Saturated seconds | Saturation percentage |
|---|---|---|---|
| A | 8195 | 189 | 2.306284% |
| B | 8194 | 365 | 4.454479% |
| C | 8195 | 41 | 0.500305% |
| D | 8195 | 817 | 9.969494% |
Noise dominated data is calculated using 1-second bins in cleaned event files. If a bin has >2000 counts, and if more than 50% of those come from <1% of pixels, then it is considered to be noise-dominated and hence unusable.
| Quadrant | # 1 sec bins | Bins with >0 counts | Bins with >2000 counts | High rate bins dominated by noise | Noise dominated (total time) | Noise dominated (detector-on time) | Marked lightcurve |
|---|---|---|---|---|---|---|---|
| A | 8540 | 8197 | 85 | 85 | 1.00% | 1.04% | 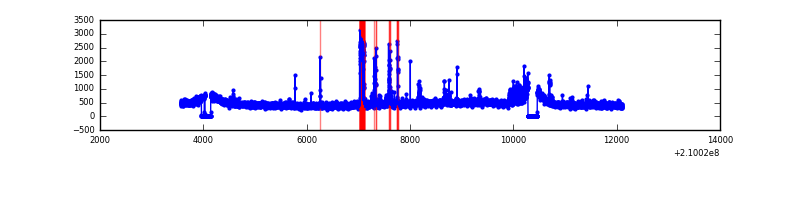 |
| B | 8540 | 8195 | 133 | 133 | 1.56% | 1.62% | 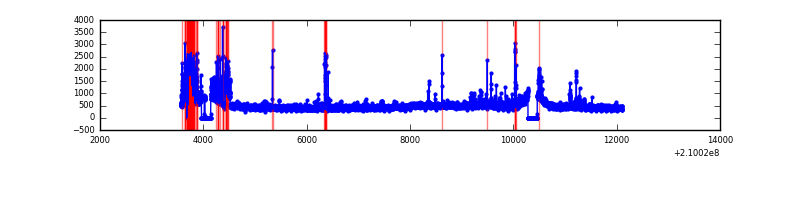 |
| C | 8540 | 8198 | 0 | 0 | 0.00% | 0.00% | 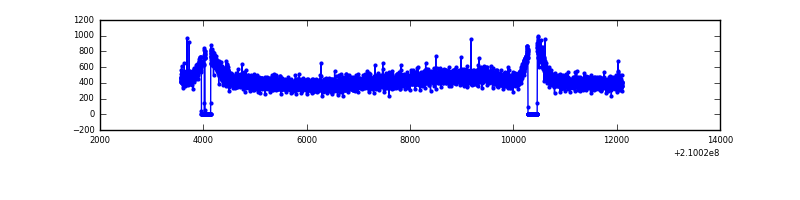 |
| D | 8540 | 8198 | 658 | 658 | 7.70% | 8.03% | 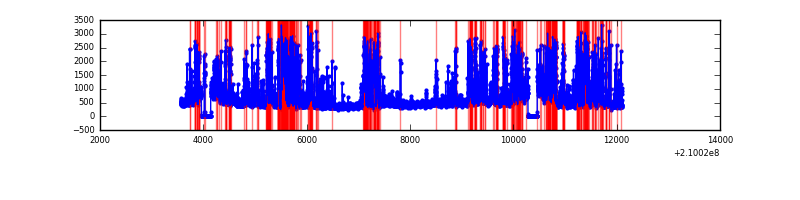 |
Top three noisy pixels from each quadrant. If the there are fewer than three noisy pixels in the level2.evt file, extra rows are filled as -1
| Pixel properties | Quadrant properties | ||||||
|---|---|---|---|---|---|---|---|
| Quadrant | DetID | PixID | Counts | Sigma | Mean | Median | Sigma |
| A | 0 | 50 | 240686 | 1240.25 | 947 | 924 | 193.3 |
| A | 0 | 31 | 161329 | 829.75 | 947 | 924 | 193.3 |
| A | 15 | 174 | 32333 | 162.47 | 947 | 924 | 193.3 |
| B | 8 | 3 | 336385 | 1833.01 | 948 | 924 | 183.0 |
| B | 10 | 16 | 312390 | 1701.89 | 948 | 924 | 183.0 |
| B | 15 | 204 | 52824 | 283.59 | 948 | 924 | 183.0 |
| C | 13 | 61 | 7538 | 31.17 | 916 | 919 | 212.4 |
| C | 8 | 128 | 5634 | 22.2 | 916 | 919 | 212.4 |
| C | 14 | 67 | 5596 | 22.02 | 916 | 919 | 212.4 |
| D | 2 | 33 | 1255013 | 5749.72 | 880 | 851 | 218.1 |
| D | 13 | 235 | 960932 | 4401.5 | 880 | 851 | 218.1 |
| D | 2 | 136 | 391771 | 1792.18 | 880 | 851 | 218.1 |
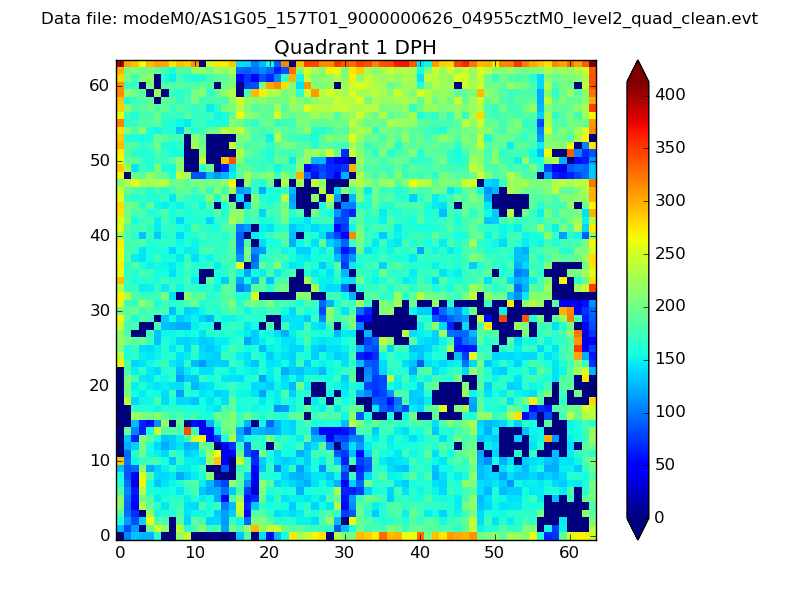
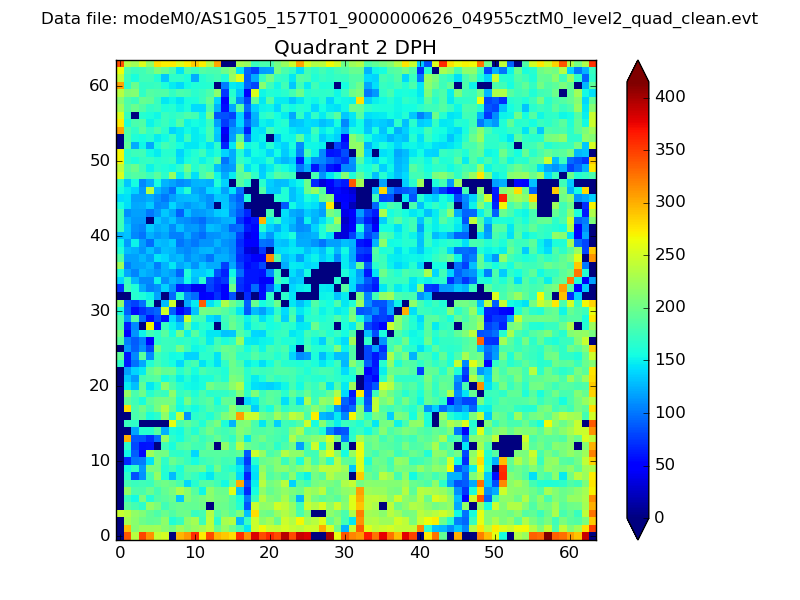
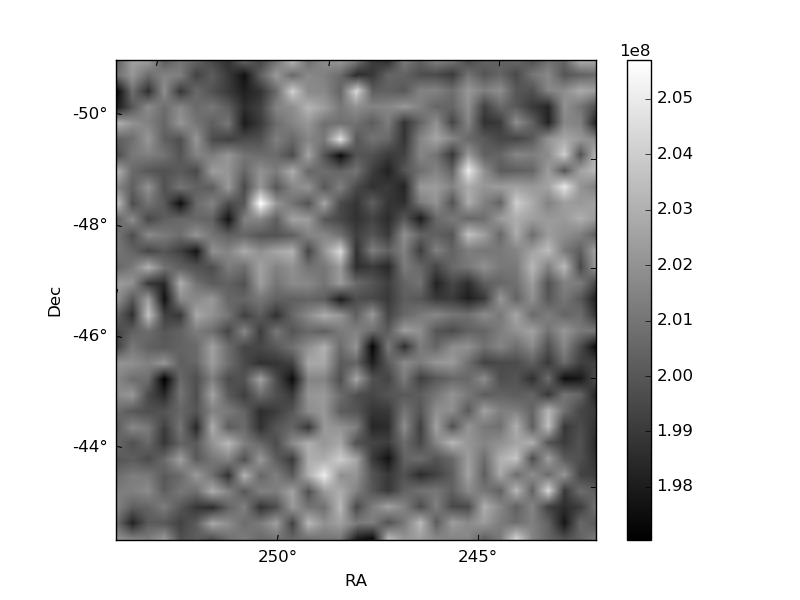
Histogram calculated using DETX and DETY for each event in the final _common_clean file
| Quadrant A |  |
 |
Quadrant B |
|---|---|---|---|
| Quadrant D |  |
 |
Quadrant C |
| Plot type | Count rate plots | Images |
|---|---|---|
| Comparison with Poisson distribution Blue bars denote a histogram of data divided into 1 sec bins. Red curve is a Poisson curve with rate = median count rate of data. |
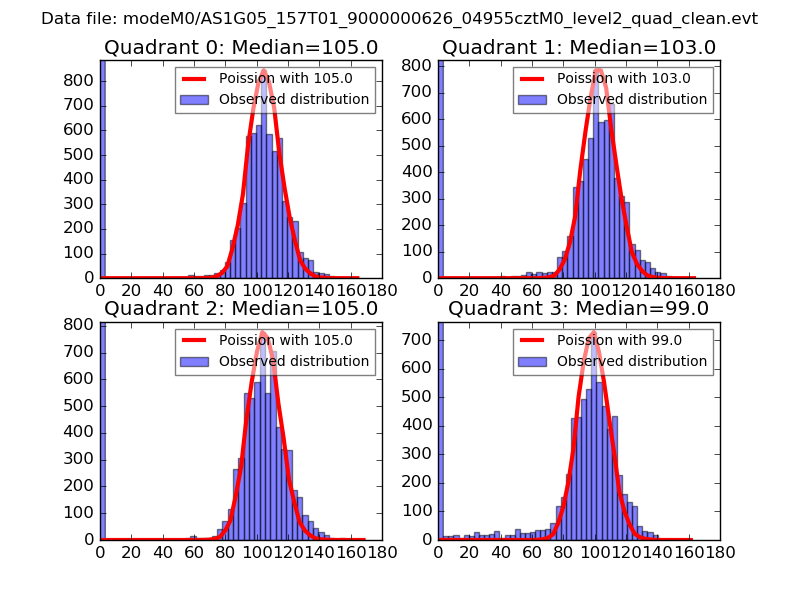 |
 |
| Quadrant-wise count rates Data is divided into 100 sec bins |
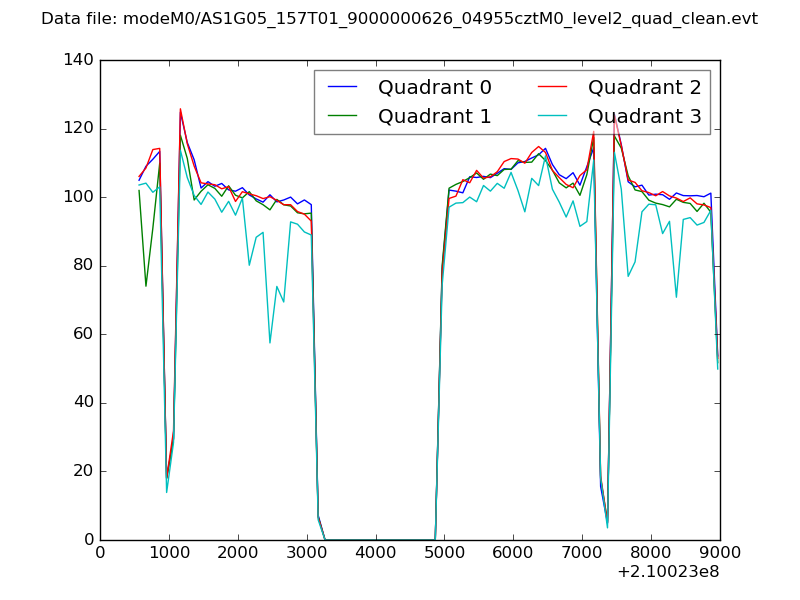 |
|
| Module-wise count rates for Quadrant A Data is divided into 100 sec bins |
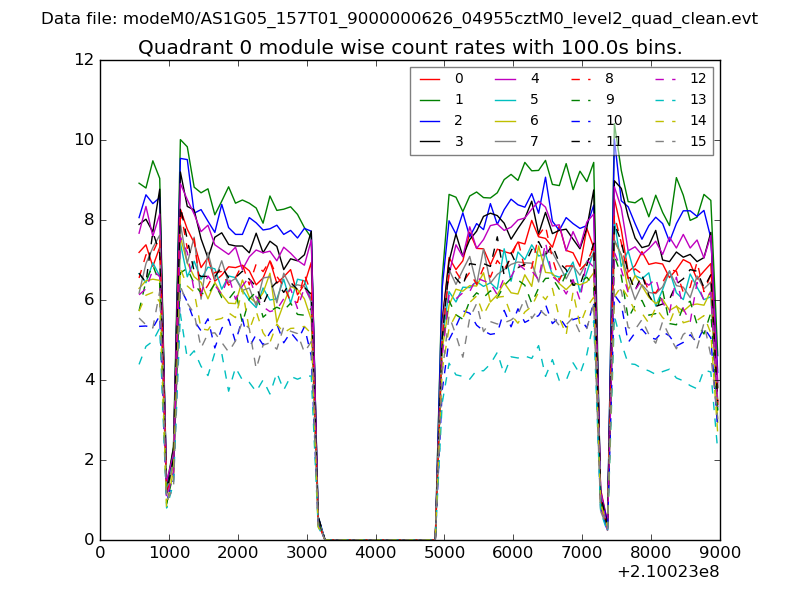 |
 |
| Module-wise count rates for Quadrant B Data is divided into 100 sec bins |
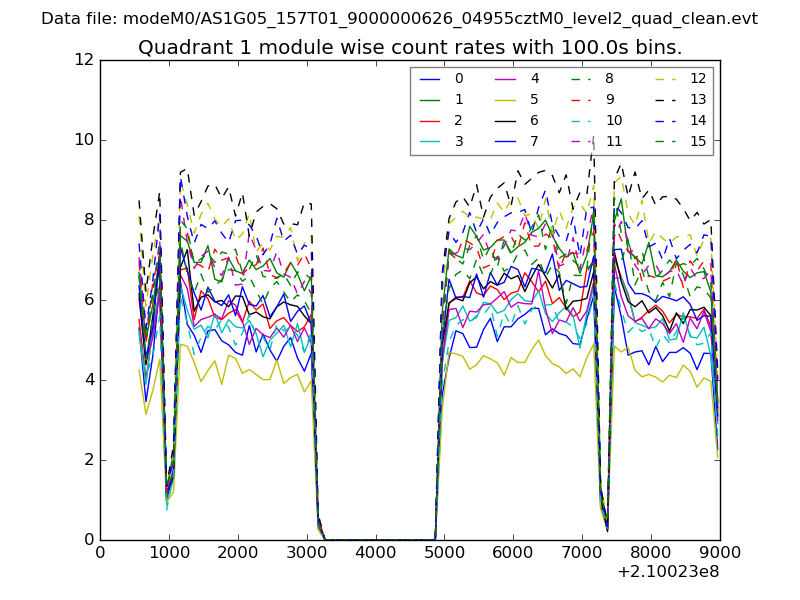 |
 |
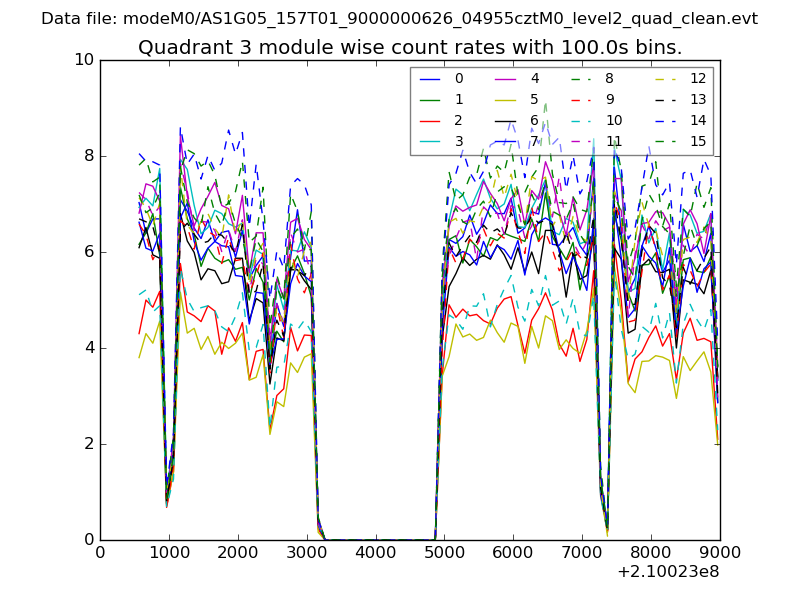
| Module-wise count rates for Quadrant C Data is divided into 100 sec bins |
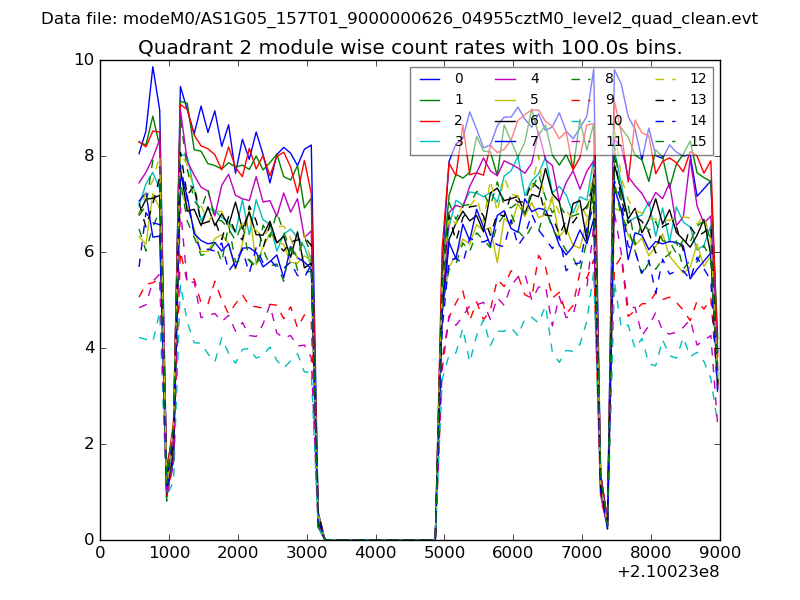 |
 |
| Module-wise count rates for Quadrant D Data is divided into 100 sec bins |
 |
 |
| Parameter | Plot |
|---|---|
| CZT HV Monitor | 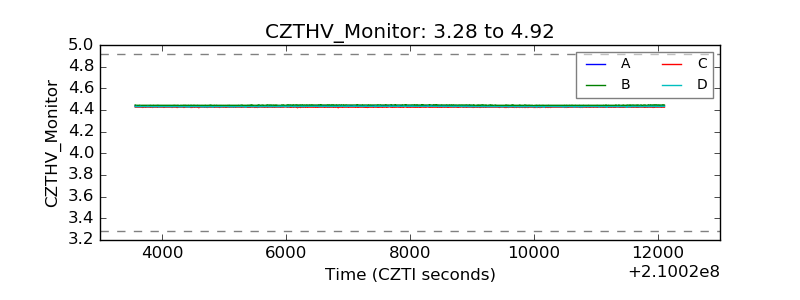 |
| D_VDD | 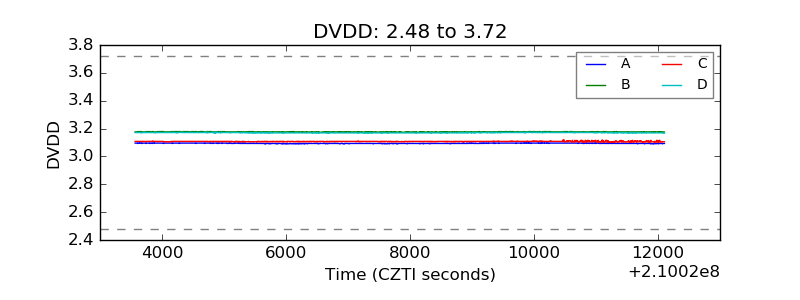 |
| Temperature 1 | 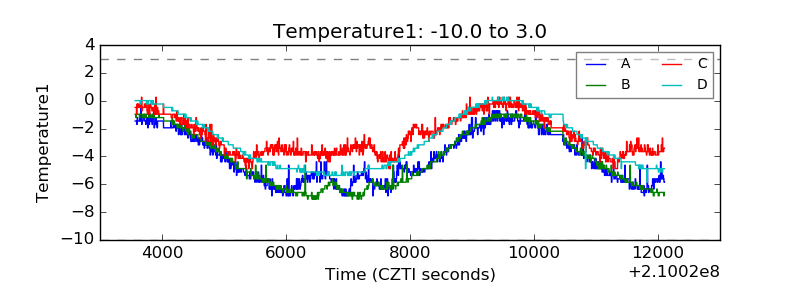 |
| Veto HV Monitor | 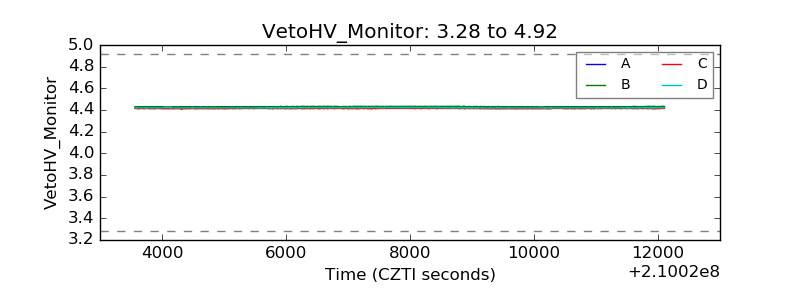 |
| Veto LLD | 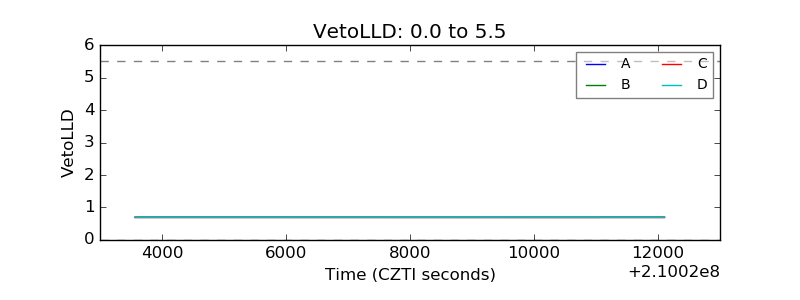 |
| Alpha Counter | 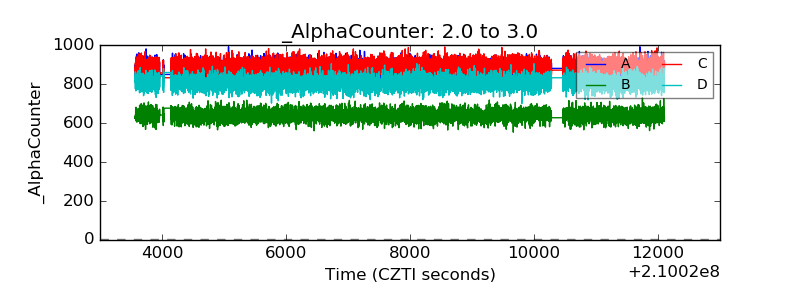 |
| _CPM_Rate | 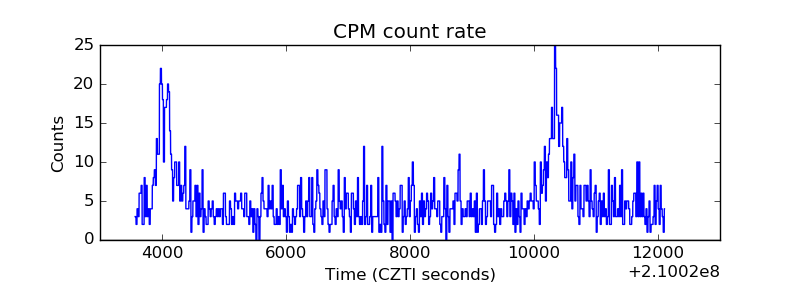 |
| CZT Counter | 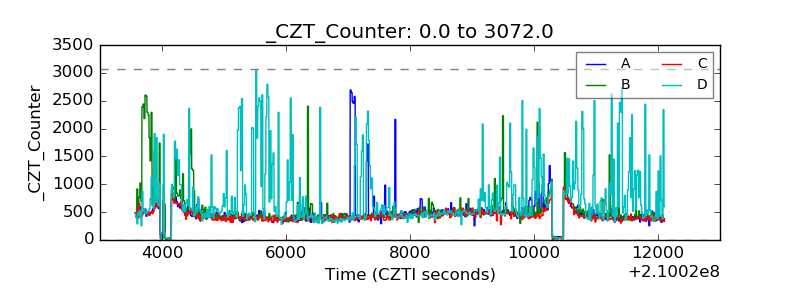 |
| +2.5 Volts monitor |  |
| +5 Volts monitor |  |
| _ROLL_ROT | 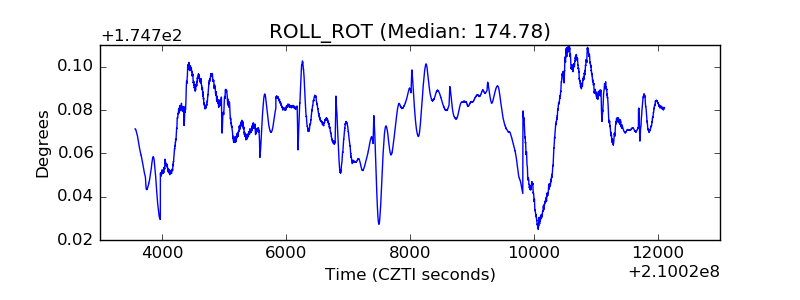 |
| _Roll_DEC | 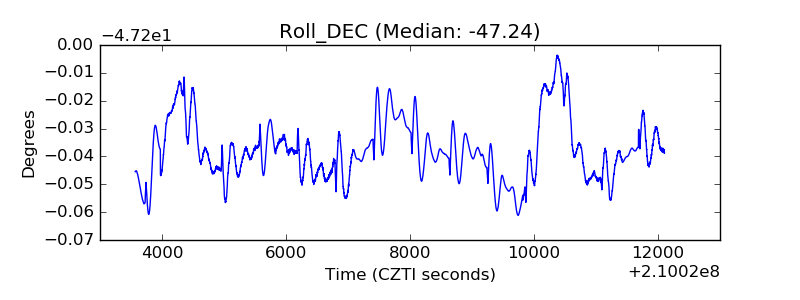 |
| _Roll_RA | 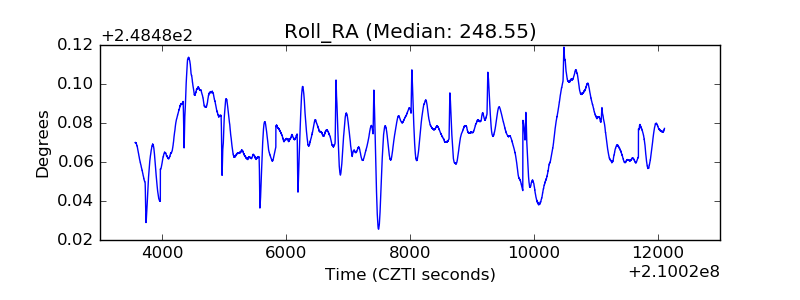 |
| Veto Counter | 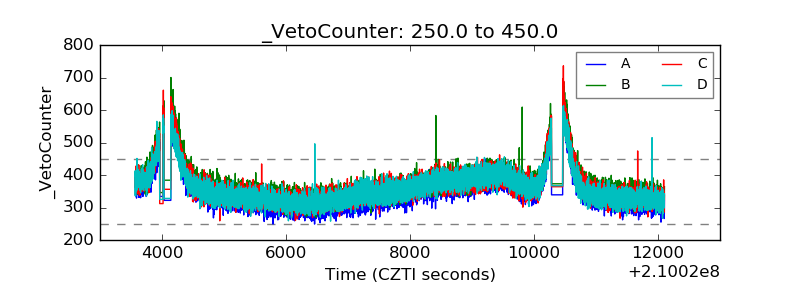 |