| Param | Original file | Final file |
|---|---|---|
| Filename | modeM0/AS1G05_157T01_9000000626_04956cztM0_level2.evt | modeM0/AS1G05_157T01_9000000626_04956cztM0_level2_quad_clean.evt |
| Size (bytes) | 595,555,200 | 94,066,560 |
| Size | 568.0 MB | 89.7 MB |
| Events in quadrant A | 3,841,904 | 585,409 |
| Events in quadrant B | 4,178,176 | 578,776 |
| Events in quadrant C | 3,534,951 | 586,327 |
| Events in quadrant D | 5,934,402 | 537,412 |
| Mode SS | |||
|---|---|---|---|
| Quadrant | BADHDUFLAG | Total packets | Discarded packets |
| A | 0 | 166 | 0 |
| B | 0 | 166 | 0 |
| C | 0 | 166 | 0 |
| D | 0 | 166 | 2 |
| Mode M0 | |||
|---|---|---|---|
| Quadrant | BADHDUFLAG | Total packets | Discarded packets |
| A | 0 | 17246 | 11 |
| B | 0 | 18040 | 20 |
| C | 0 | 16537 | 16 |
| D | 0 | 23469 | 49 |
| Mode M9 | |||
|---|---|---|---|
| Quadrant | BADHDUFLAG | Total packets | Discarded packets |
| A | 0 | 6 | 0 |
| B | 0 | 6 | 0 |
| C | 0 | 6 | 0 |
| D | 0 | 6 | 0 |
| Quadrant | Total seconds | Saturated seconds | Saturation percentage |
|---|---|---|---|
| A | 8066 | 105 | 1.301760% |
| B | 8062 | 184 | 2.282312% |
| C | 8063 | 44 | 0.545703% |
| D | 8059 | 631 | 7.829756% |
Noise dominated data is calculated using 1-second bins in cleaned event files. If a bin has >2000 counts, and if more than 50% of those come from <1% of pixels, then it is considered to be noise-dominated and hence unusable.
| Quadrant | # 1 sec bins | Bins with >0 counts | Bins with >2000 counts | High rate bins dominated by noise | Noise dominated (total time) | Noise dominated (detector-on time) | Marked lightcurve |
|---|---|---|---|---|---|---|---|
| A | 8670 | 8070 | 5 | 5 | 0.06% | 0.06% | 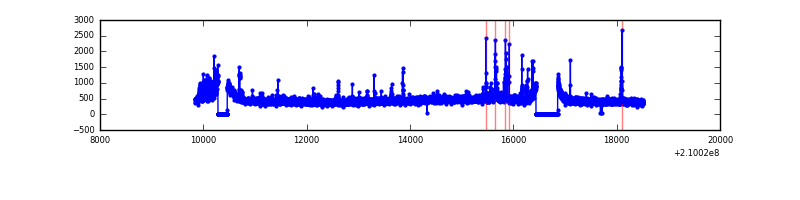 |
| B | 8670 | 8071 | 52 | 52 | 0.60% | 0.64% | 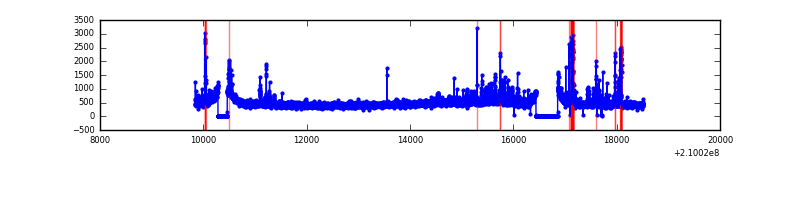 |
| C | 8670 | 8072 | 0 | 0 | 0.00% | 0.00% | 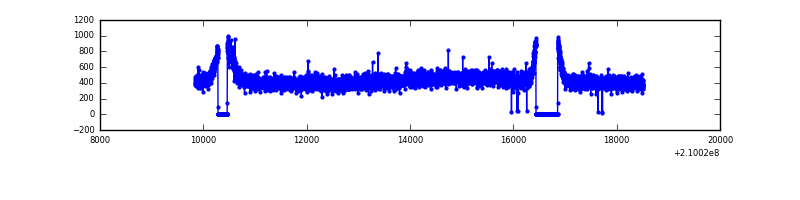 |
| D | 8670 | 8067 | 502 | 502 | 5.79% | 6.22% | 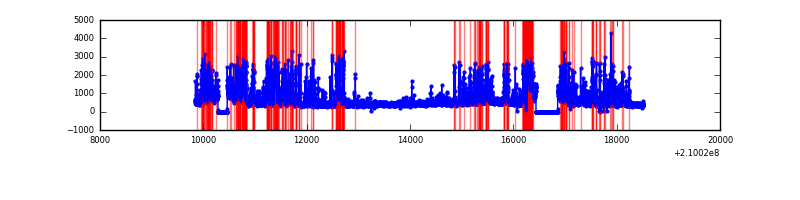 |
Top three noisy pixels from each quadrant. If the there are fewer than three noisy pixels in the level2.evt file, extra rows are filled as -1
| Pixel properties | Quadrant properties | ||||||
|---|---|---|---|---|---|---|---|
| Quadrant | DetID | PixID | Counts | Sigma | Mean | Median | Sigma |
| A | 8 | 15 | 131832 | 686.95 | 924 | 903 | 190.6 |
| A | 0 | 31 | 91634 | 476.04 | 924 | 903 | 190.6 |
| A | 15 | 174 | 30327 | 154.38 | 924 | 903 | 190.6 |
| B | 10 | 16 | 264126 | 1454.36 | 932 | 909 | 181.0 |
| B | 15 | 204 | 154502 | 848.65 | 932 | 909 | 181.0 |
| B | 5 | 6 | 74318 | 405.61 | 932 | 909 | 181.0 |
| C | 8 | 128 | 15597 | 70.21 | 895 | 898 | 209.3 |
| C | 9 | 54 | 8753 | 37.52 | 895 | 898 | 209.3 |
| C | 8 | 112 | 8232 | 35.03 | 895 | 898 | 209.3 |
| D | 2 | 33 | 1132483 | 5270.05 | 867 | 838 | 214.7 |
| D | 13 | 235 | 526938 | 2450.04 | 867 | 838 | 214.7 |
| D | 2 | 136 | 325909 | 1513.85 | 867 | 838 | 214.7 |
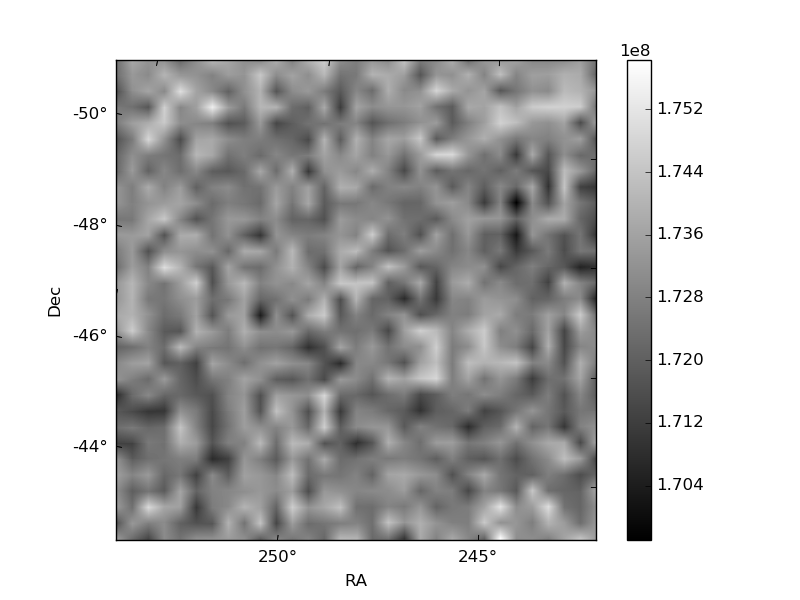
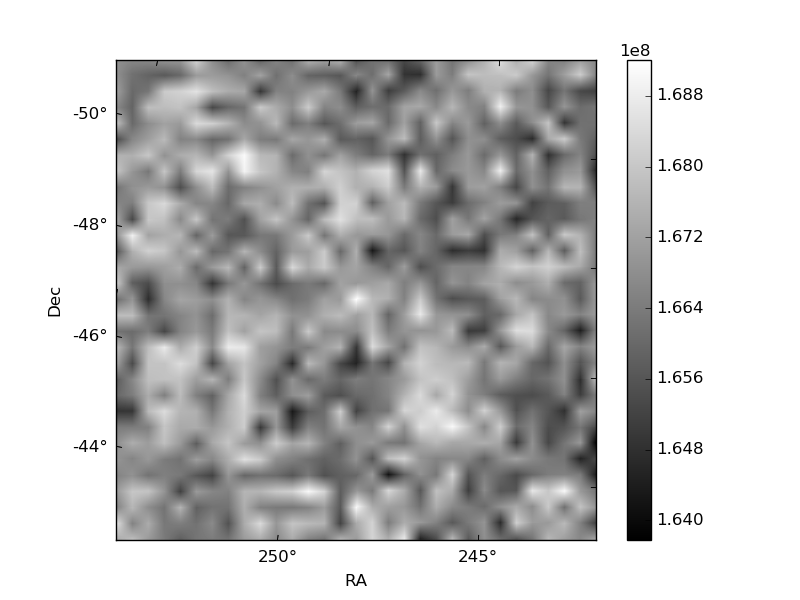
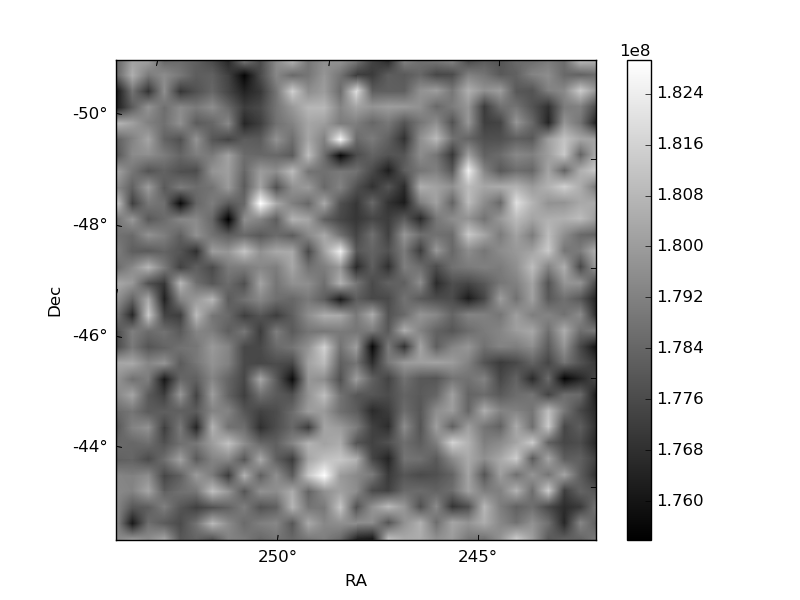
Histogram calculated using DETX and DETY for each event in the final _common_clean file
| Quadrant A | 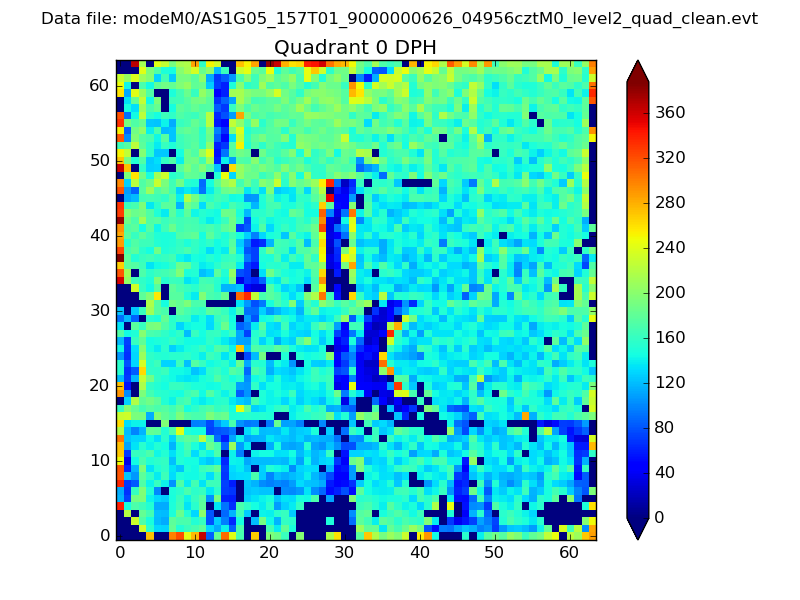 |
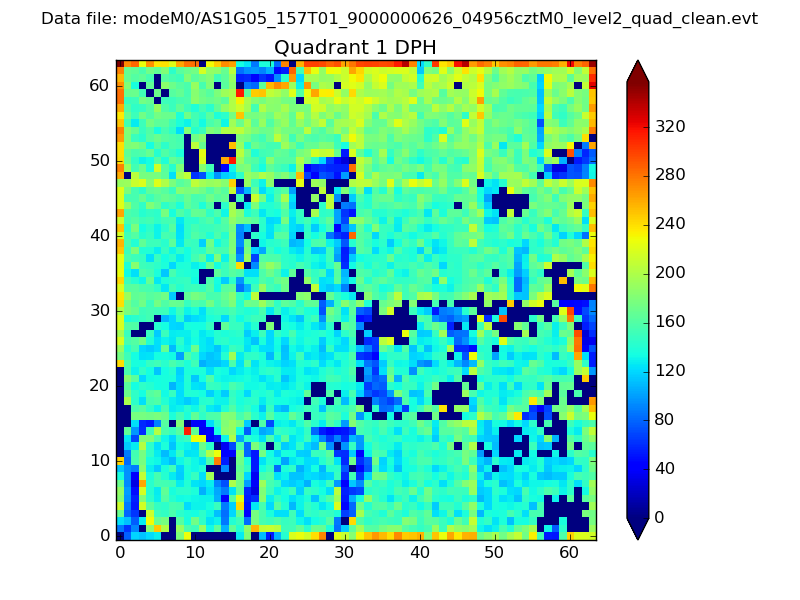 |
Quadrant B |
|---|---|---|---|
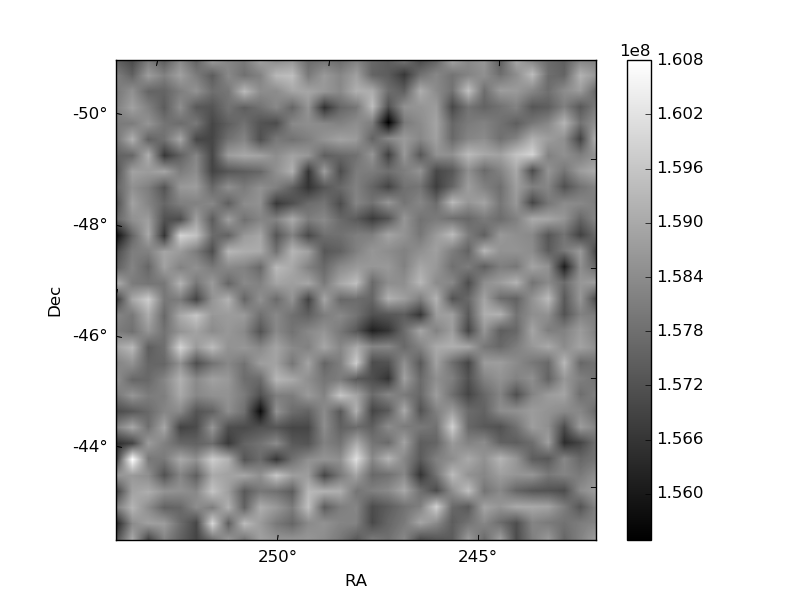
| Quadrant D | 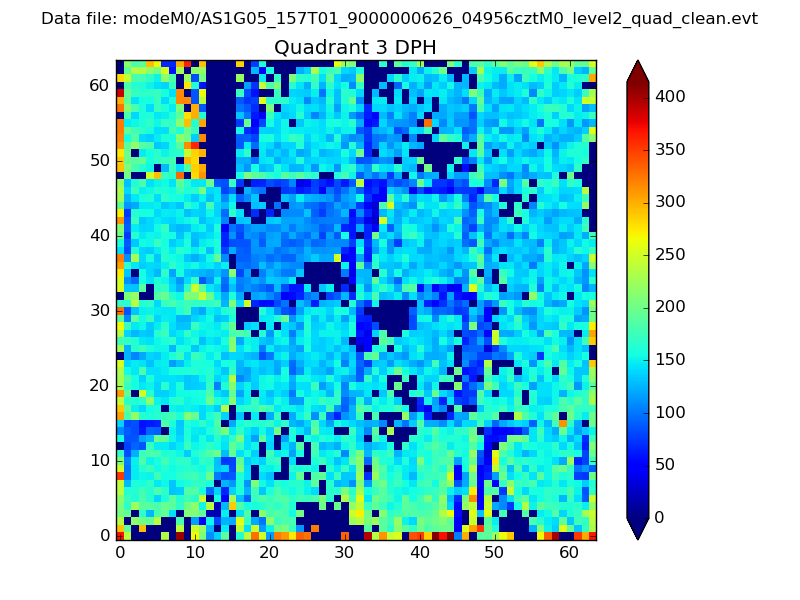 |
 |
Quadrant C |
| Plot type | Count rate plots | Images |
|---|---|---|
| Comparison with Poisson distribution Blue bars denote a histogram of data divided into 1 sec bins. Red curve is a Poisson curve with rate = median count rate of data. |
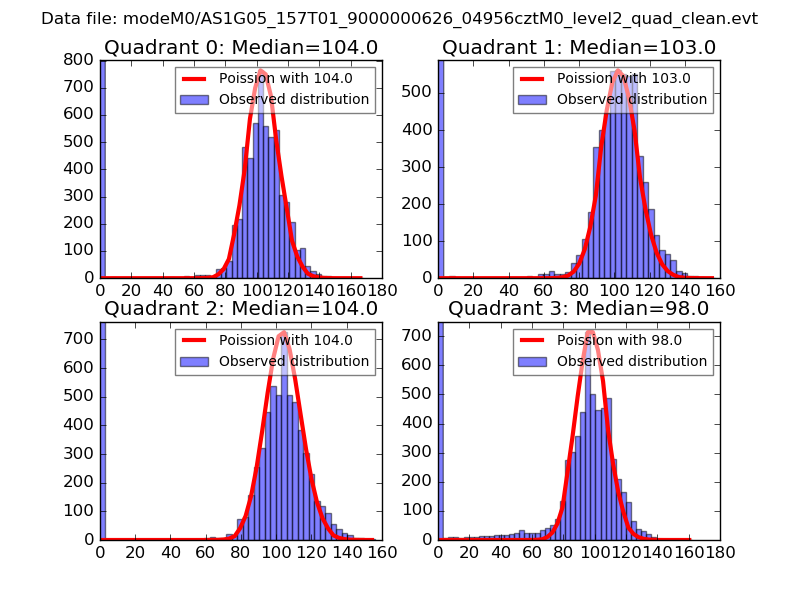 |
 |
| Quadrant-wise count rates Data is divided into 100 sec bins |
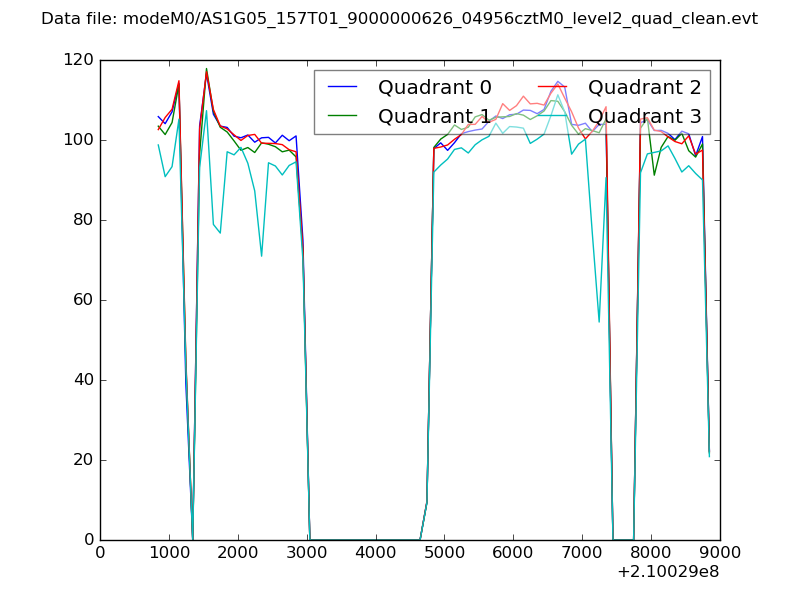 |
|
| Module-wise count rates for Quadrant A Data is divided into 100 sec bins |
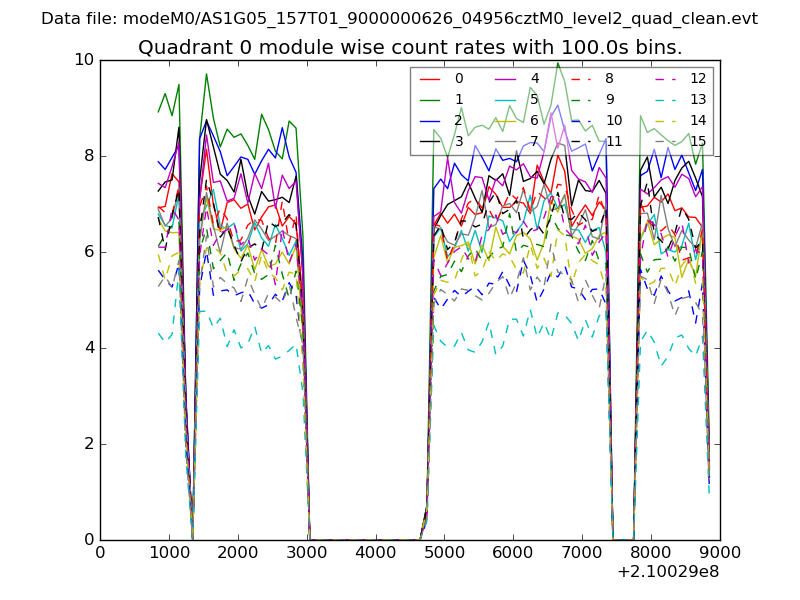 |
 |
| Module-wise count rates for Quadrant B Data is divided into 100 sec bins |
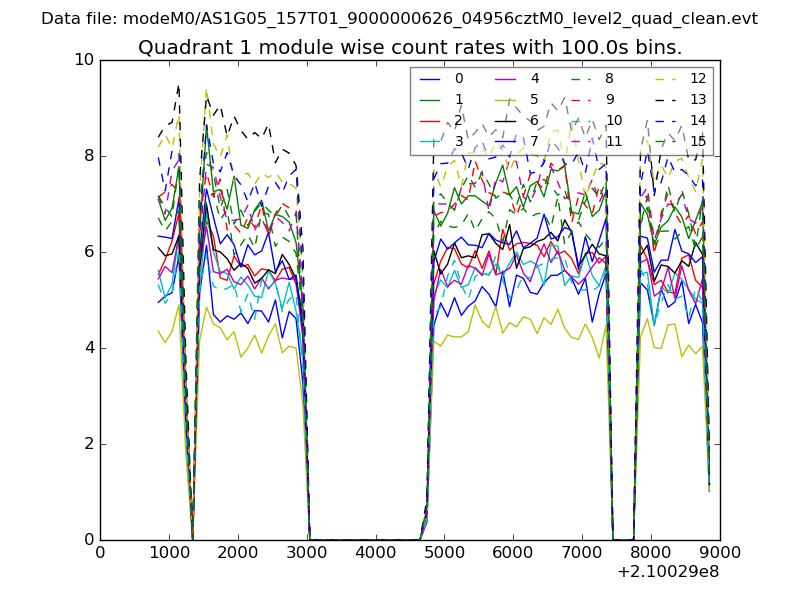 |
 |
| Module-wise count rates for Quadrant C Data is divided into 100 sec bins |
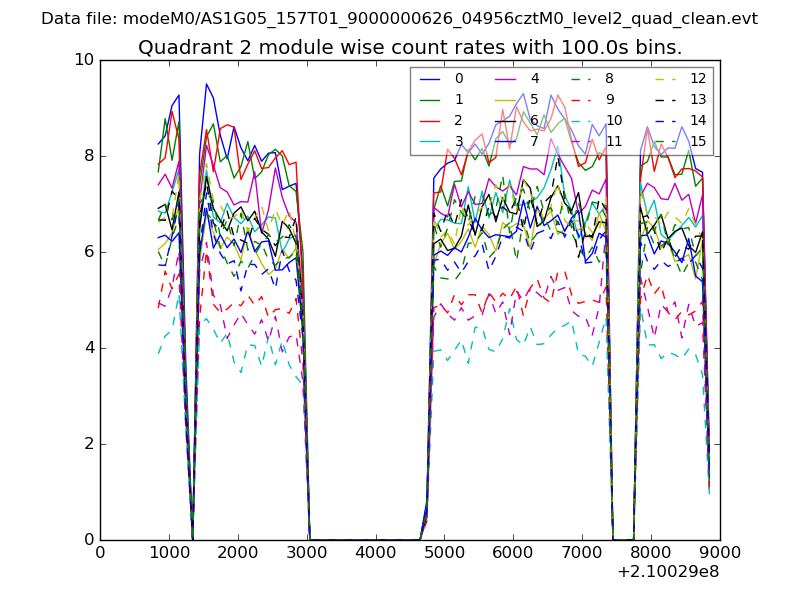 |
 |
| Module-wise count rates for Quadrant D Data is divided into 100 sec bins |
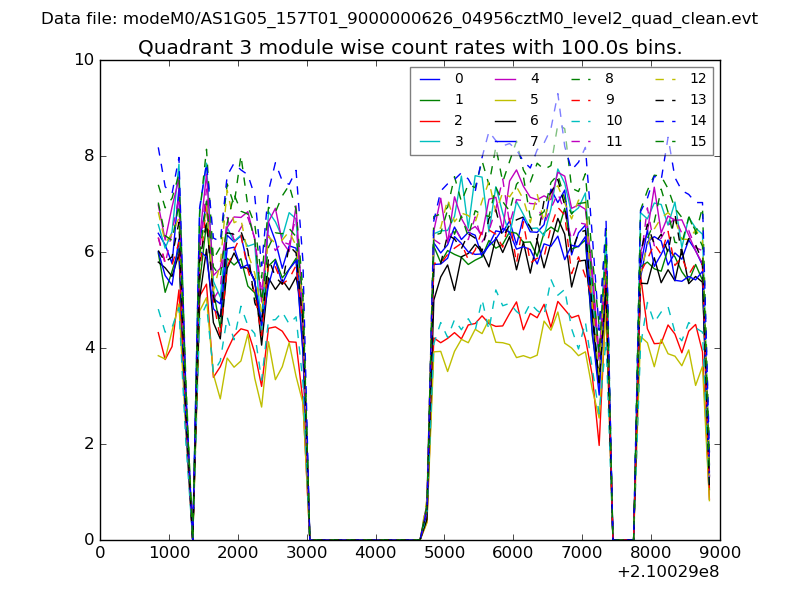 |
 |
| Parameter | Plot |
|---|---|
| CZT HV Monitor | 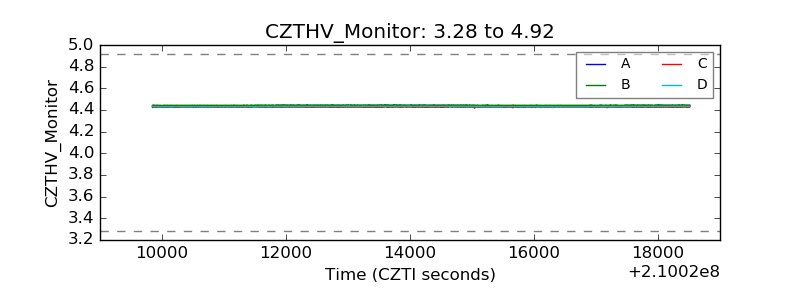 |
| D_VDD | 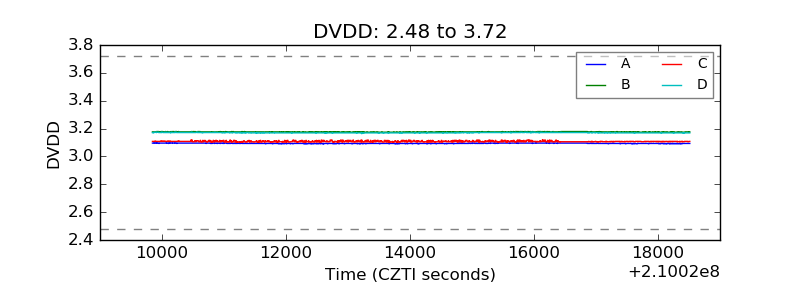 |
| Temperature 1 | 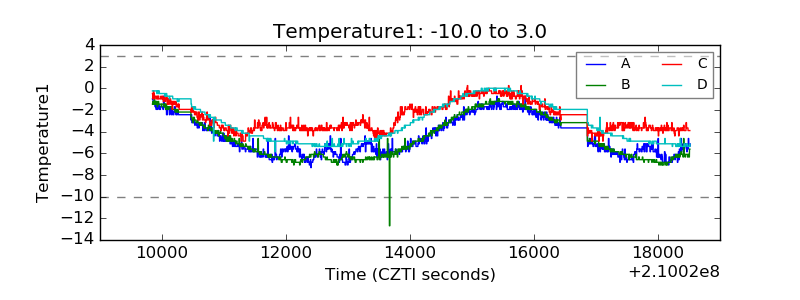 |
| Veto HV Monitor | 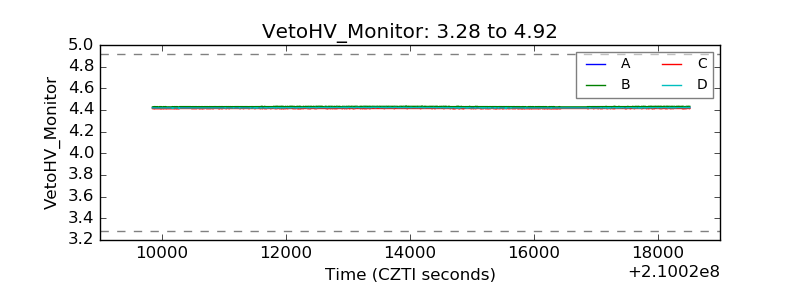 |
| Veto LLD | 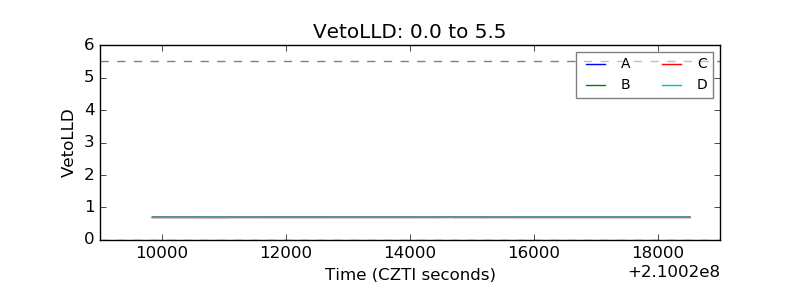 |
| Alpha Counter | 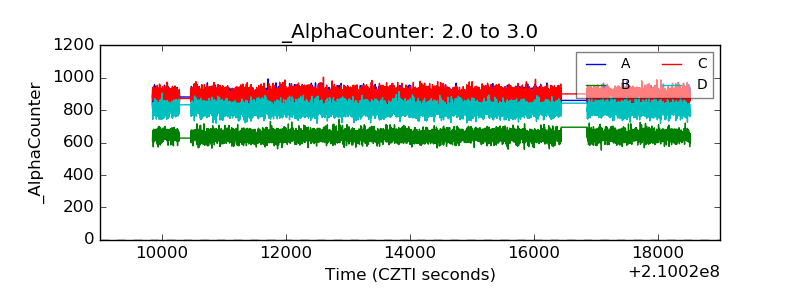 |
| _CPM_Rate | 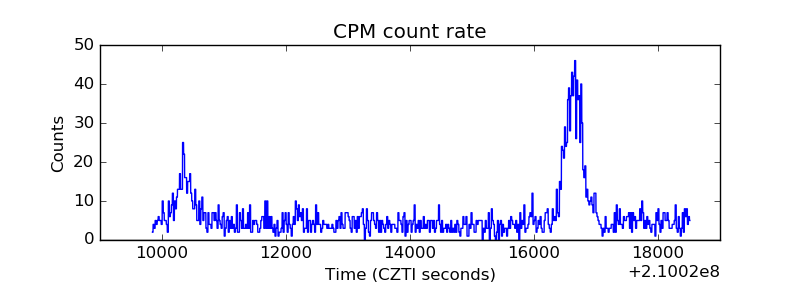 |
| CZT Counter | 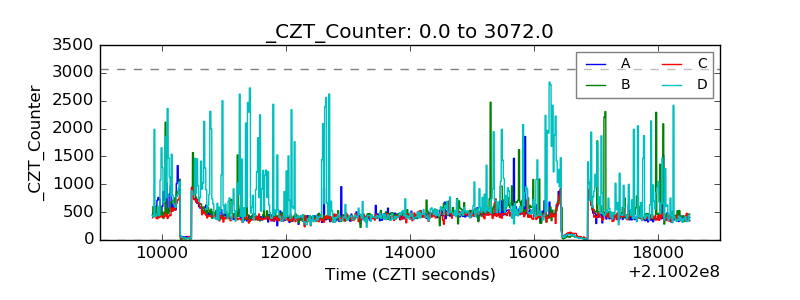 |
| +2.5 Volts monitor |  |
| +5 Volts monitor |  |
| _ROLL_ROT | 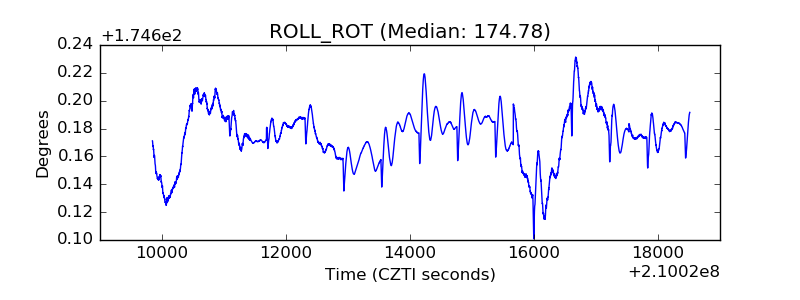 |
| _Roll_DEC | 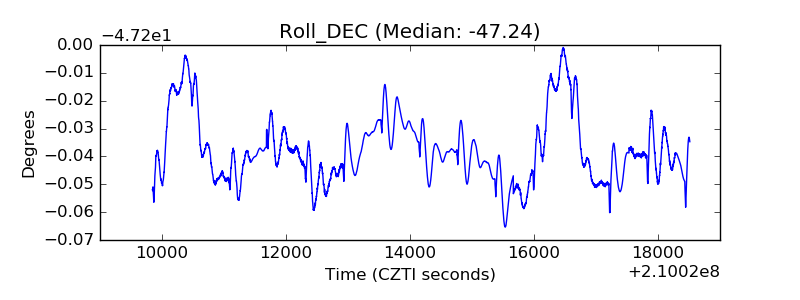 |
| _Roll_RA | 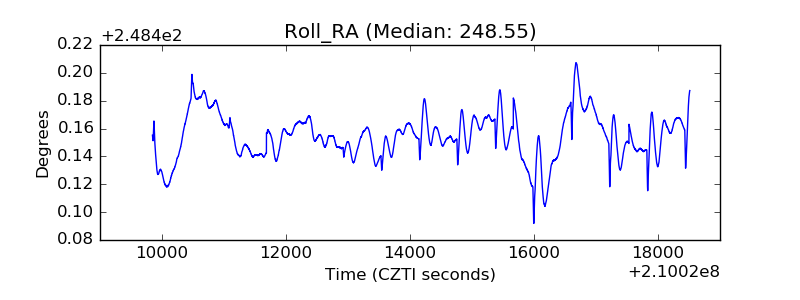 |
| Veto Counter | 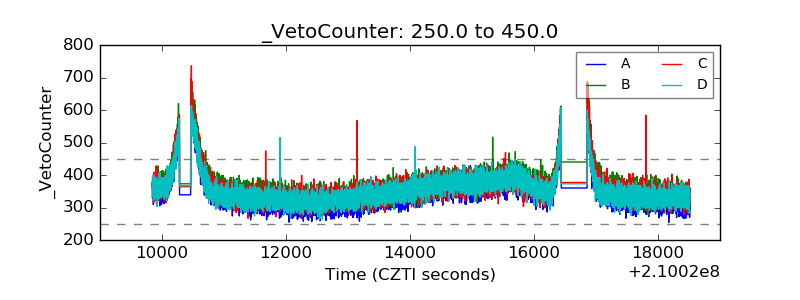 |