| Param | Original file | Final file |
|---|---|---|
| Filename | modeM0/AS1G05_157T01_9000000626_04958cztM0_level2.evt | modeM0/AS1G05_157T01_9000000626_04958cztM0_level2_quad_clean.evt |
| Size (bytes) | 421,588,800 | 68,376,960 |
| Size | 402.1 MB | 65.2 MB |
| Events in quadrant A | 2,712,910 | 422,829 |
| Events in quadrant B | 3,026,976 | 421,956 |
| Events in quadrant C | 2,549,945 | 426,290 |
| Events in quadrant D | 4,076,082 | 386,500 |
| Mode SS | |||
|---|---|---|---|
| Quadrant | BADHDUFLAG | Total packets | Discarded packets |
| A | 0 | 122 | 0 |
| B | 0 | 122 | 0 |
| C | 0 | 122 | 0 |
| D | 0 | 122 | 0 |
| Mode M0 | |||
|---|---|---|---|
| Quadrant | BADHDUFLAG | Total packets | Discarded packets |
| A | 0 | 12279 | 1 |
| B | 0 | 12990 | 1 |
| C | 0 | 12019 | 1 |
| D | 0 | 16422 | 1 |
| Mode M9 | |||
|---|---|---|---|
| Quadrant | BADHDUFLAG | Total packets | Discarded packets |
| A | 0 | 11 | 0 |
| B | 0 | 11 | 0 |
| C | 0 | 11 | 0 |
| D | 0 | 11 | 0 |
| Quadrant | Total seconds | Saturated seconds | Saturation percentage |
|---|---|---|---|
| A | 5906 | 43 | 0.728073% |
| B | 5906 | 101 | 1.710125% |
| C | 5906 | 18 | 0.304775% |
| D | 5906 | 431 | 7.297663% |
Noise dominated data is calculated using 1-second bins in cleaned event files. If a bin has >2000 counts, and if more than 50% of those come from <1% of pixels, then it is considered to be noise-dominated and hence unusable.
| Quadrant | # 1 sec bins | Bins with >0 counts | Bins with >2000 counts | High rate bins dominated by noise | Noise dominated (total time) | Noise dominated (detector-on time) | Marked lightcurve |
|---|---|---|---|---|---|---|---|
| A | 6971 | 5906 | 4 | 4 | 0.06% | 0.07% |  |
| B | 6971 | 5907 | 46 | 46 | 0.66% | 0.78% |  |
| C | 6971 | 5908 | 0 | 0 | 0.00% | 0.00% |  |
| D | 6971 | 5906 | 337 | 337 | 4.83% | 5.71% | 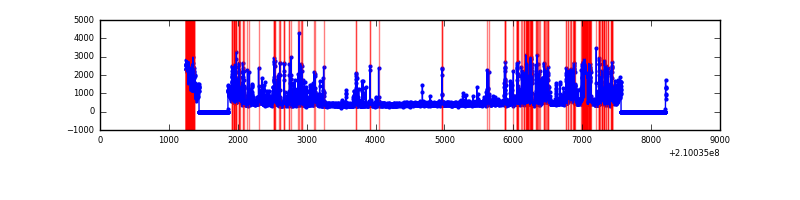 |
Top three noisy pixels from each quadrant. If the there are fewer than three noisy pixels in the level2.evt file, extra rows are filled as -1
| Pixel properties | Quadrant properties | ||||||
|---|---|---|---|---|---|---|---|
| Quadrant | DetID | PixID | Counts | Sigma | Mean | Median | Sigma |
| A | 0 | 50 | 55032 | 388.03 | 674 | 658 | 140.1 |
| A | 8 | 15 | 24423 | 169.6 | 674 | 658 | 140.1 |
| A | 15 | 174 | 16229 | 111.12 | 674 | 658 | 140.1 |
| B | 10 | 16 | 181647 | 1377.54 | 678 | 661 | 131.4 |
| B | 15 | 204 | 97780 | 739.2 | 678 | 661 | 131.4 |
| B | 5 | 6 | 32268 | 240.57 | 678 | 661 | 131.4 |
| C | 13 | 61 | 5402 | 31.23 | 652 | 654 | 152.0 |
| C | 12 | 4 | 3564 | 19.14 | 652 | 654 | 152.0 |
| C | 9 | 54 | 1929 | 8.39 | 652 | 654 | 152.0 |
| D | 2 | 33 | 1030094 | 6556.78 | 630 | 608 | 157.0 |
| D | 13 | 235 | 171652 | 1089.38 | 630 | 608 | 157.0 |
| D | 2 | 136 | 137700 | 873.14 | 630 | 608 | 157.0 |
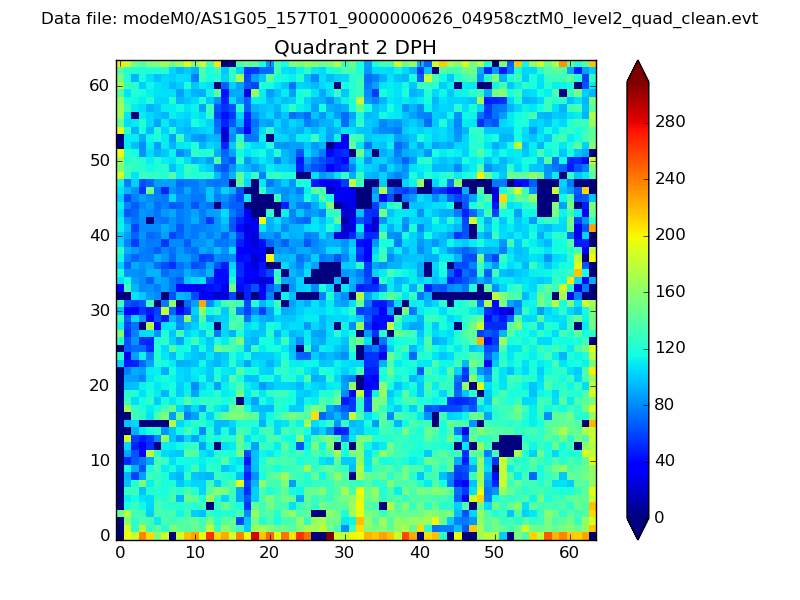
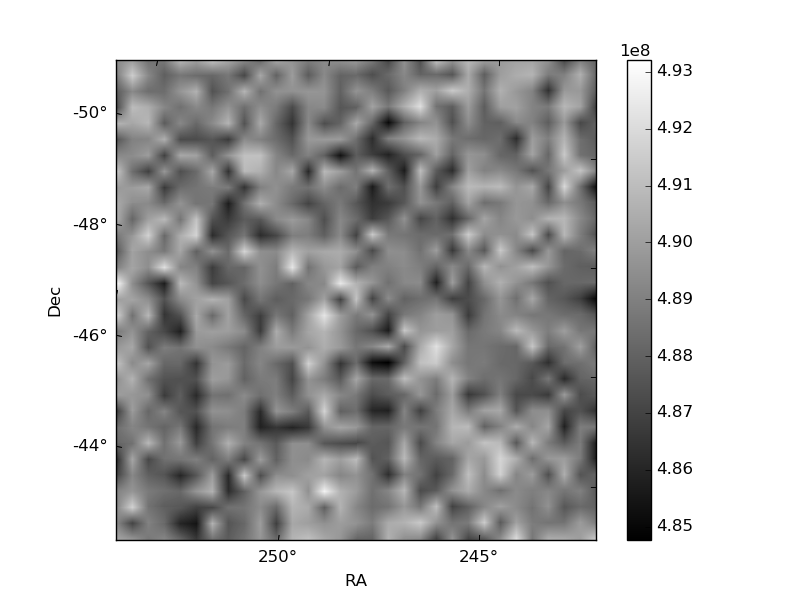
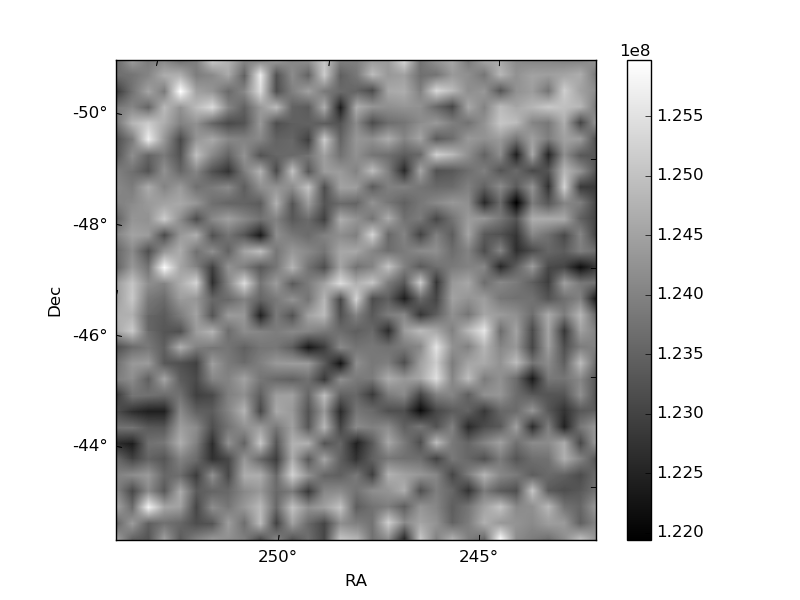
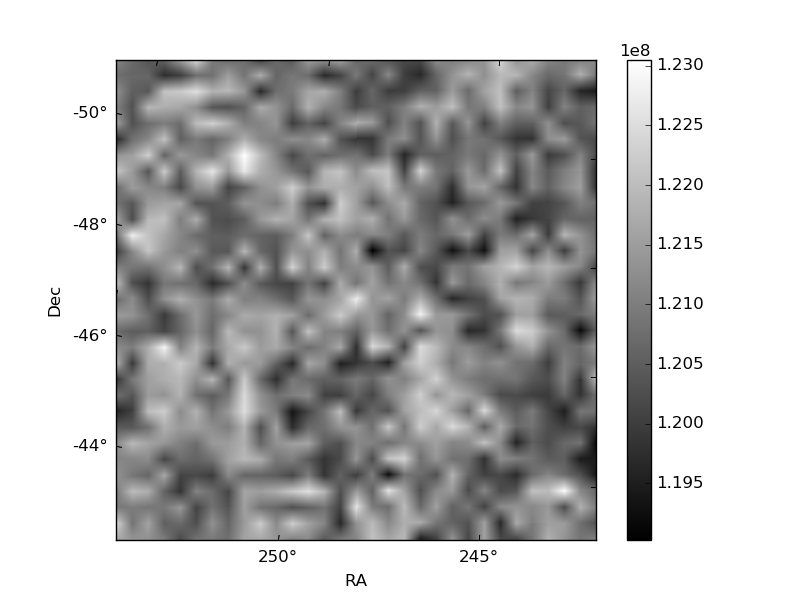
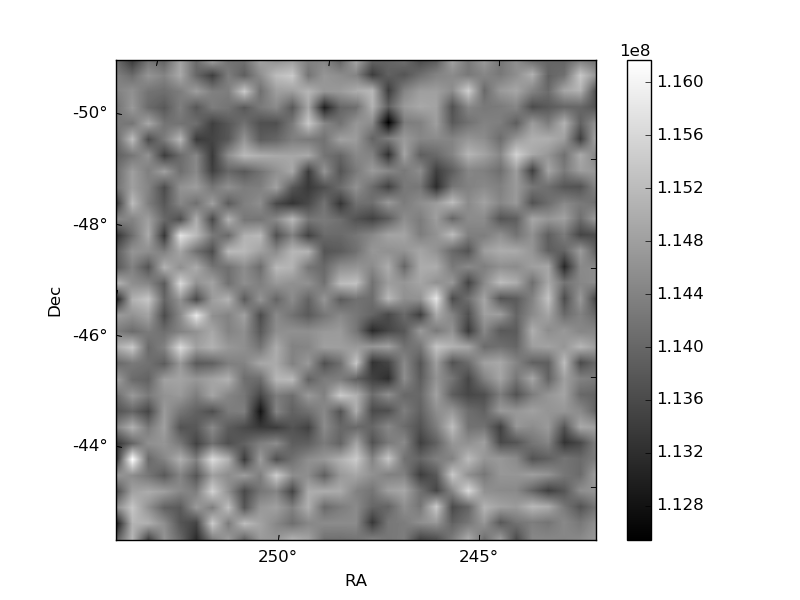
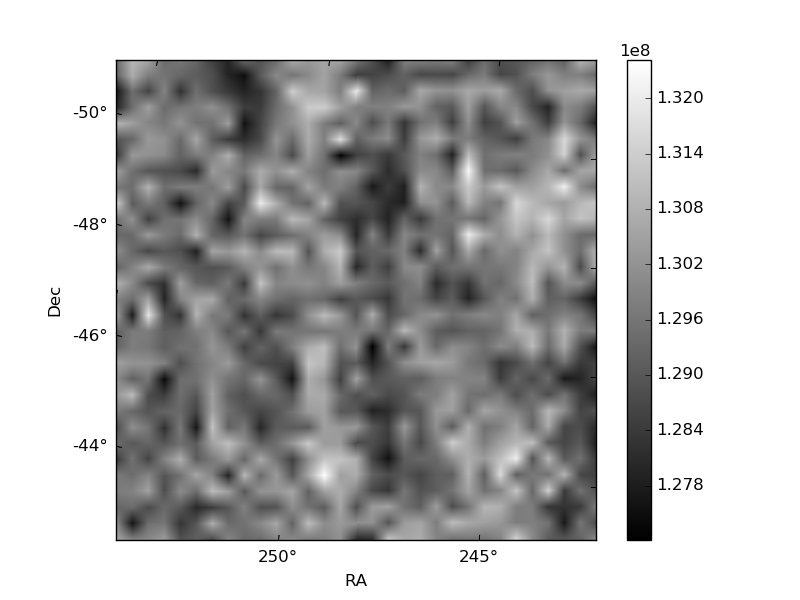
Histogram calculated using DETX and DETY for each event in the final _common_clean file
| Quadrant A |  |
 |
Quadrant B |
|---|---|---|---|
| Quadrant D | 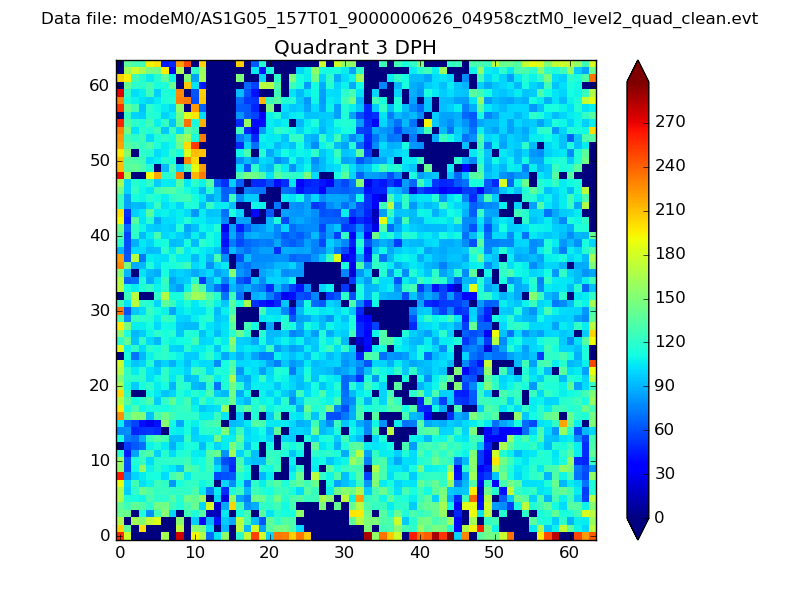 |
 |
Quadrant C |
| Plot type | Count rate plots | Images |
|---|---|---|
| Comparison with Poisson distribution Blue bars denote a histogram of data divided into 1 sec bins. Red curve is a Poisson curve with rate = median count rate of data. |
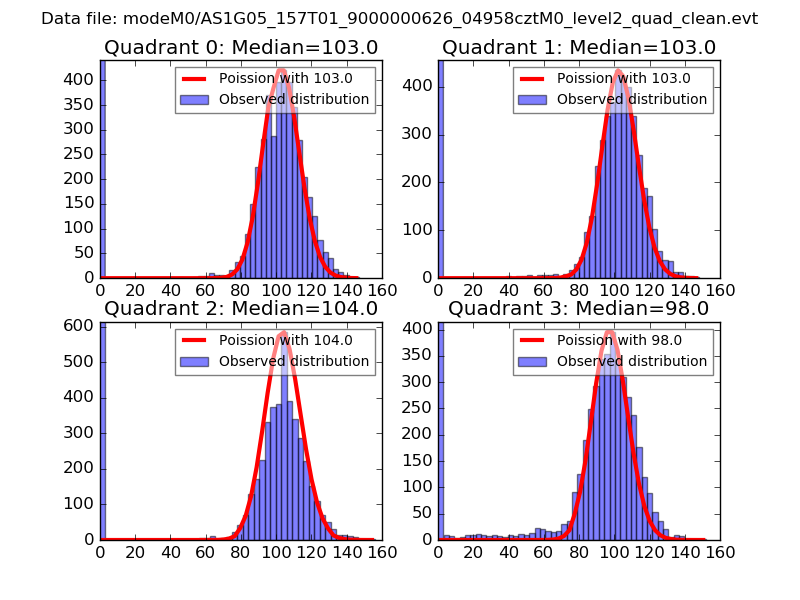 |
 |
| Quadrant-wise count rates Data is divided into 100 sec bins |
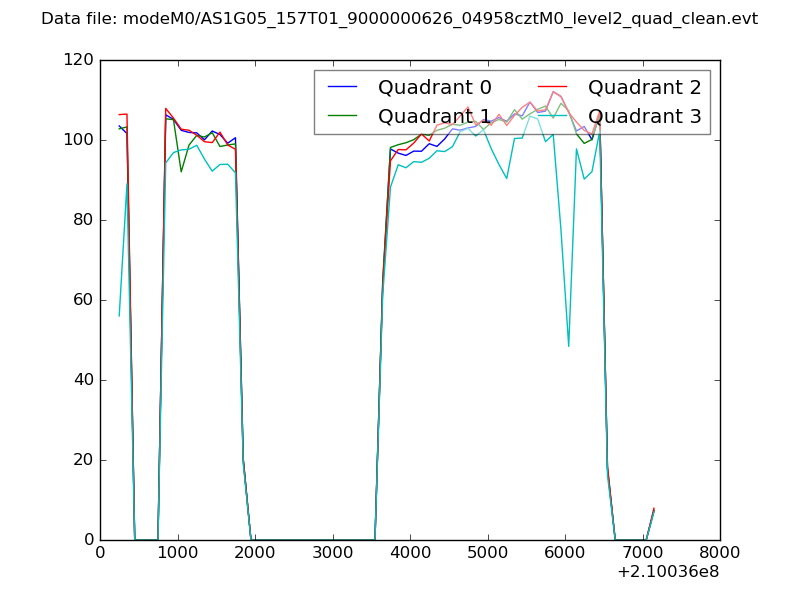 |
|
| Module-wise count rates for Quadrant A Data is divided into 100 sec bins |
 |
 |
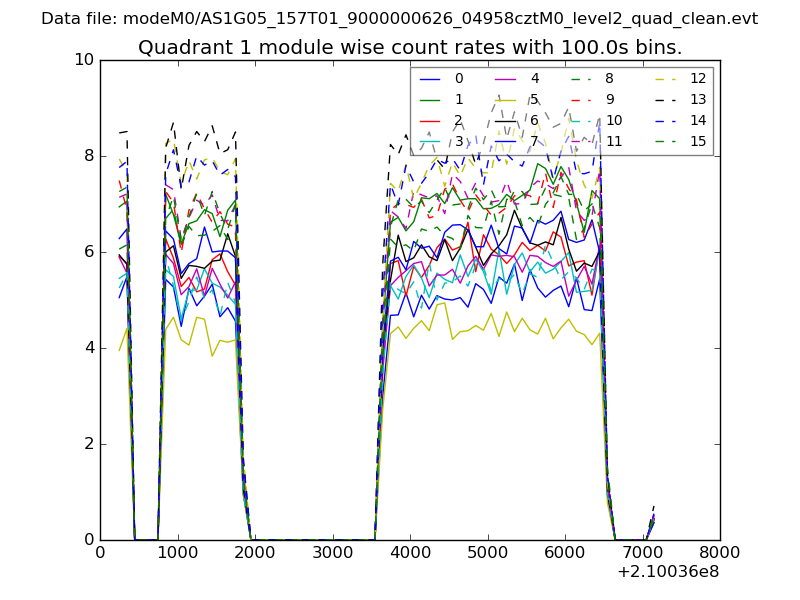
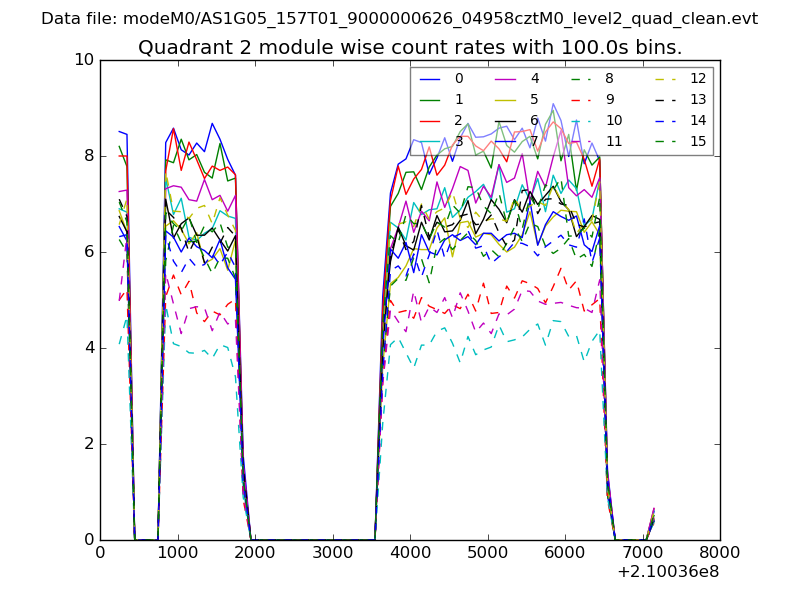
| Module-wise count rates for Quadrant B Data is divided into 100 sec bins |
 |
 |
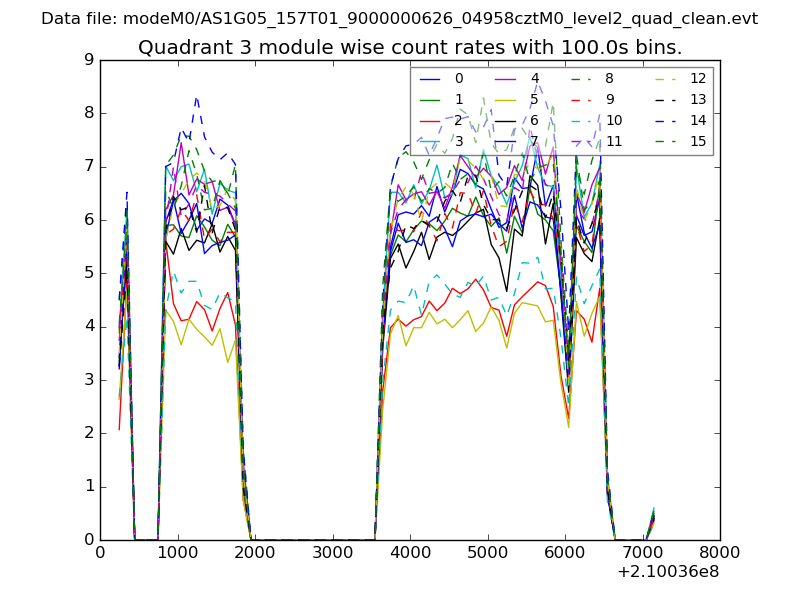
| Module-wise count rates for Quadrant C Data is divided into 100 sec bins |
 |
 |
| Module-wise count rates for Quadrant D Data is divided into 100 sec bins |
 |
 |
| Parameter | Plot |
|---|---|
| CZT HV Monitor | 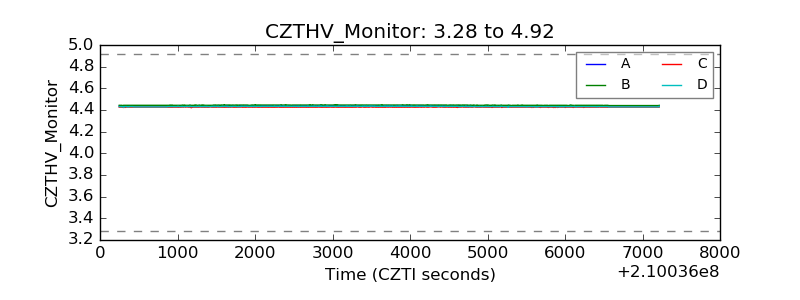 |
| D_VDD | 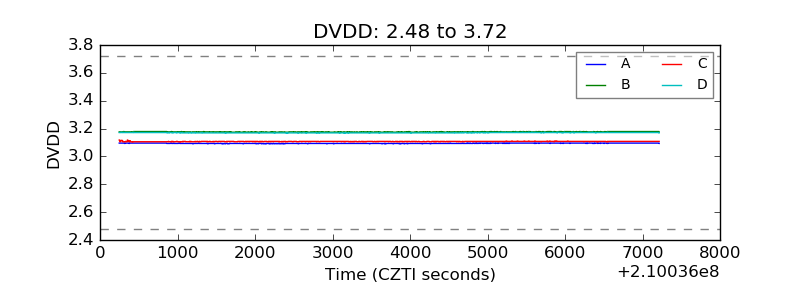 |
| Temperature 1 | 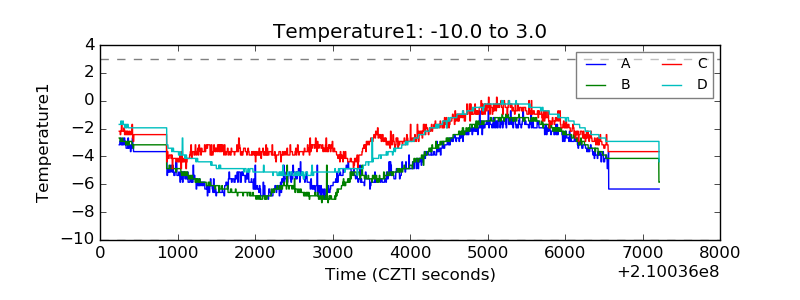 |
| Veto HV Monitor | 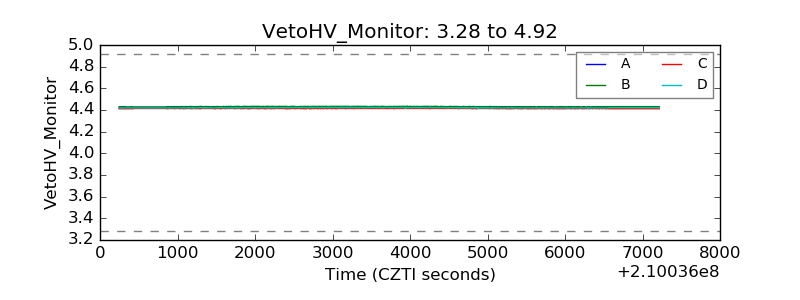 |
| Veto LLD | 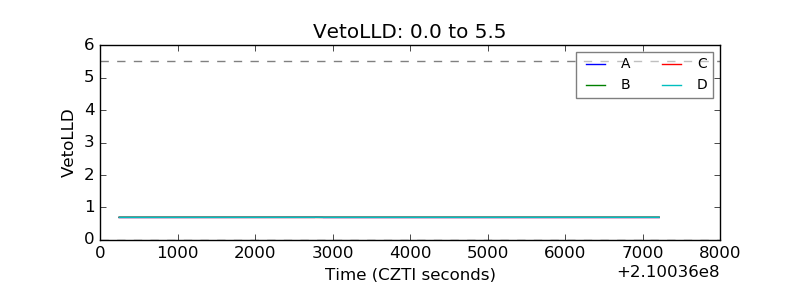 |
| Alpha Counter | 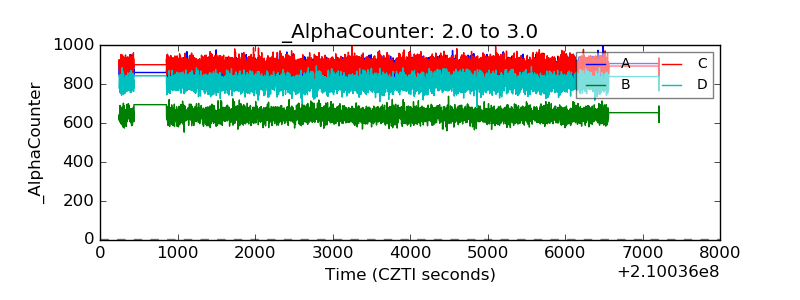 |
| _CPM_Rate | 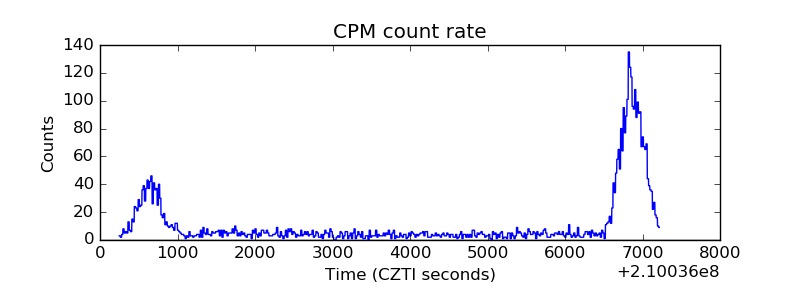 |
| CZT Counter | 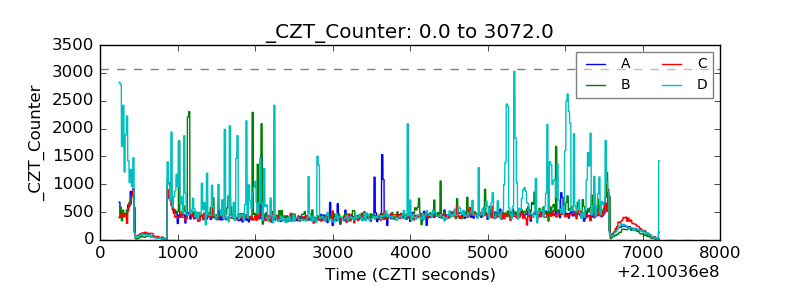 |
| +2.5 Volts monitor |  |
| +5 Volts monitor |  |
| _ROLL_ROT | 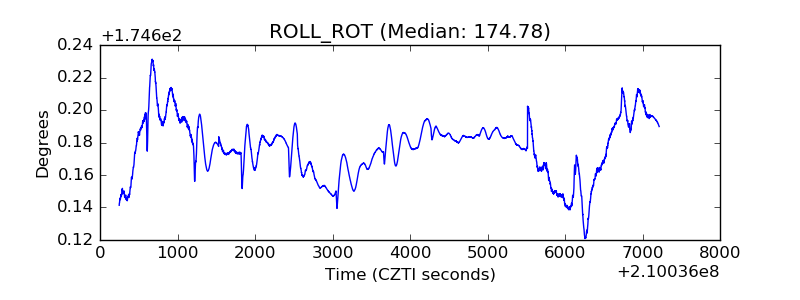 |
| _Roll_DEC | 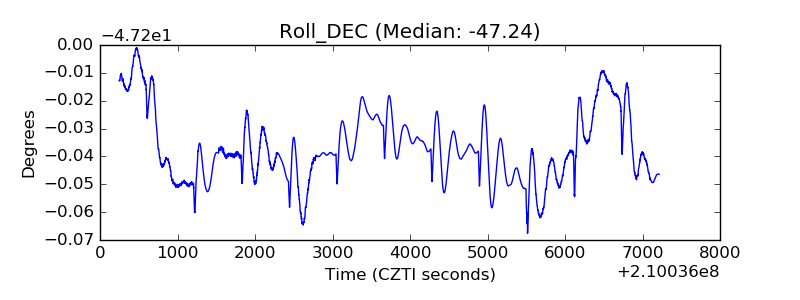 |
| _Roll_RA | 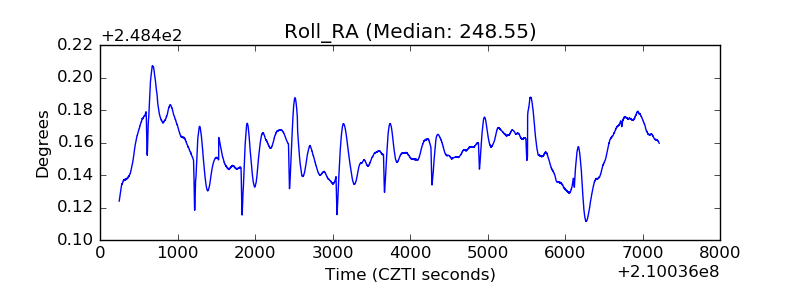 |
| Veto Counter | 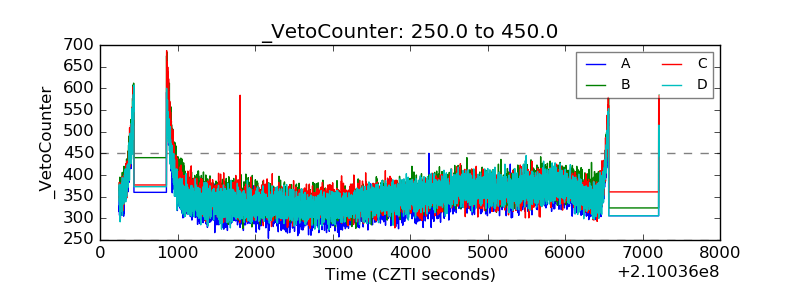 |