| Param | Original file | Final file |
|---|---|---|
| Filename | modeM0/AS1G05_140T01_9000000628cztM0_level2.fits | modeM0/AS1G05_140T01_9000000628cztM0_level2_quad_clean.evt |
| Size (bytes) | 336,683,520 | 350,516,160 |
| Size | 321.1 MB | 334.3 MB |
| Events in quadrant A | 2,046,438 | 2,123,339 |
| Events in quadrant B | 1,969,270 | 2,101,388 |
| Events in quadrant C | 2,005,846 | 2,075,629 |
| Events in quadrant D | 1,723,550 | 1,863,573 |
| Mode M0 | |||
|---|---|---|---|
| Quadrant | BADHDUFLAG | Total packets | Discarded packets |
| A | 0 | 74841 | 0 |
| B | 0 | 75896 | 0 |
| C | 0 | 73276 | 0 |
| D | 0 | 88892 | 0 |
| Mode M9 | |||
|---|---|---|---|
| Quadrant | BADHDUFLAG | Total packets | Discarded packets |
| A | 0 | 64 | 0 |
| B | 0 | 64 | 0 |
| C | 0 | 64 | 0 |
| D | 0 | 64 | 0 |
| Mode SS | |||
|---|---|---|---|
| Quadrant | BADHDUFLAG | Total packets | Discarded packets |
| A | 0 | 726 | 0 |
| B | 0 | 726 | 0 |
| C | 0 | 726 | 0 |
| D | 0 | 726 | 0 |
| Quadrant | Total seconds | Saturated seconds | Saturation percentage |
|---|---|---|---|
| A | 35685 | 458 | 1.283452% |
| B | 35685 | 442 | 1.238616% |
| C | 35685 | 352 | 0.986409% |
| D | 35685 | 1036 | 2.903181% |
Noise dominated data is calculated using 1-second bins in cleaned event files. If a bin has >2000 counts, and if more than 50% of those come from <1% of pixels, then it is considered to be noise-dominated and hence unusable.
| Quadrant | # 1 sec bins | Bins with >0 counts | Bins with >2000 counts | High rate bins dominated by noise | Noise dominated (total time) | Noise dominated (detector-on time) | Marked lightcurve |
|---|---|---|---|---|---|---|---|
| A | 42144 | 35678 | 0 | 0 | 0.00% | 0.00% | 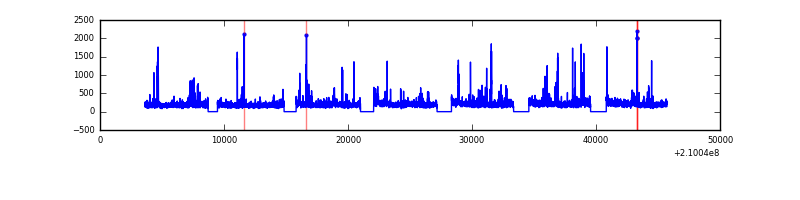 |
| B | 42145 | 35679 | 0 | 0 | 0.00% | 0.00% | 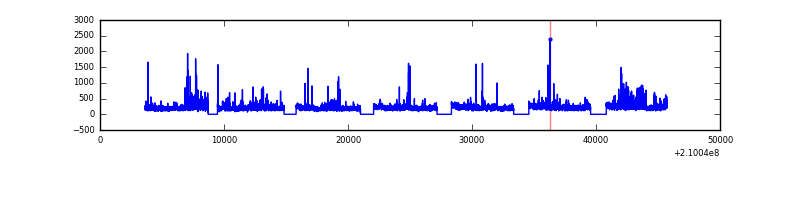 |
| C | 42145 | 35680 | 0 | 0 | 0.00% | 0.00% |  |
| D | 42144 | 35674 | 0 | 0 | 0.00% | 0.00% | 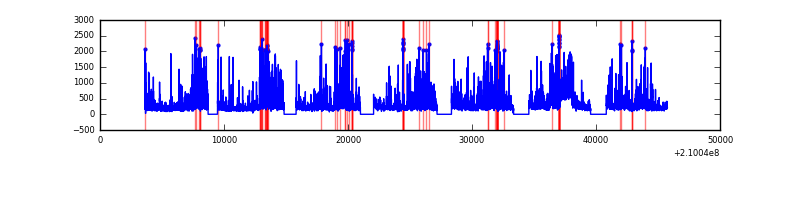 |
Top three noisy pixels from each quadrant. If the there are fewer than three noisy pixels in the level2.evt file, extra rows are filled as -1
| Pixel properties | Quadrant properties | ||||||
|---|---|---|---|---|---|---|---|
| Quadrant | DetID | PixID | Counts | Sigma | Mean | Median | Sigma |
| A | 0 | 29 | 1961 | 10.82 | 531 | 500 | 135.0 |
| A | 7 | 110 | 1724 | 9.06 | 531 | 500 | 135.0 |
| A | 0 | 30 | 1582 | 8.01 | 531 | 500 | 135.0 |
| B | 2 | 9 | 1699 | 11.45 | 520 | 495 | 105.2 |
| B | 12 | 226 | 1405 | 8.65 | 520 | 495 | 105.2 |
| B | 14 | 254 | 1370 | 8.32 | 520 | 495 | 105.2 |
| C | 1 | 81 | 1525 | 7.33 | 530 | 492 | 141.0 |
| C | 1 | 80 | 1509 | 7.21 | 530 | 492 | 141.0 |
| C | 1 | 65 | 1400 | 6.44 | 530 | 492 | 141.0 |
| D | 11 | 82 | 1427 | 7.39 | 491 | 447 | 132.6 |
| D | 6 | 231 | 1272 | 6.22 | 491 | 447 | 132.6 |
| D | 3 | 14 | 1260 | 6.13 | 491 | 447 | 132.6 |
Histogram calculated using DETX and DETY for each event in the final _common_clean file
| Quadrant A |  |
 |
Quadrant B |
|---|---|---|---|
| Quadrant D | 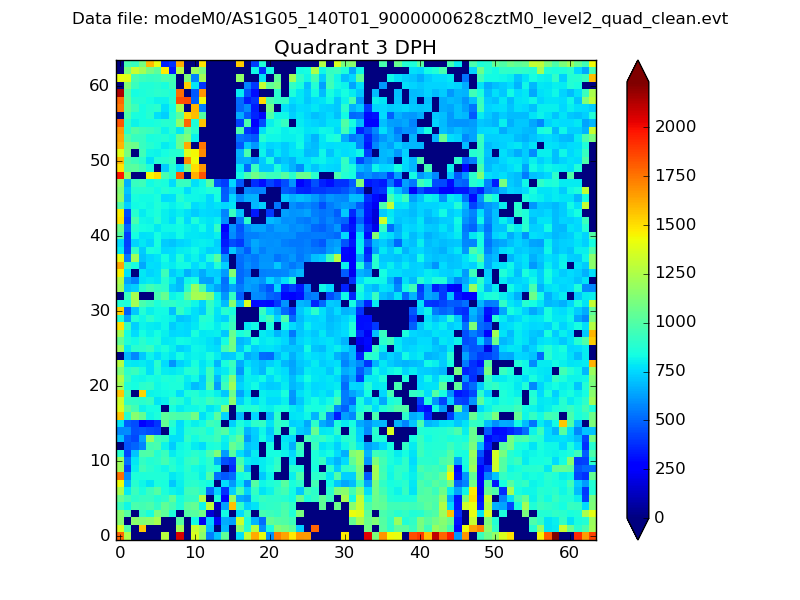 |
 |
Quadrant C |
| Plot type | Count rate plots | Images |
|---|---|---|
| Comparison with Poisson distribution Blue bars denote a histogram of data divided into 1 sec bins. Red curve is a Poisson curve with rate = median count rate of data. |
 |
 |
| Quadrant-wise count rates Data is divided into 100 sec bins |
 |
|
| Module-wise count rates for Quadrant A Data is divided into 100 sec bins |
 |
 |
| Module-wise count rates for Quadrant B Data is divided into 100 sec bins |
 |
 |
| Module-wise count rates for Quadrant C Data is divided into 100 sec bins |
 |
 |
| Module-wise count rates for Quadrant D Data is divided into 100 sec bins |
 |
 |
| Parameter | Plot |
|---|---|
| CZT HV Monitor |  |
| D_VDD |  |
| Temperature 1 |  |
| Veto HV Monitor |  |
| Veto LLD |  |
| Alpha Counter |  |
| _CPM_Rate |  |
| CZT Counter |  |
| +2.5 Volts monitor |  |
| +5 Volts monitor |  |
| _ROLL_ROT |  |
| _Roll_DEC |  |
| _Roll_RA |  |
| Veto Counter |  |