| Param | Original file | Final file |
|---|---|---|
| Filename | modeM0/AS1G05_140T01_9000000628_04958cztM0_level2.evt | modeM0/AS1G05_140T01_9000000628_04958cztM0_level2_quad_clean.evt |
| Size (bytes) | 444,170,880 | 62,616,960 |
| Size | 423.6 MB | 59.7 MB |
| Events in quadrant A | 3,067,115 | 360,340 |
| Events in quadrant B | 3,295,544 | 359,422 |
| Events in quadrant C | 2,901,340 | 366,409 |
| Events in quadrant D | 3,731,638 | 341,995 |
| Mode M0 | |||
|---|---|---|---|
| Quadrant | BADHDUFLAG | Total packets | Discarded packets |
| A | 0 | 13942 | 2 |
| B | 0 | 14283 | 1 |
| C | 0 | 13575 | 1 |
| D | 0 | 15986 | 1 |
| Mode M9 | |||
|---|---|---|---|
| Quadrant | BADHDUFLAG | Total packets | Discarded packets |
| A | 0 | 7 | 0 |
| B | 0 | 7 | 0 |
| C | 0 | 7 | 0 |
| D | 0 | 7 | 0 |
| Mode SS | |||
|---|---|---|---|
| Quadrant | BADHDUFLAG | Total packets | Discarded packets |
| A | 0 | 136 | 0 |
| B | 0 | 136 | 0 |
| C | 0 | 136 | 0 |
| D | 0 | 136 | 0 |
| Quadrant | Total seconds | Saturated seconds | Saturation percentage |
|---|---|---|---|
| A | 6707 | 57 | 0.849858% |
| B | 6707 | 72 | 1.073505% |
| C | 6707 | 37 | 0.551662% |
| D | 6707 | 200 | 2.981959% |
Noise dominated data is calculated using 1-second bins in cleaned event files. If a bin has >2000 counts, and if more than 50% of those come from <1% of pixels, then it is considered to be noise-dominated and hence unusable.
| Quadrant | # 1 sec bins | Bins with >0 counts | Bins with >2000 counts | High rate bins dominated by noise | Noise dominated (total time) | Noise dominated (detector-on time) | Marked lightcurve |
|---|---|---|---|---|---|---|---|
| A | 7467 | 6707 | 3 | 3 | 0.04% | 0.04% | 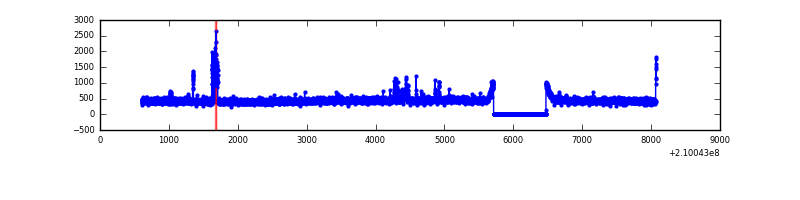 |
| B | 7467 | 6707 | 13 | 13 | 0.17% | 0.19% | 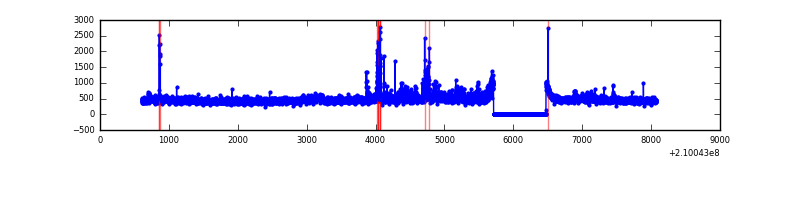 |
| C | 7467 | 6707 | 0 | 0 | 0.00% | 0.00% | 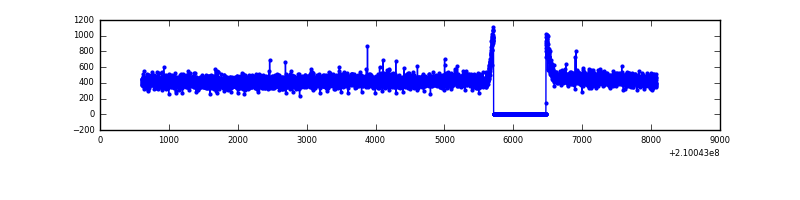 |
| D | 7467 | 6707 | 144 | 144 | 1.93% | 2.15% | 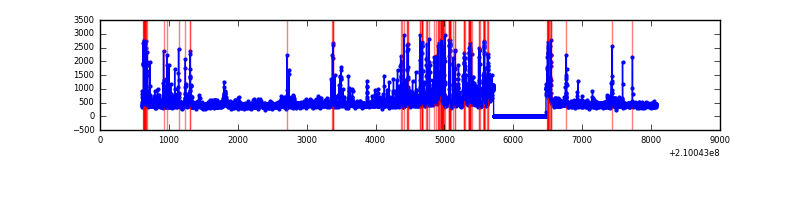 |
Top three noisy pixels from each quadrant. If the there are fewer than three noisy pixels in the level2.evt file, extra rows are filled as -1
| Pixel properties | Quadrant properties | ||||||
|---|---|---|---|---|---|---|---|
| Quadrant | DetID | PixID | Counts | Sigma | Mean | Median | Sigma |
| A | 0 | 50 | 92439 | 594.59 | 754 | 737 | 154.2 |
| A | 13 | 251 | 27131 | 171.14 | 754 | 737 | 154.2 |
| A | 0 | 31 | 24074 | 151.32 | 754 | 737 | 154.2 |
| B | 15 | 204 | 109023 | 735.68 | 765 | 746 | 147.2 |
| B | 15 | 54 | 85592 | 576.48 | 765 | 746 | 147.2 |
| B | 0 | 219 | 47823 | 319.86 | 765 | 746 | 147.2 |
| C | 8 | 128 | 7181 | 37.29 | 739 | 741 | 172.7 |
| C | 13 | 61 | 6069 | 30.85 | 739 | 741 | 172.7 |
| C | 12 | 4 | 4457 | 21.52 | 739 | 741 | 172.7 |
| D | 2 | 33 | 356394 | 1986.74 | 726 | 701 | 179.0 |
| D | 2 | 136 | 206777 | 1151.05 | 726 | 701 | 179.0 |
| D | 13 | 235 | 157308 | 874.73 | 726 | 701 | 179.0 |
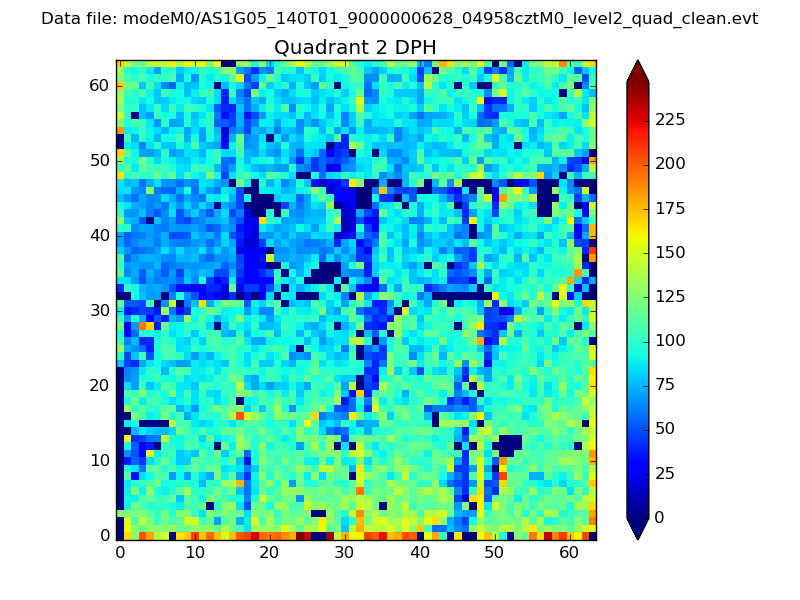
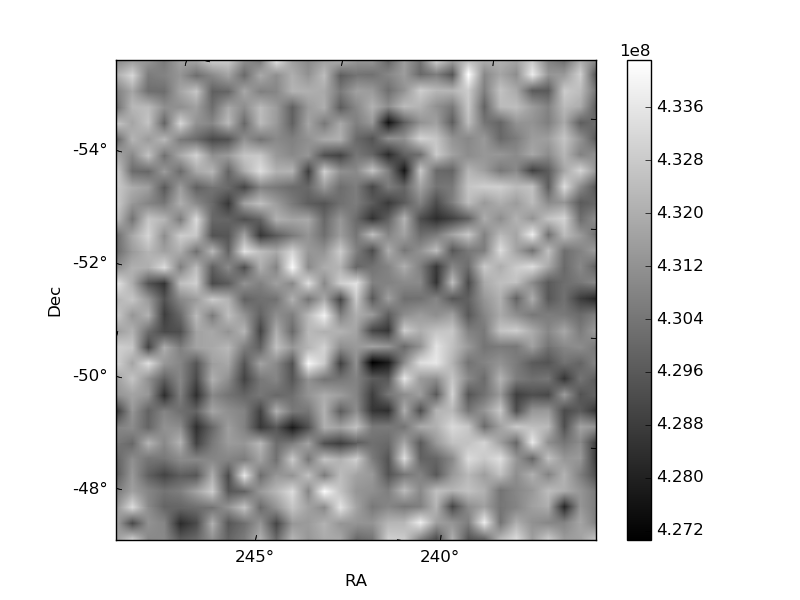
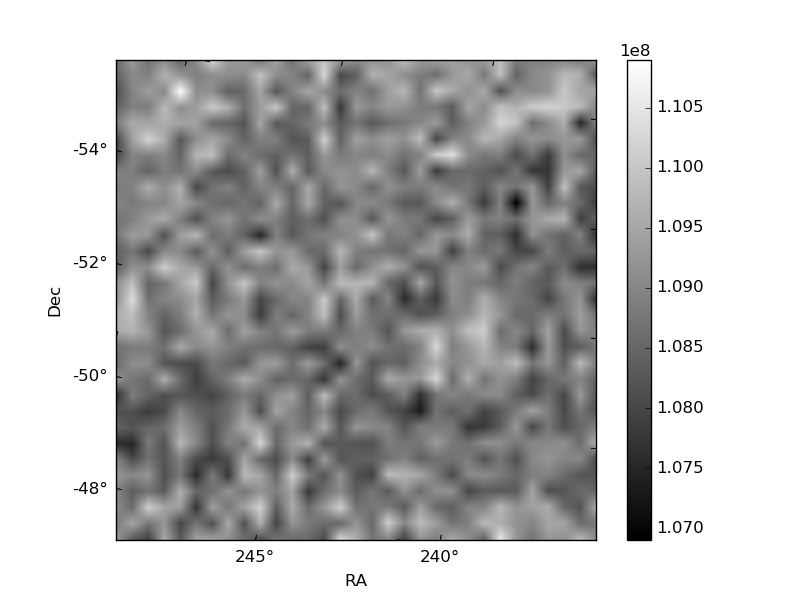
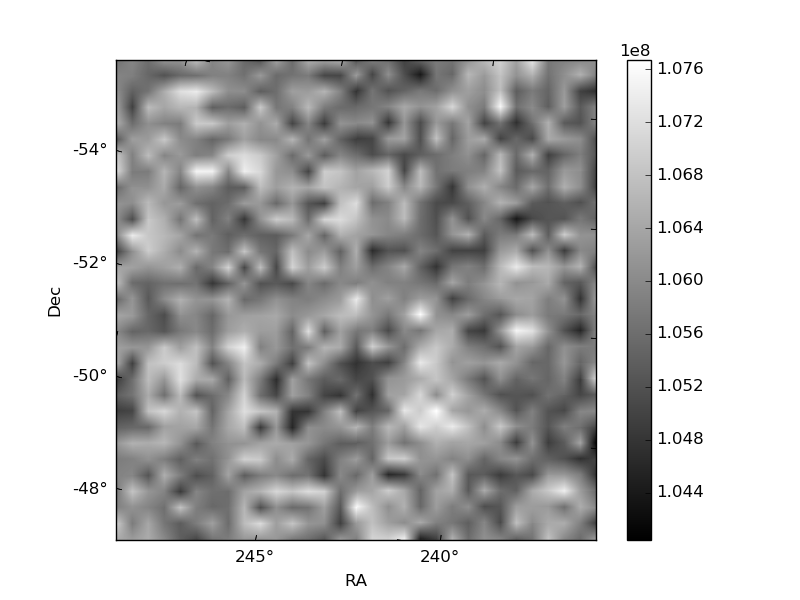
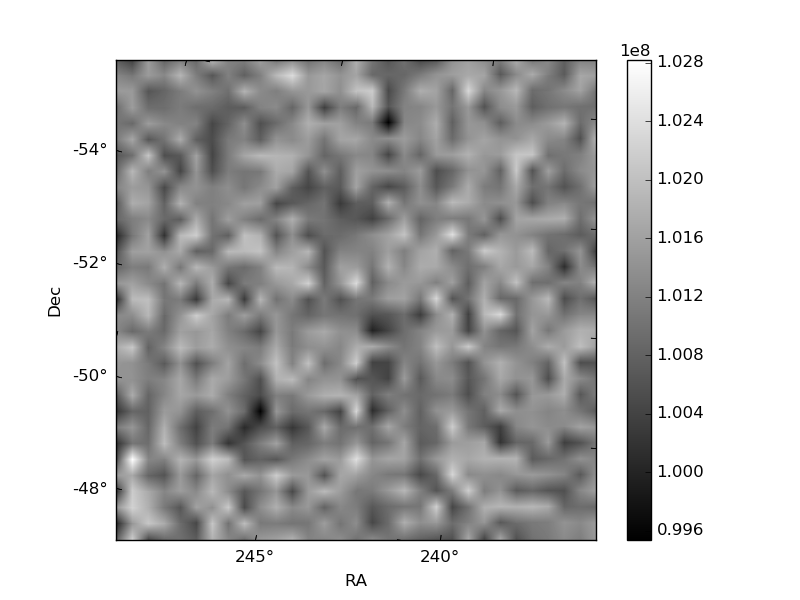
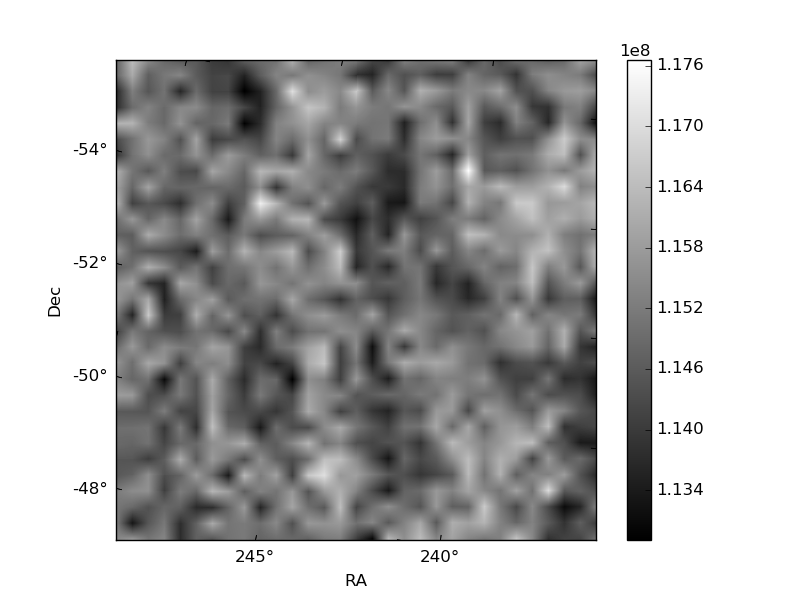
Histogram calculated using DETX and DETY for each event in the final _common_clean file
| Quadrant A | 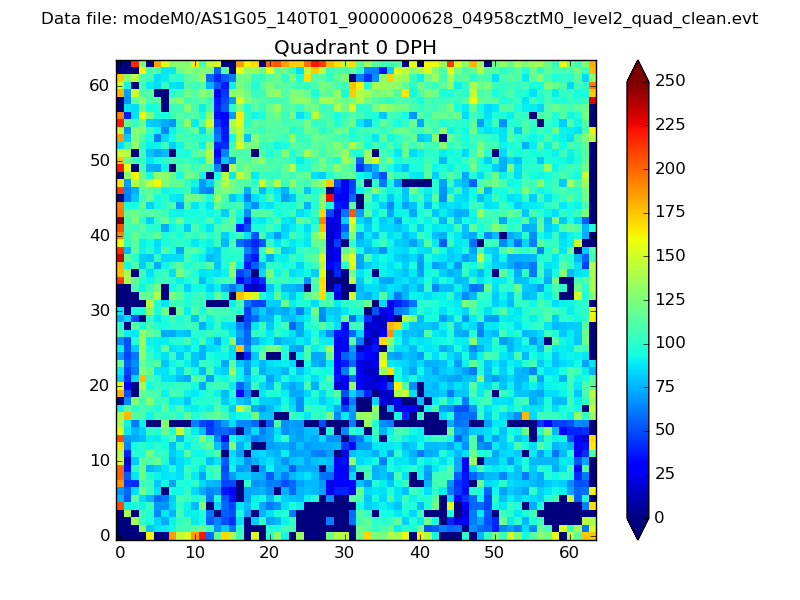 |
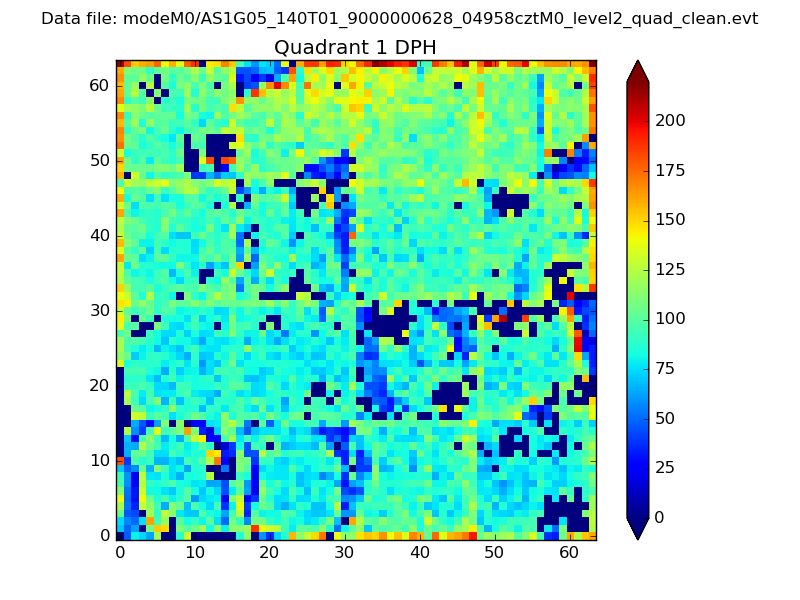 |
Quadrant B |
|---|---|---|---|
| Quadrant D | 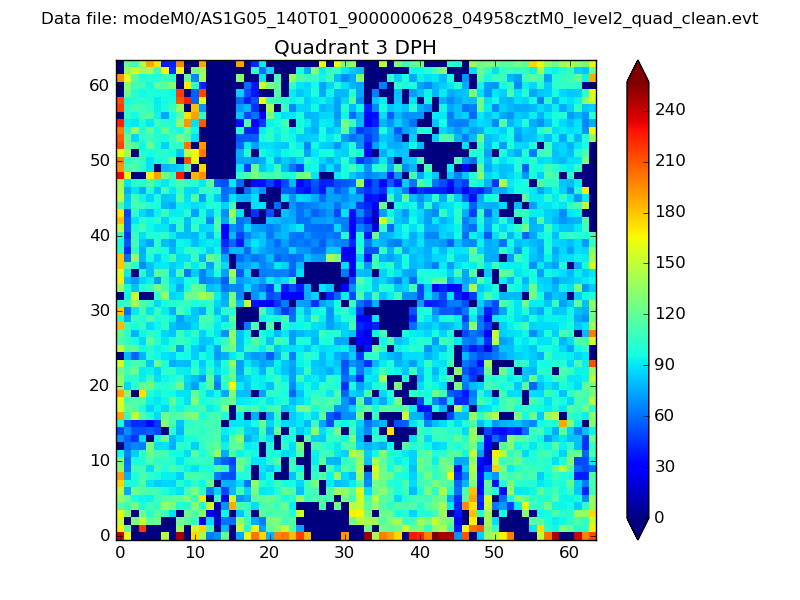 |
 |
Quadrant C |
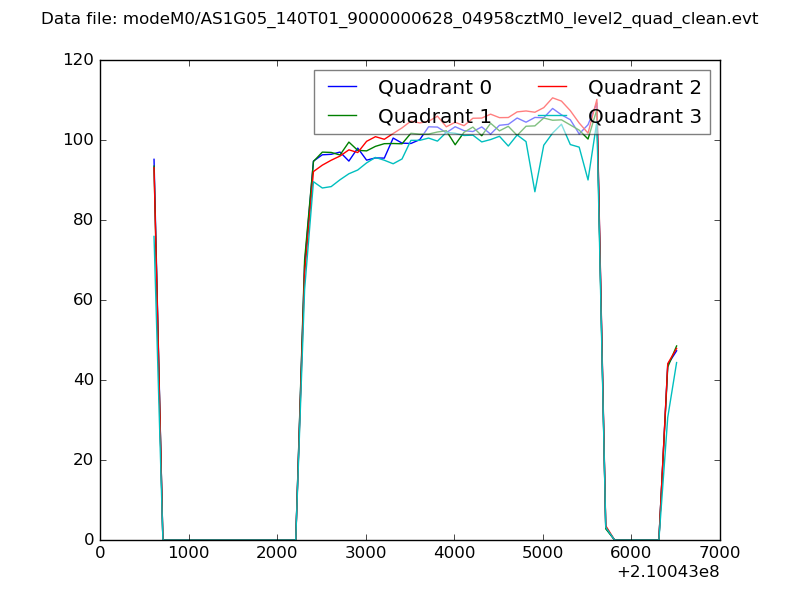
| Plot type | Count rate plots | Images |
|---|---|---|
| Comparison with Poisson distribution Blue bars denote a histogram of data divided into 1 sec bins. Red curve is a Poisson curve with rate = median count rate of data. |
 |
 |
| Quadrant-wise count rates Data is divided into 100 sec bins |
 |
|
| Module-wise count rates for Quadrant A Data is divided into 100 sec bins |
 |
 |
| Module-wise count rates for Quadrant B Data is divided into 100 sec bins |
 |
 |
| Module-wise count rates for Quadrant C Data is divided into 100 sec bins |
 |
 |
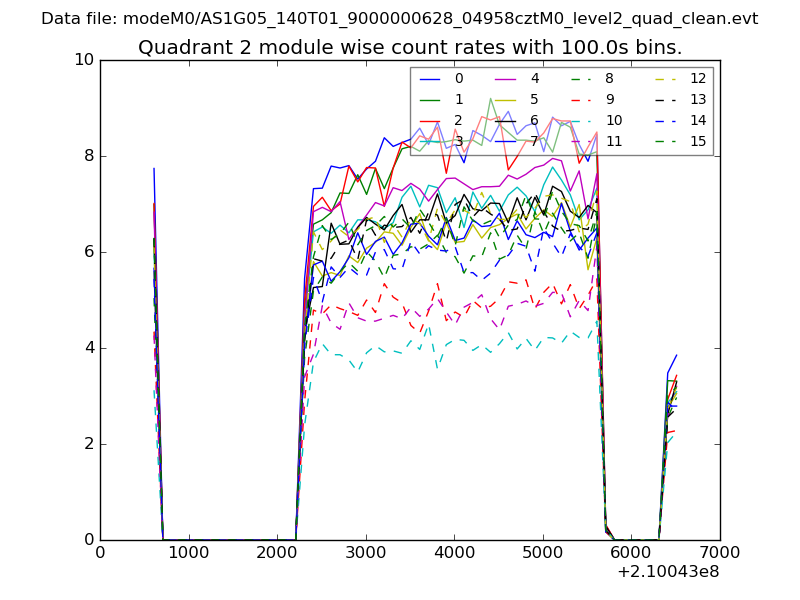
| Module-wise count rates for Quadrant D Data is divided into 100 sec bins |
 |
 |
| Parameter | Plot |
|---|---|
| CZT HV Monitor | 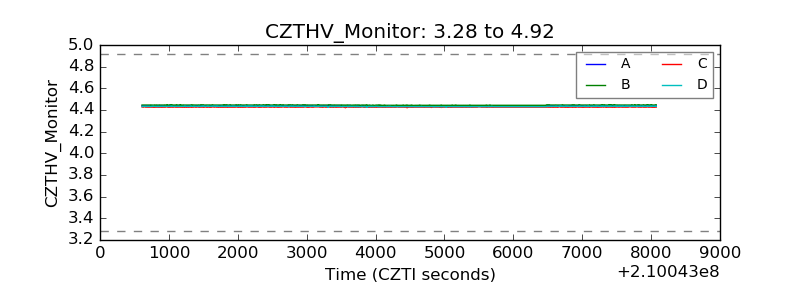 |
| D_VDD | 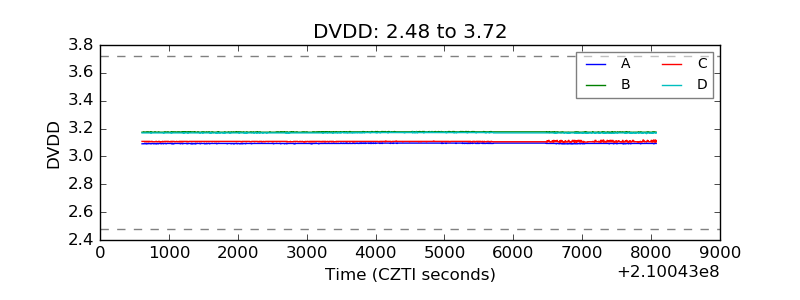 |
| Temperature 1 | 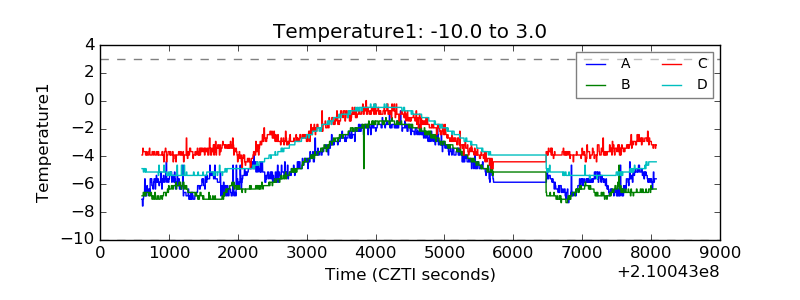 |
| Veto HV Monitor | 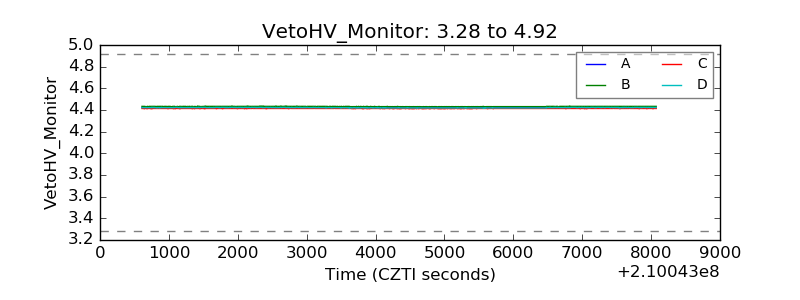 |
| Veto LLD | 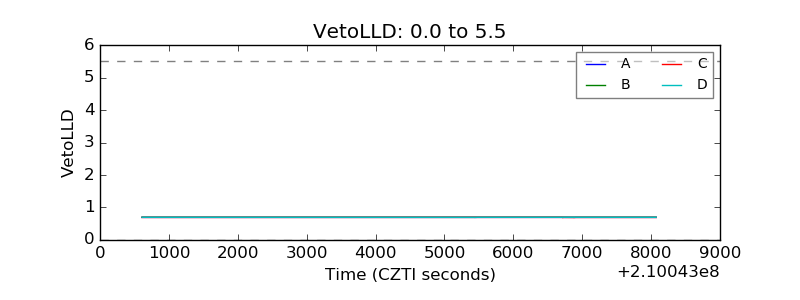 |
| Alpha Counter | 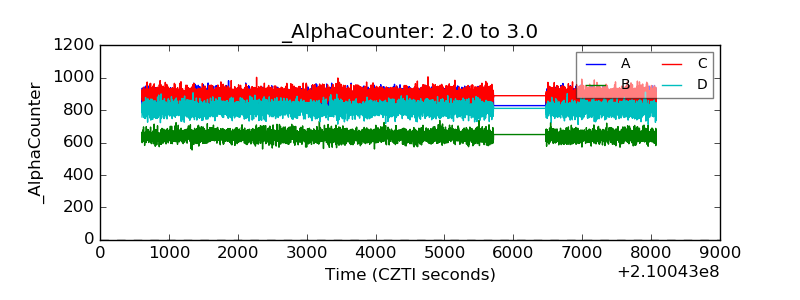 |
| _CPM_Rate | 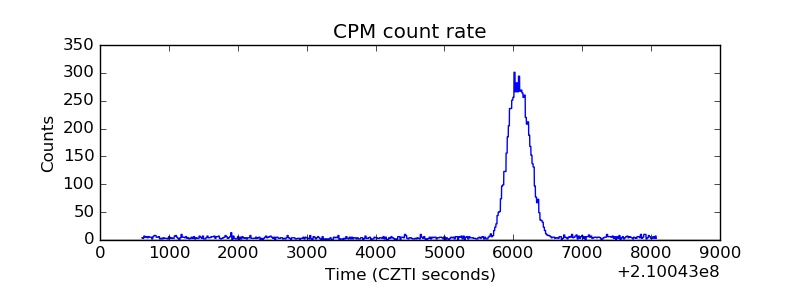 |
| CZT Counter | 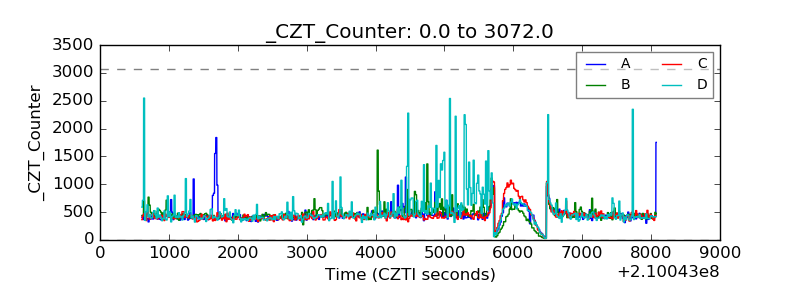 |
| +2.5 Volts monitor | 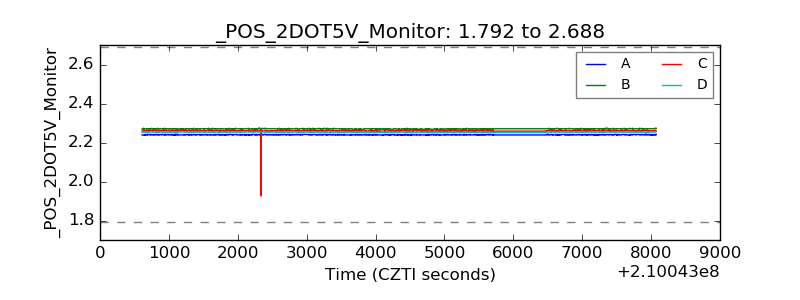 |
| +5 Volts monitor |  |
| _ROLL_ROT | 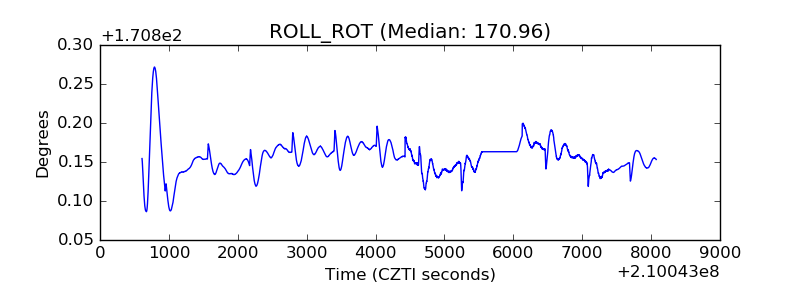 |
| _Roll_DEC | 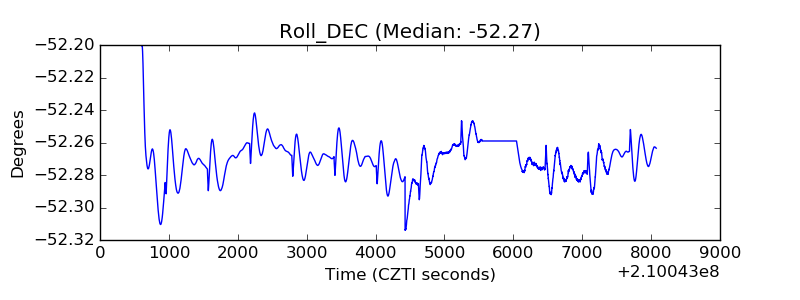 |
| _Roll_RA | 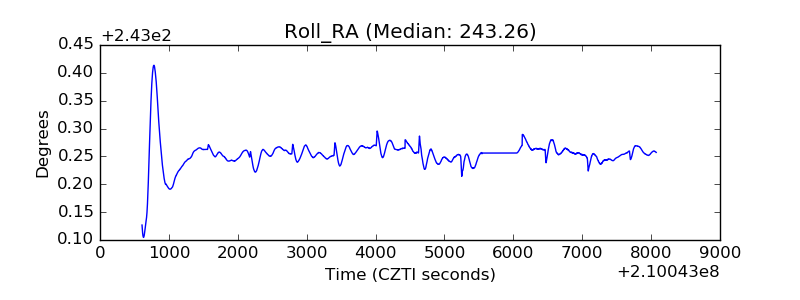 |
| Veto Counter | 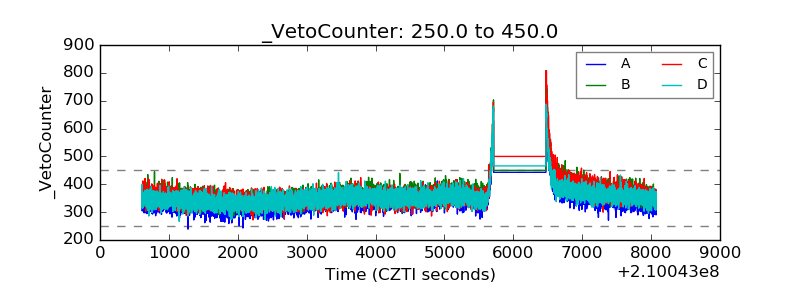 |