| Param | Original file | Final file |
|---|---|---|
| Filename | modeM0/AS1G05_140T01_9000000628_04959cztM0_level2.evt | modeM0/AS1G05_140T01_9000000628_04959cztM0_level2_quad_clean.evt |
| Size (bytes) | 458,383,680 | 68,256,000 |
| Size | 437.1 MB | 65.1 MB |
| Events in quadrant A | 3,106,213 | 402,516 |
| Events in quadrant B | 3,220,550 | 402,118 |
| Events in quadrant C | 3,015,775 | 406,915 |
| Events in quadrant D | 4,076,128 | 379,803 |
| Mode M0 | |||
|---|---|---|---|
| Quadrant | BADHDUFLAG | Total packets | Discarded packets |
| A | 0 | 14041 | 3 |
| B | 0 | 14057 | 2 |
| C | 0 | 13820 | 2 |
| D | 0 | 16962 | 2 |
| Mode M9 | |||
|---|---|---|---|
| Quadrant | BADHDUFLAG | Total packets | Discarded packets |
| A | 0 | 11 | 0 |
| B | 0 | 11 | 0 |
| C | 0 | 11 | 0 |
| D | 0 | 12 | 0 |
| Mode SS | |||
|---|---|---|---|
| Quadrant | BADHDUFLAG | Total packets | Discarded packets |
| A | 0 | 138 | 0 |
| B | 0 | 138 | 0 |
| C | 0 | 138 | 0 |
| D | 0 | 138 | 0 |
| Quadrant | Total seconds | Saturated seconds | Saturation percentage |
|---|---|---|---|
| A | 6820 | 48 | 0.703812% |
| B | 6820 | 38 | 0.557185% |
| C | 6820 | 29 | 0.425220% |
| D | 6820 | 243 | 3.563050% |
Noise dominated data is calculated using 1-second bins in cleaned event files. If a bin has >2000 counts, and if more than 50% of those come from <1% of pixels, then it is considered to be noise-dominated and hence unusable.
| Quadrant | # 1 sec bins | Bins with >0 counts | Bins with >2000 counts | High rate bins dominated by noise | Noise dominated (total time) | Noise dominated (detector-on time) | Marked lightcurve |
|---|---|---|---|---|---|---|---|
| A | 7795 | 6821 | 6 | 6 | 0.08% | 0.09% | 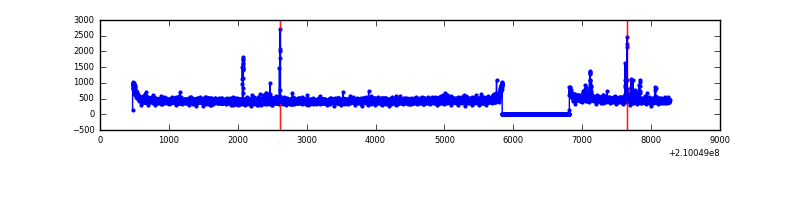 |
| B | 7795 | 6820 | 1 | 1 | 0.01% | 0.01% | 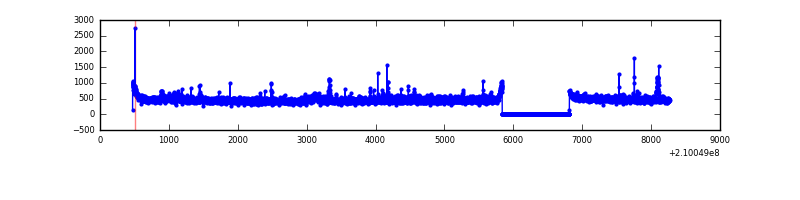 |
| C | 7795 | 6821 | 0 | 0 | 0.00% | 0.00% | 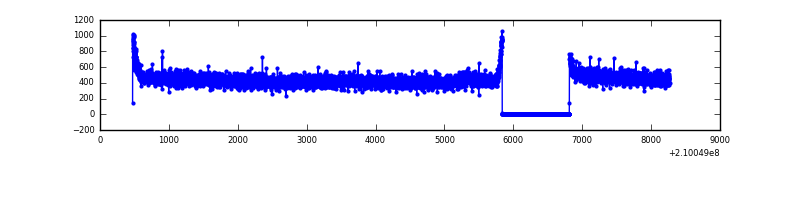 |
| D | 7795 | 6820 | 207 | 207 | 2.66% | 3.04% | 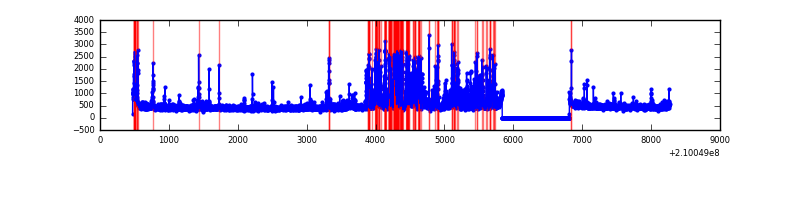 |
Top three noisy pixels from each quadrant. If the there are fewer than three noisy pixels in the level2.evt file, extra rows are filled as -1
| Pixel properties | Quadrant properties | ||||||
|---|---|---|---|---|---|---|---|
| Quadrant | DetID | PixID | Counts | Sigma | Mean | Median | Sigma |
| A | 0 | 31 | 64434 | 396.73 | 783 | 765 | 160.5 |
| A | 13 | 251 | 13481 | 79.24 | 783 | 765 | 160.5 |
| A | 15 | 234 | 12567 | 73.54 | 783 | 765 | 160.5 |
| B | 10 | 249 | 52750 | 343.9 | 792 | 774 | 151.1 |
| B | 15 | 204 | 42706 | 277.45 | 792 | 774 | 151.1 |
| B | 0 | 219 | 33971 | 219.65 | 792 | 774 | 151.1 |
| C | 8 | 128 | 8060 | 40.67 | 769 | 771 | 179.2 |
| C | 13 | 61 | 6255 | 30.6 | 769 | 771 | 179.2 |
| C | 8 | 112 | 3768 | 16.72 | 769 | 771 | 179.2 |
| D | 2 | 33 | 557556 | 3060.52 | 751 | 727 | 181.9 |
| D | 2 | 136 | 176831 | 967.93 | 751 | 727 | 181.9 |
| D | 13 | 235 | 171159 | 936.75 | 751 | 727 | 181.9 |
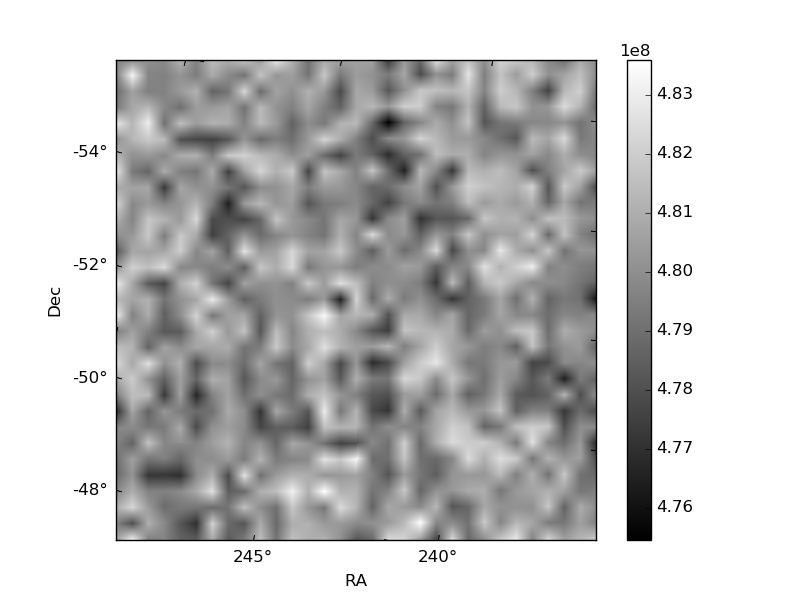
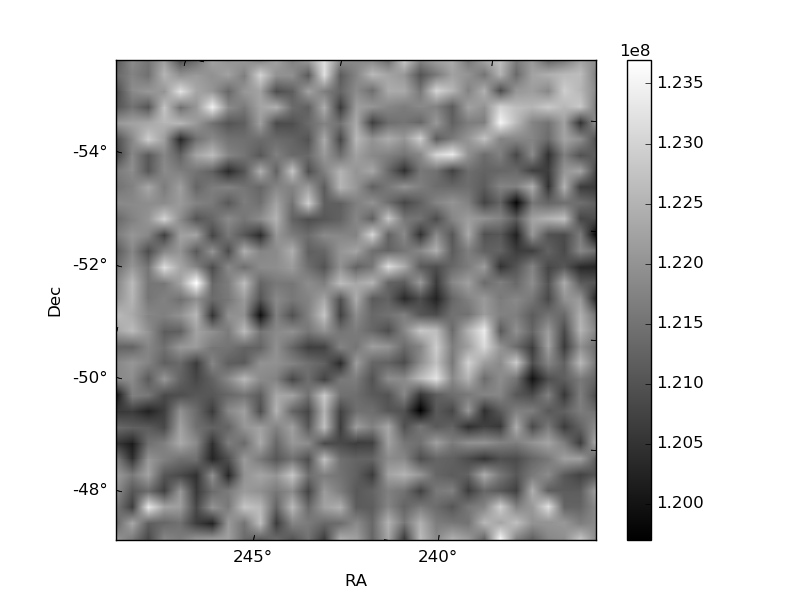
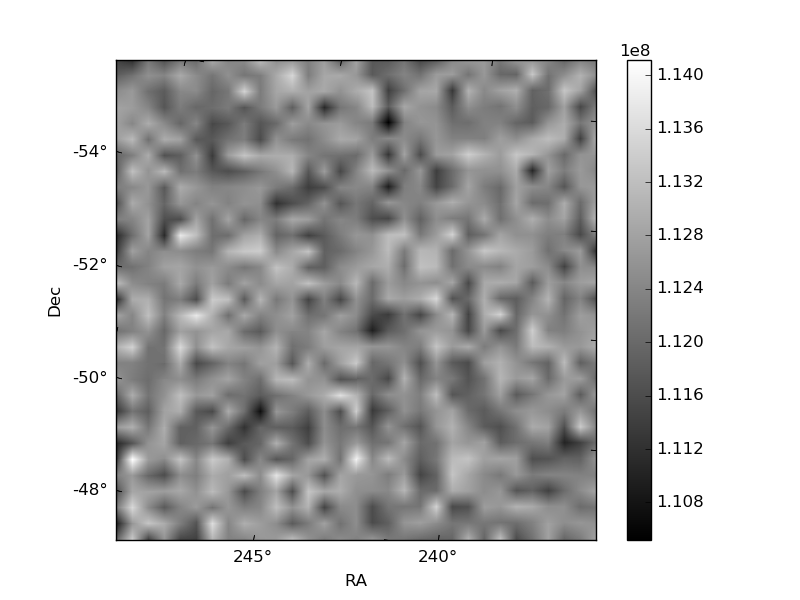
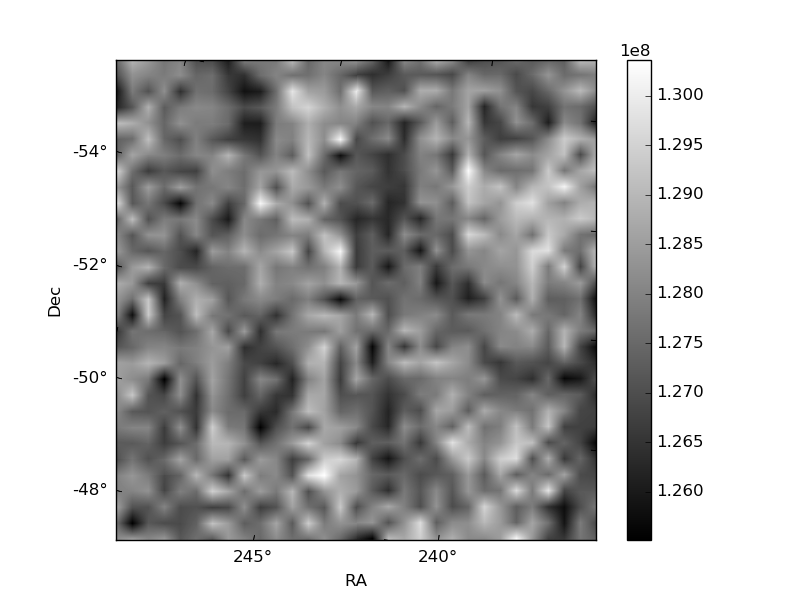
Histogram calculated using DETX and DETY for each event in the final _common_clean file
| Quadrant A | 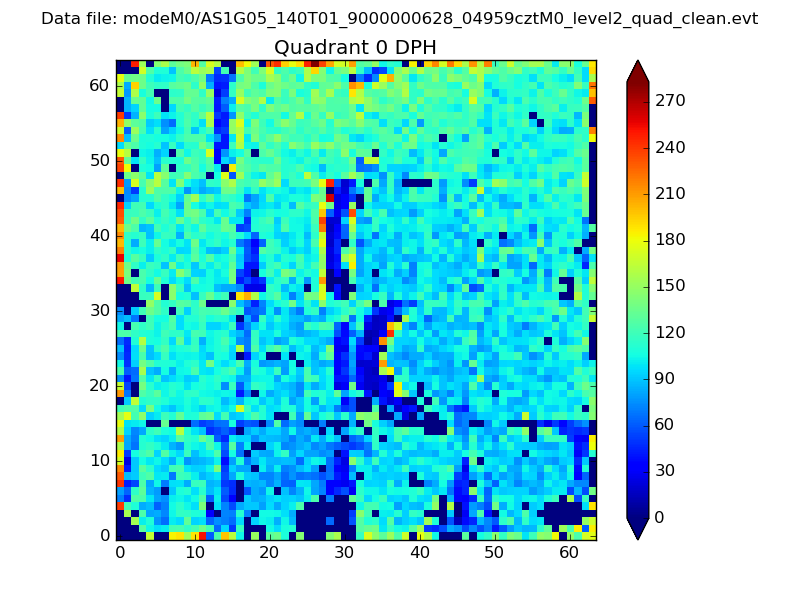 |
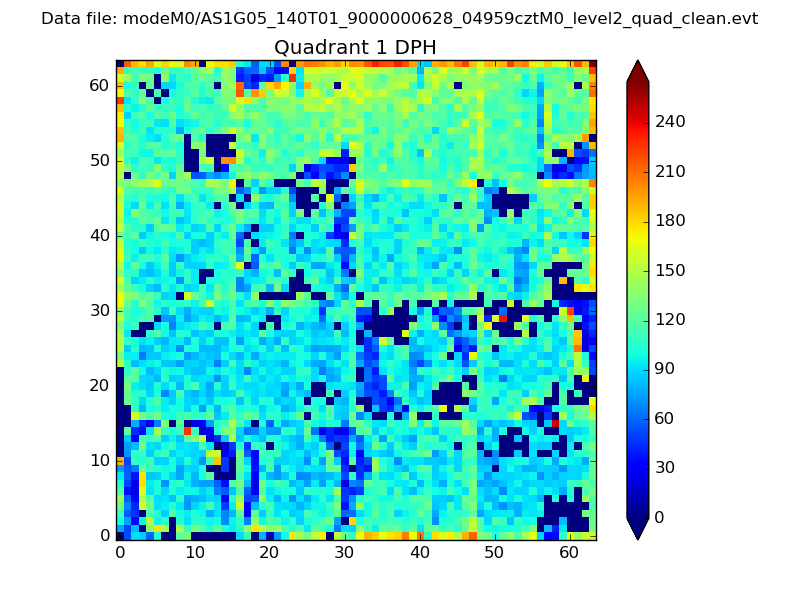 |
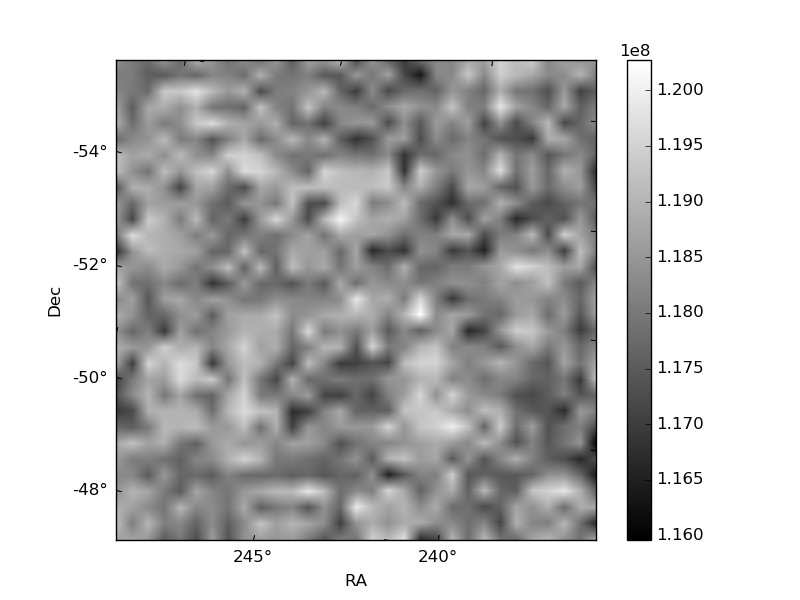
Quadrant B |
|---|---|---|---|
| Quadrant D | 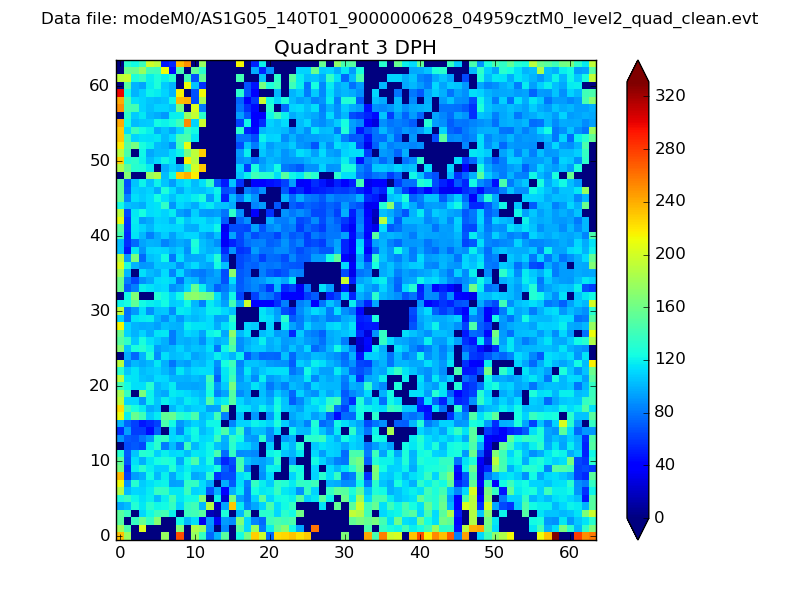 |
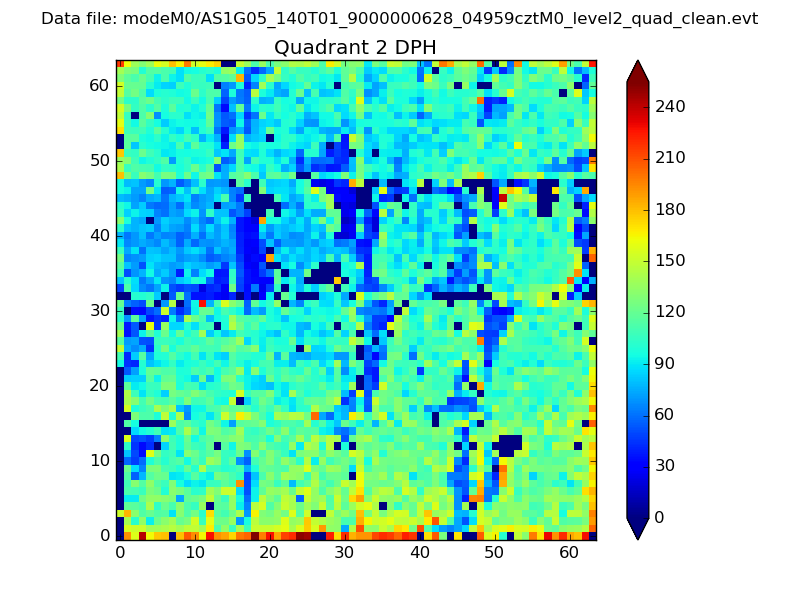 |
Quadrant C |
| Plot type | Count rate plots | Images |
|---|---|---|
| Comparison with Poisson distribution Blue bars denote a histogram of data divided into 1 sec bins. Red curve is a Poisson curve with rate = median count rate of data. |
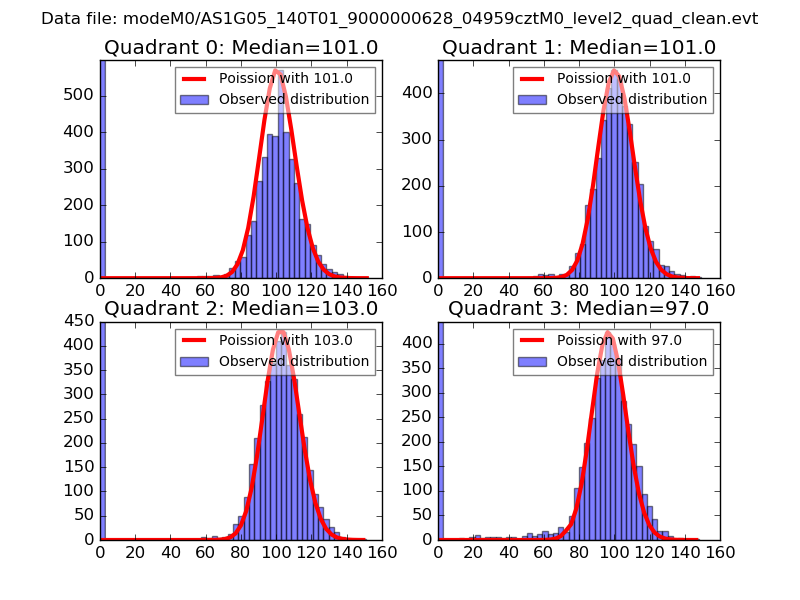 |
 |
| Quadrant-wise count rates Data is divided into 100 sec bins |
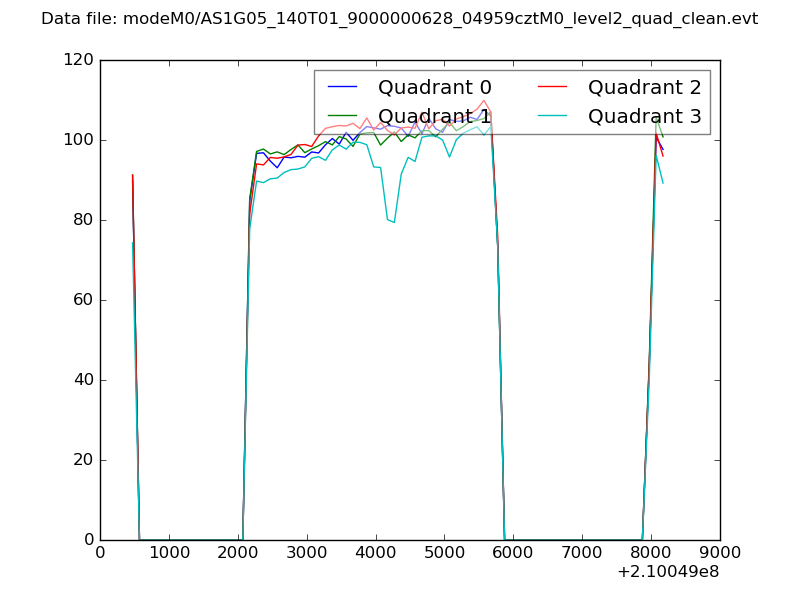 |
|
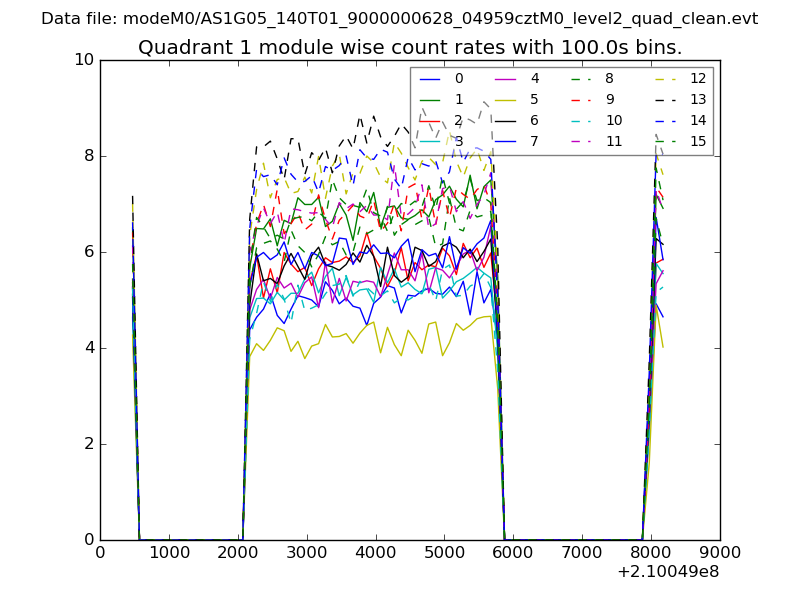
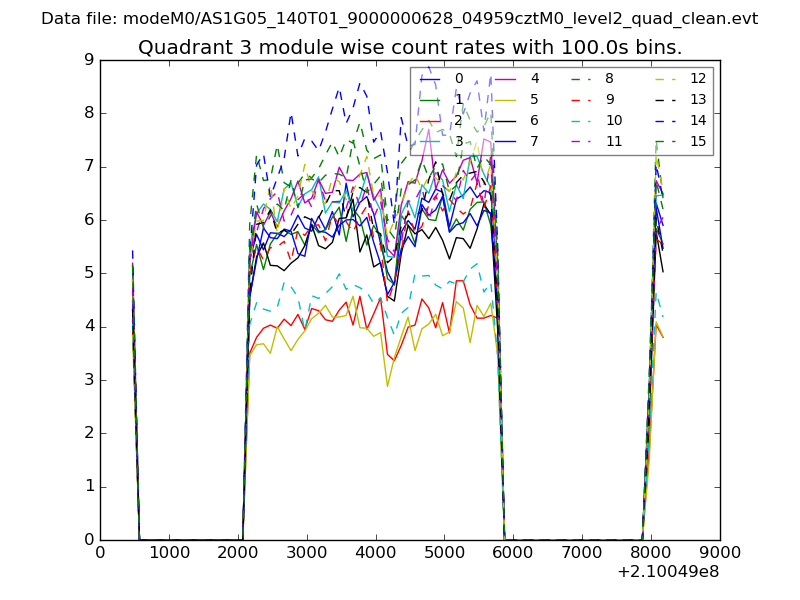
| Module-wise count rates for Quadrant A Data is divided into 100 sec bins |
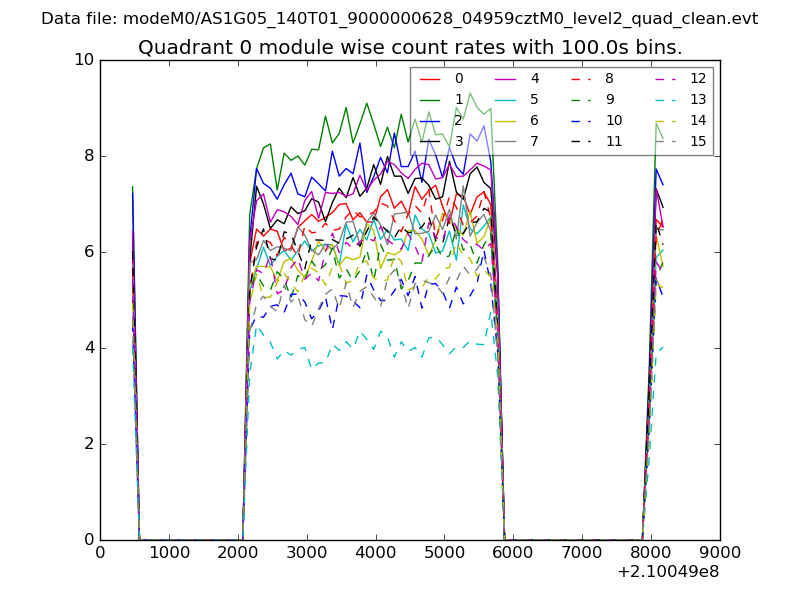 |
 |
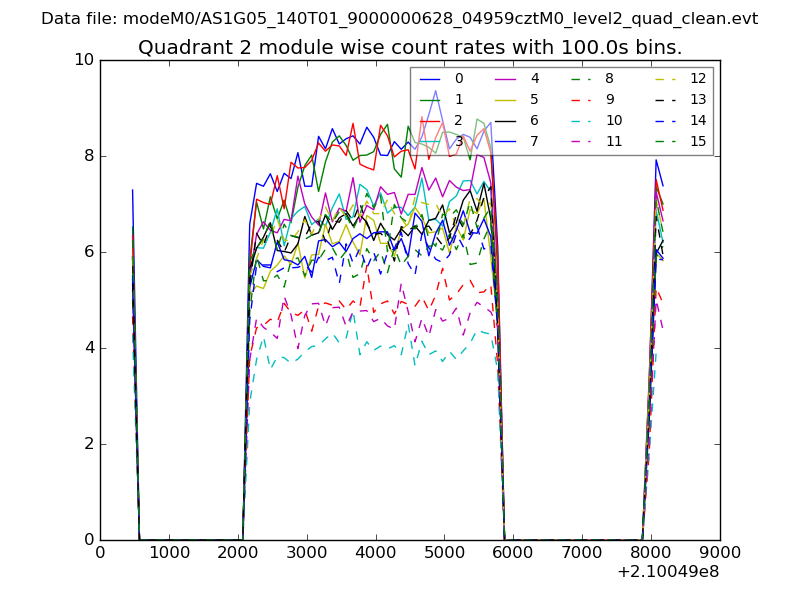
| Module-wise count rates for Quadrant B Data is divided into 100 sec bins |
 |
 |
| Module-wise count rates for Quadrant C Data is divided into 100 sec bins |
 |
 |
| Module-wise count rates for Quadrant D Data is divided into 100 sec bins |
 |
 |
| Parameter | Plot |
|---|---|
| CZT HV Monitor | 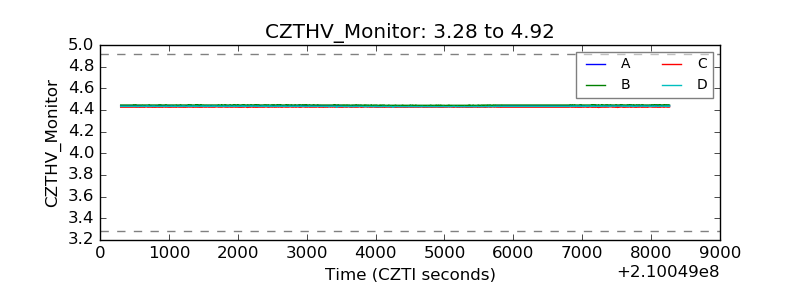 |
| D_VDD | 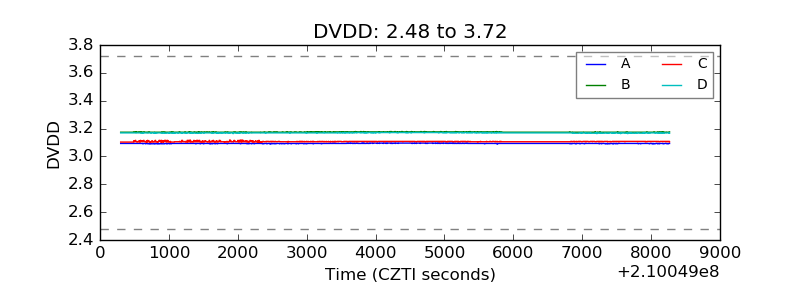 |
| Temperature 1 | 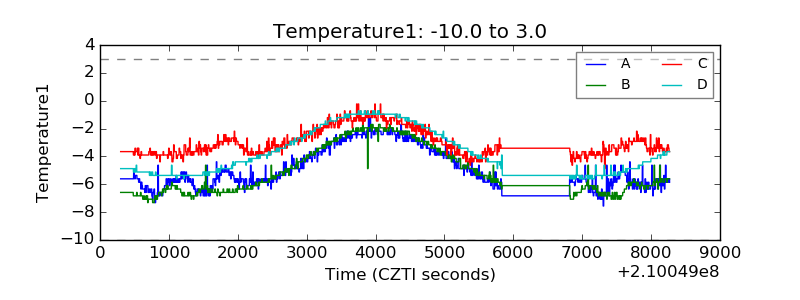 |
| Veto HV Monitor | 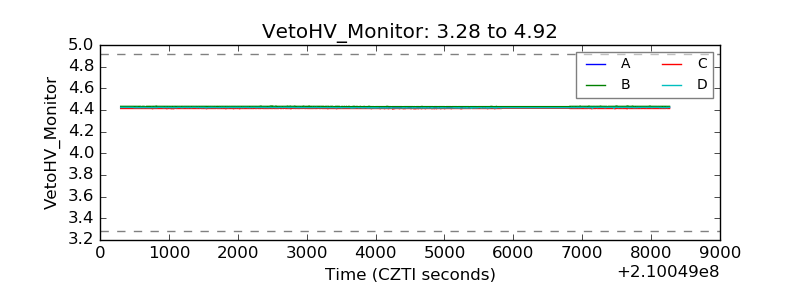 |
| Veto LLD | 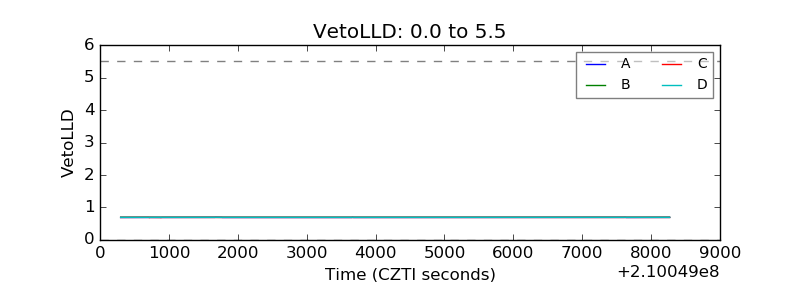 |
| Alpha Counter | 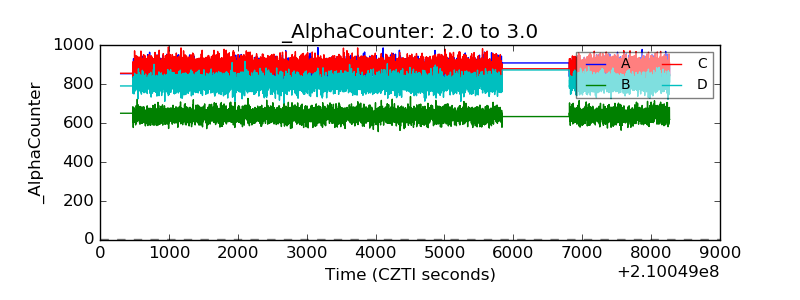 |
| _CPM_Rate | 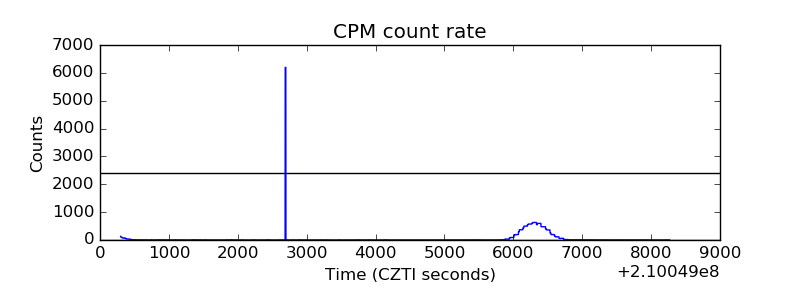 |
| CZT Counter | 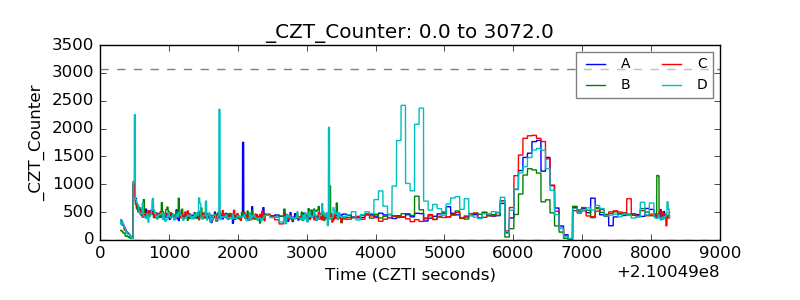 |
| +2.5 Volts monitor |  |
| +5 Volts monitor |  |
| _ROLL_ROT | 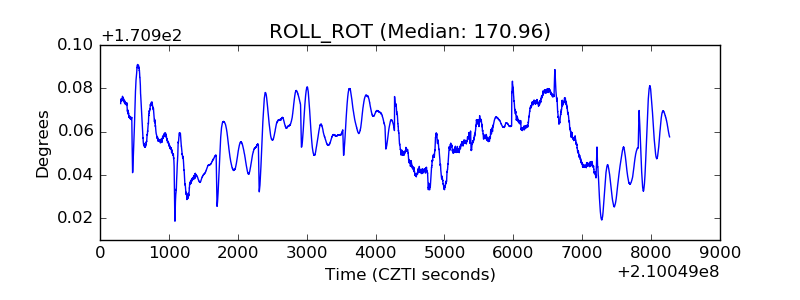 |
| _Roll_DEC | 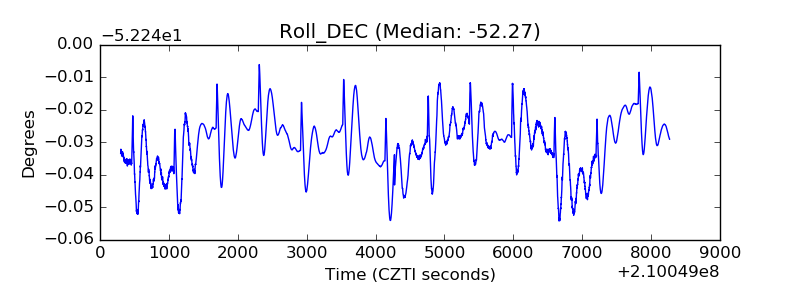 |
| _Roll_RA | 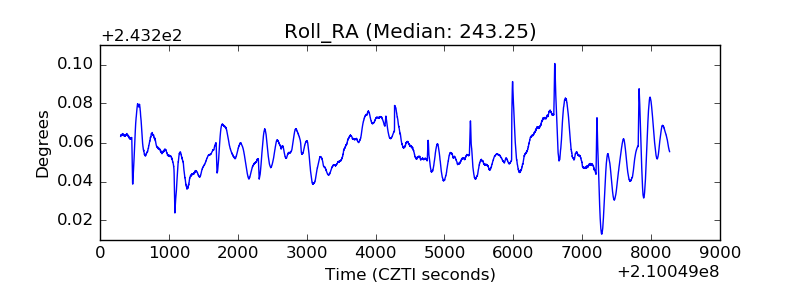 |
| Veto Counter | 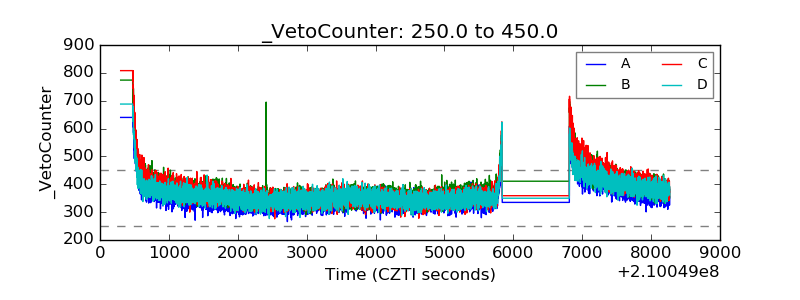 |