| Param | Original file | Final file |
|---|---|---|
| Filename | modeM0/AS1G05_140T01_9000000628_04960cztM0_level2.evt | modeM0/AS1G05_140T01_9000000628_04960cztM0_level2_quad_clean.evt |
| Size (bytes) | 442,244,160 | 77,567,040 |
| Size | 421.8 MB | 74.0 MB |
| Events in quadrant A | 3,133,663 | 474,422 |
| Events in quadrant B | 3,156,298 | 477,029 |
| Events in quadrant C | 2,989,237 | 480,737 |
| Events in quadrant D | 3,665,134 | 455,962 |
| Mode M0 | |||
|---|---|---|---|
| Quadrant | BADHDUFLAG | Total packets | Discarded packets |
| A | 0 | 13744 | 3 |
| B | 0 | 13679 | 2 |
| C | 0 | 13473 | 2 |
| D | 0 | 15319 | 2 |
| Mode M9 | |||
|---|---|---|---|
| Quadrant | BADHDUFLAG | Total packets | Discarded packets |
| A | 0 | 17 | 0 |
| B | 0 | 17 | 0 |
| C | 0 | 17 | 0 |
| D | 0 | 18 | 0 |
| Mode SS | |||
|---|---|---|---|
| Quadrant | BADHDUFLAG | Total packets | Discarded packets |
| A | 0 | 134 | 0 |
| B | 0 | 134 | 0 |
| C | 0 | 134 | 0 |
| D | 0 | 134 | 0 |
| Quadrant | Total seconds | Saturated seconds | Saturation percentage |
|---|---|---|---|
| A | 6606 | 73 | 1.105056% |
| B | 6606 | 64 | 0.968816% |
| C | 6606 | 61 | 0.923403% |
| D | 6606 | 104 | 1.574326% |
Noise dominated data is calculated using 1-second bins in cleaned event files. If a bin has >2000 counts, and if more than 50% of those come from <1% of pixels, then it is considered to be noise-dominated and hence unusable.
| Quadrant | # 1 sec bins | Bins with >0 counts | Bins with >2000 counts | High rate bins dominated by noise | Noise dominated (total time) | Noise dominated (detector-on time) | Marked lightcurve |
|---|---|---|---|---|---|---|---|
| A | 7666 | 6606 | 5 | 5 | 0.07% | 0.08% | 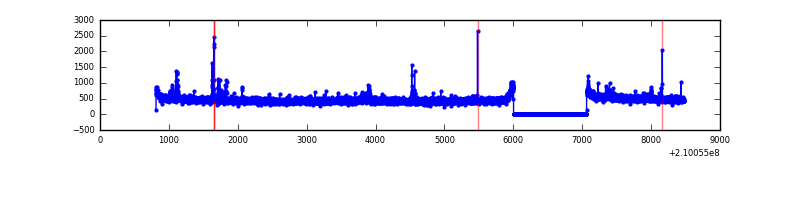 |
| B | 7666 | 6606 | 0 | 0 | 0.00% | 0.00% | 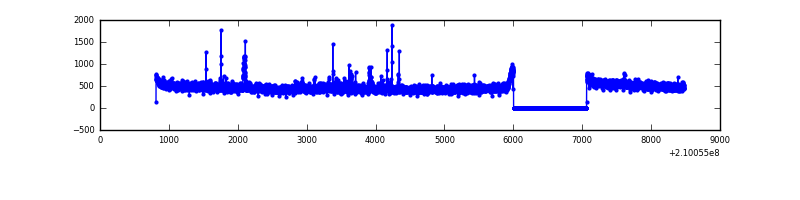 |
| C | 7666 | 6606 | 0 | 0 | 0.00% | 0.00% | 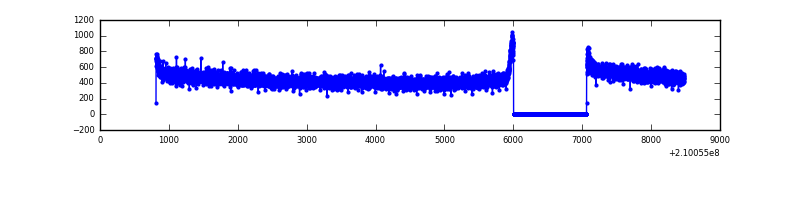 |
| D | 7666 | 6606 | 68 | 68 | 0.89% | 1.03% | 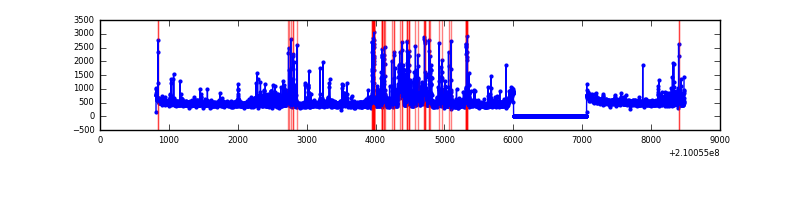 |
Top three noisy pixels from each quadrant. If the there are fewer than three noisy pixels in the level2.evt file, extra rows are filled as -1
| Pixel properties | Quadrant properties | ||||||
|---|---|---|---|---|---|---|---|
| Quadrant | DetID | PixID | Counts | Sigma | Mean | Median | Sigma |
| A | 13 | 251 | 61563 | 381.6 | 783 | 766 | 159.3 |
| A | 0 | 31 | 32279 | 197.79 | 783 | 766 | 159.3 |
| A | 15 | 234 | 13531 | 80.12 | 783 | 766 | 159.3 |
| B | 10 | 249 | 28578 | 183.56 | 789 | 770 | 151.5 |
| B | 15 | 204 | 25548 | 163.56 | 789 | 770 | 151.5 |
| B | 0 | 183 | 17696 | 111.73 | 789 | 770 | 151.5 |
| C | 13 | 61 | 6242 | 31.07 | 765 | 768 | 176.2 |
| C | 3 | 202 | 1928 | 6.58 | 765 | 768 | 176.2 |
| C | 7 | 247 | 1887 | 6.35 | 765 | 768 | 176.2 |
| D | 2 | 33 | 185232 | 991.99 | 760 | 736 | 186.0 |
| D | 7 | 67 | 138170 | 738.95 | 760 | 736 | 186.0 |
| D | 12 | 233 | 93293 | 497.65 | 760 | 736 | 186.0 |
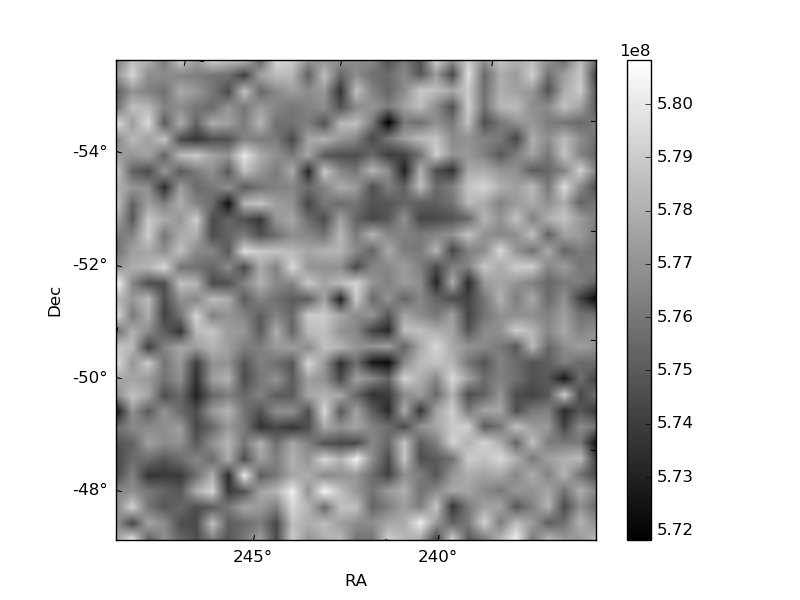
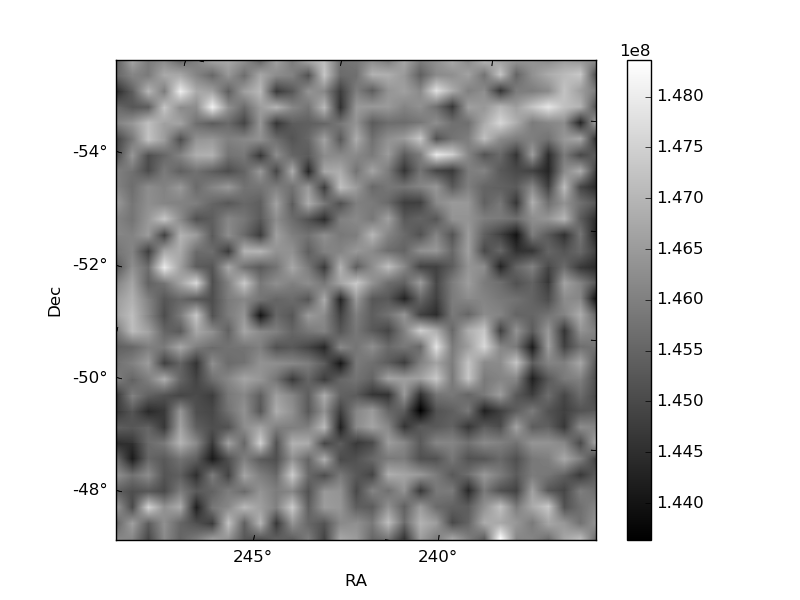
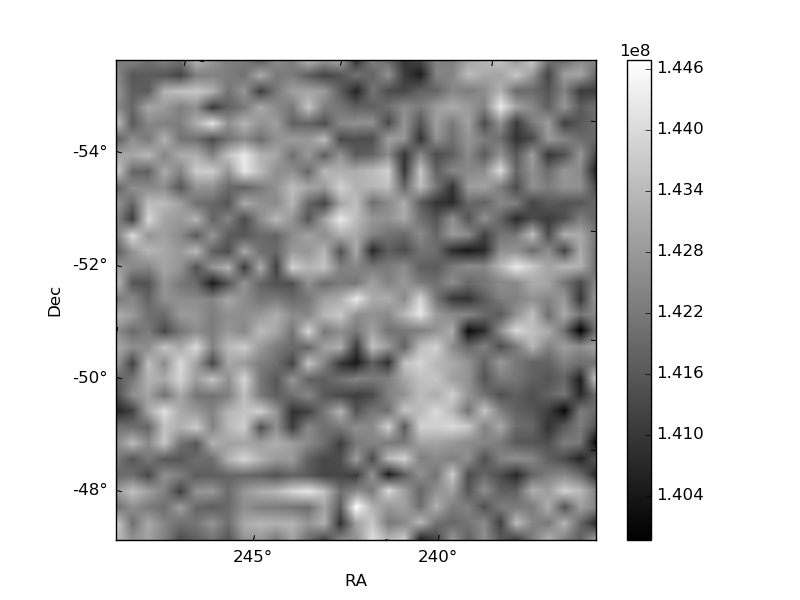
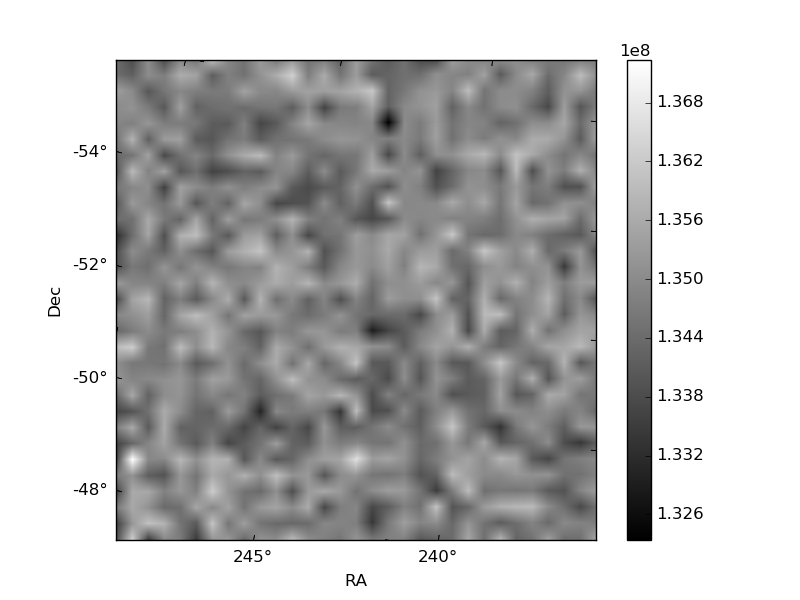
Histogram calculated using DETX and DETY for each event in the final _common_clean file
| Quadrant A | 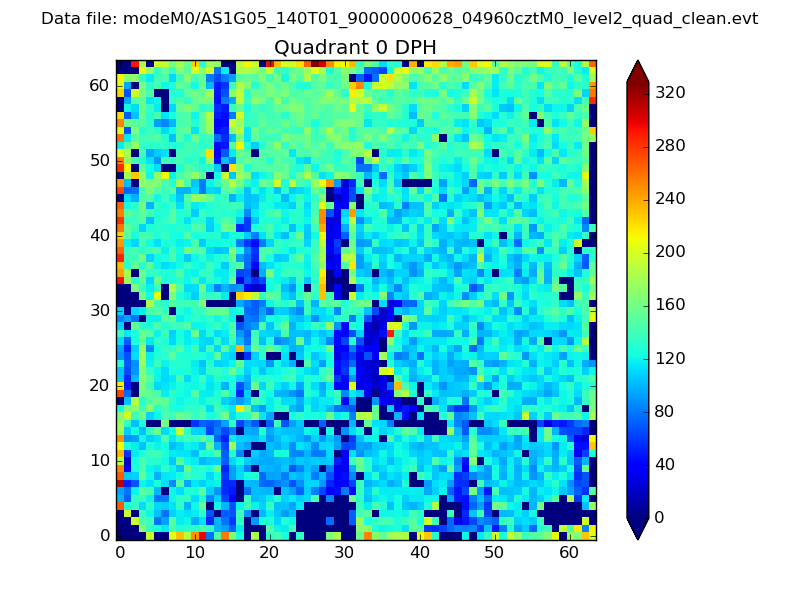 |
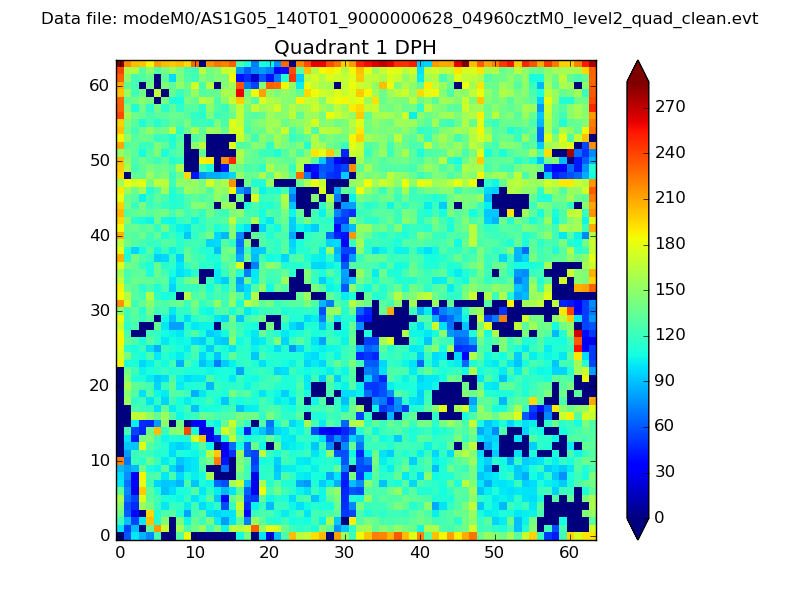 |
Quadrant B |
|---|---|---|---|
| Quadrant D | 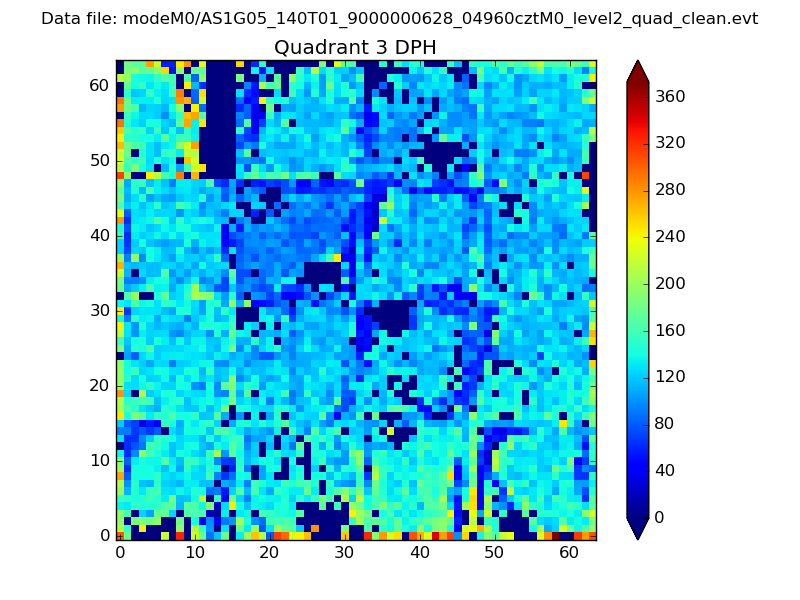 |
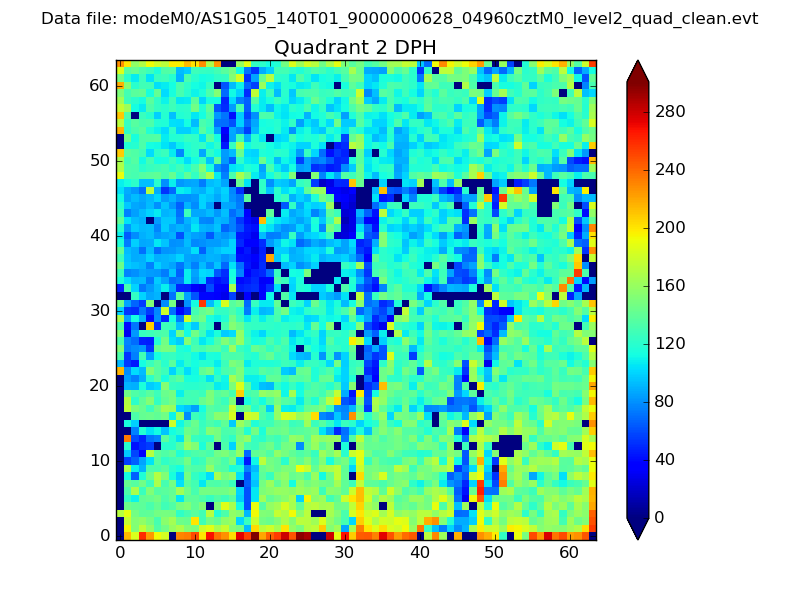 |
Quadrant C |
| Plot type | Count rate plots | Images |
|---|---|---|
| Comparison with Poisson distribution Blue bars denote a histogram of data divided into 1 sec bins. Red curve is a Poisson curve with rate = median count rate of data. |
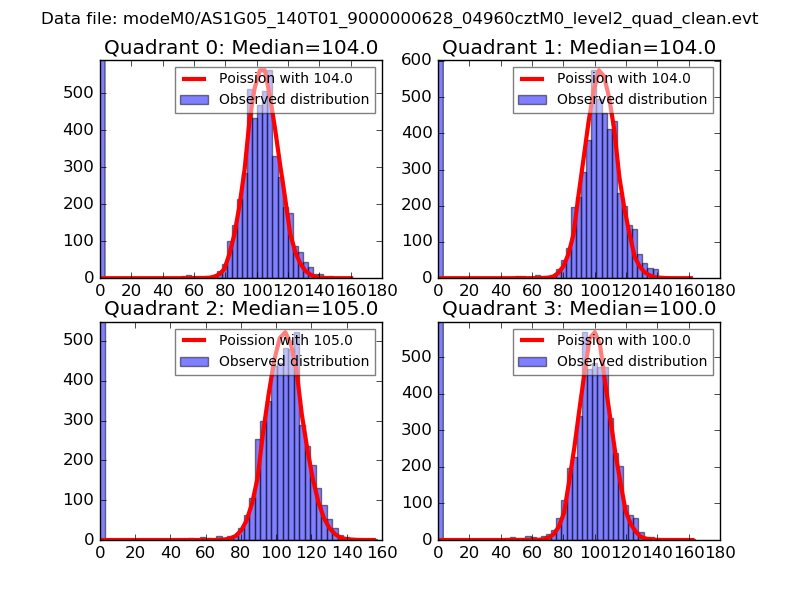 |
 |
| Quadrant-wise count rates Data is divided into 100 sec bins |
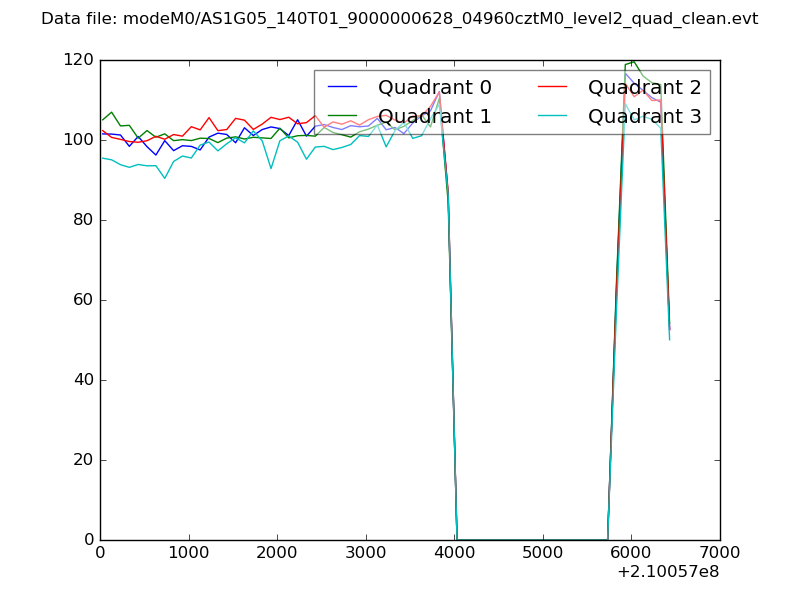 |
|
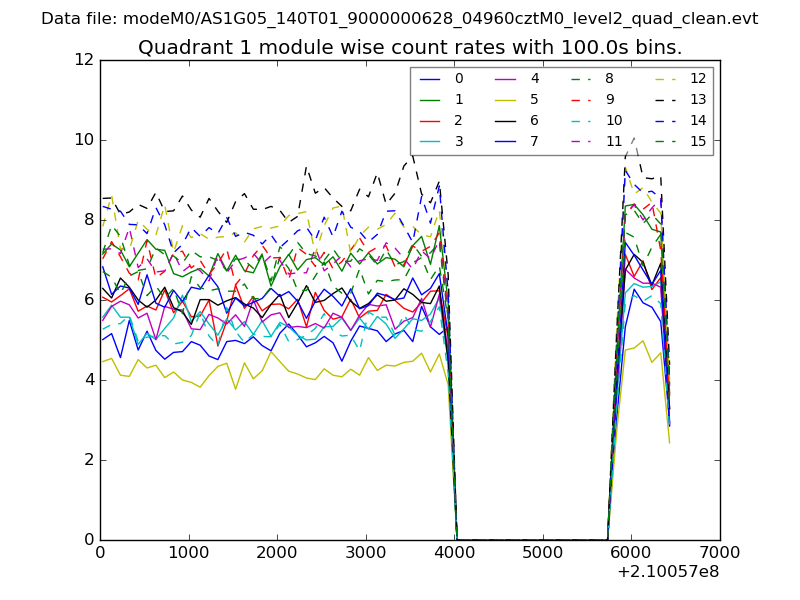
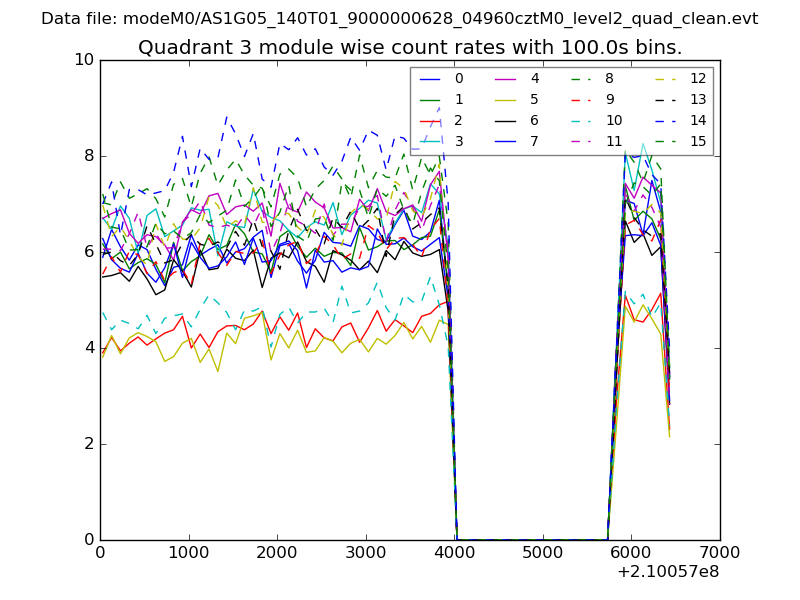
| Module-wise count rates for Quadrant A Data is divided into 100 sec bins |
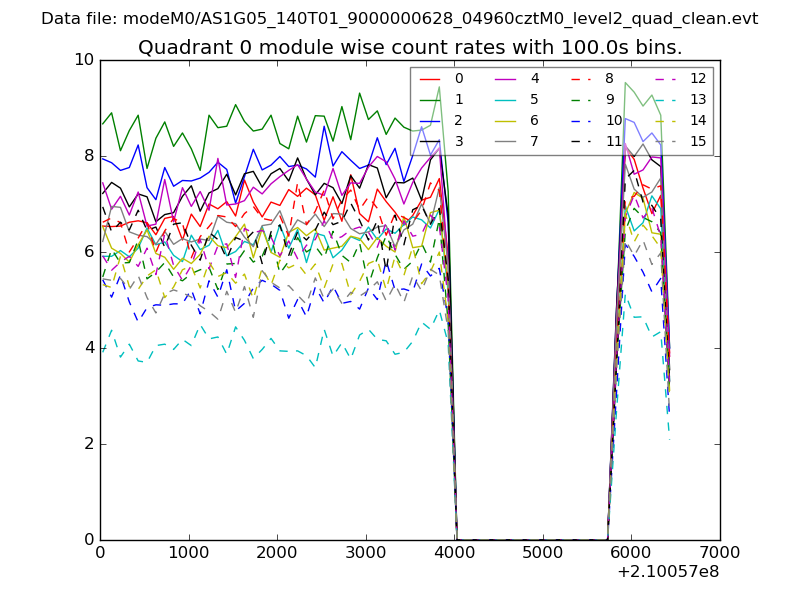 |
 |
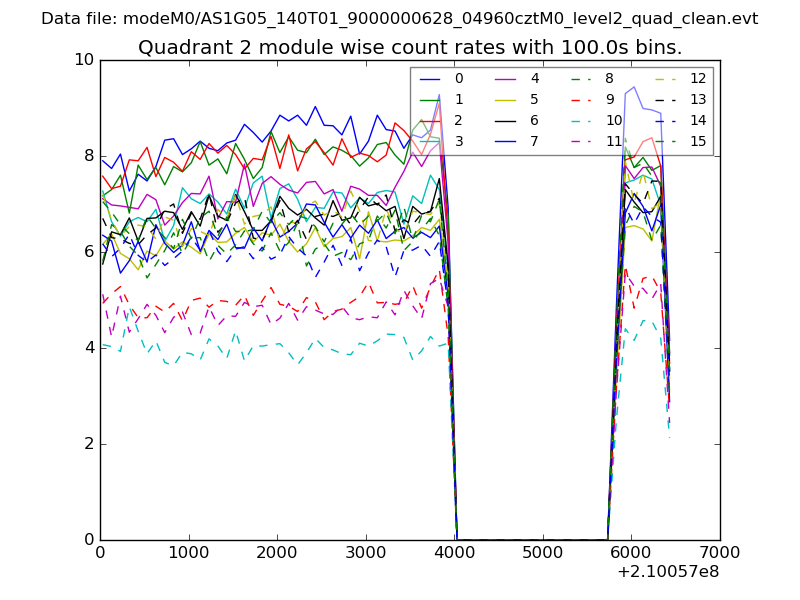
| Module-wise count rates for Quadrant B Data is divided into 100 sec bins |
 |
 |
| Module-wise count rates for Quadrant C Data is divided into 100 sec bins |
 |
 |
| Module-wise count rates for Quadrant D Data is divided into 100 sec bins |
 |
 |
| Parameter | Plot |
|---|---|
| CZT HV Monitor | 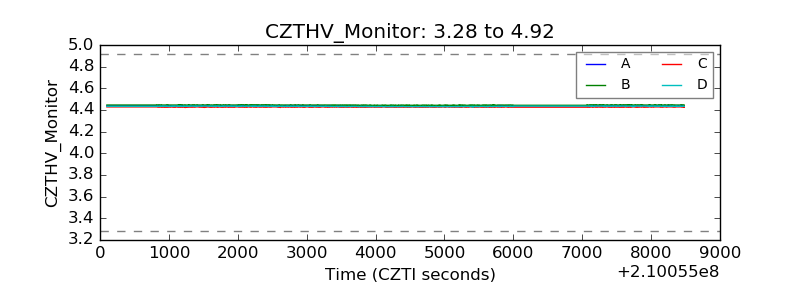 |
| D_VDD | 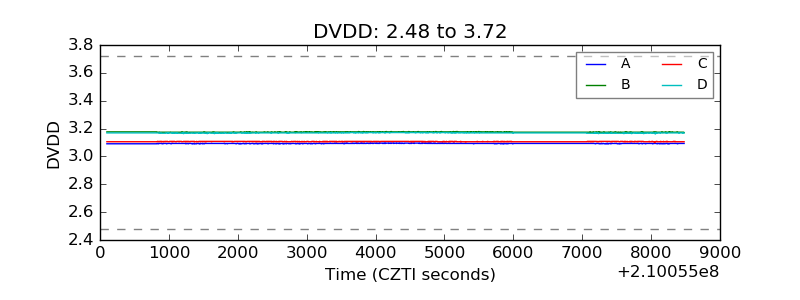 |
| Temperature 1 | 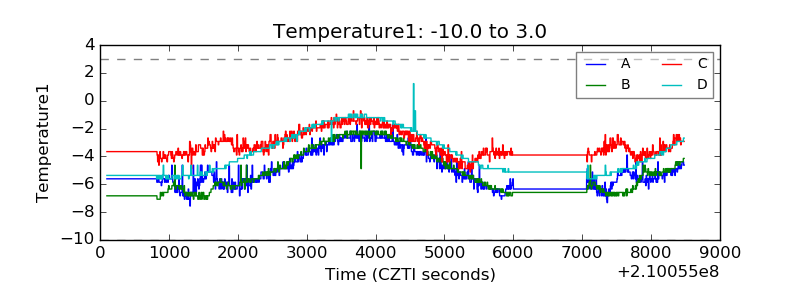 |
| Veto HV Monitor | 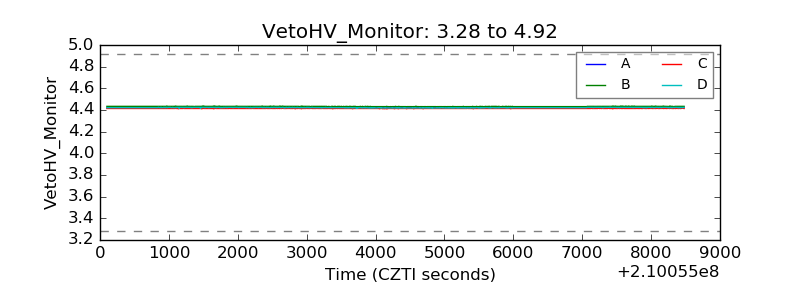 |
| Veto LLD | 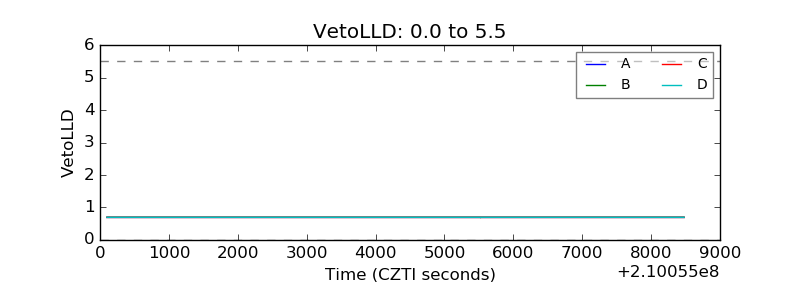 |
| Alpha Counter | 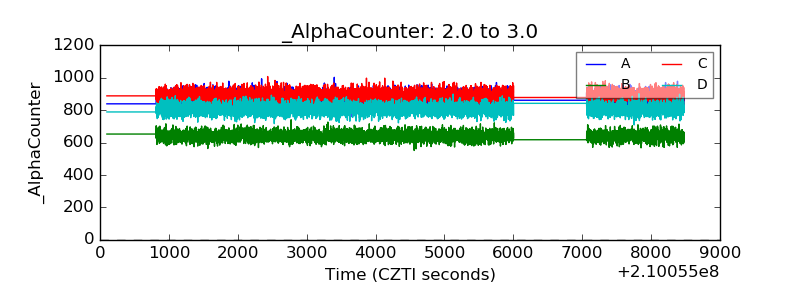 |
| _CPM_Rate | 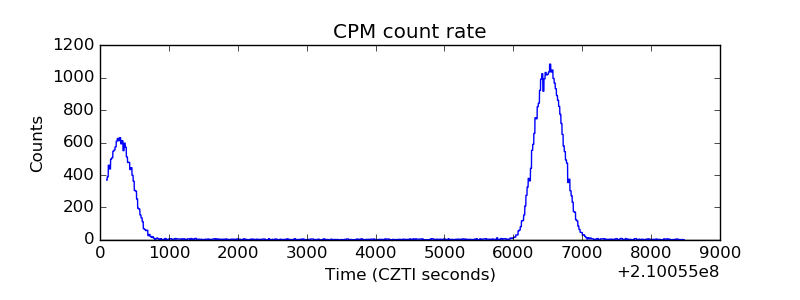 |
| CZT Counter | 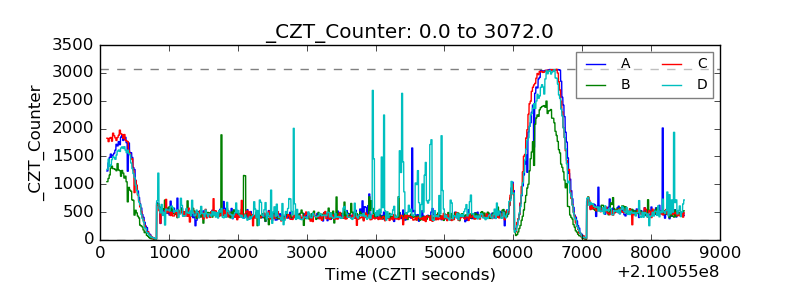 |
| +2.5 Volts monitor | 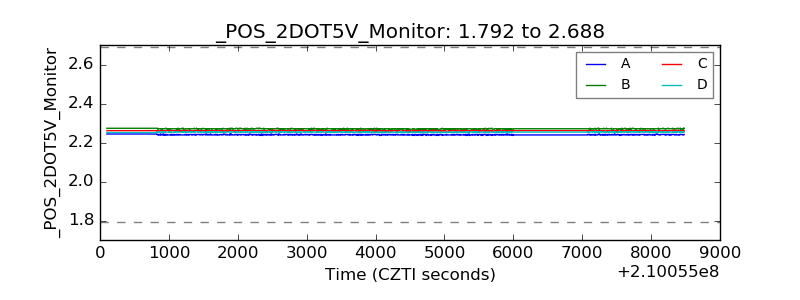 |
| +5 Volts monitor |  |
| _ROLL_ROT | 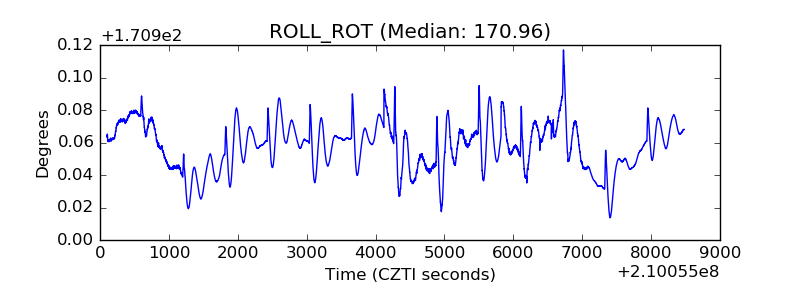 |
| _Roll_DEC | 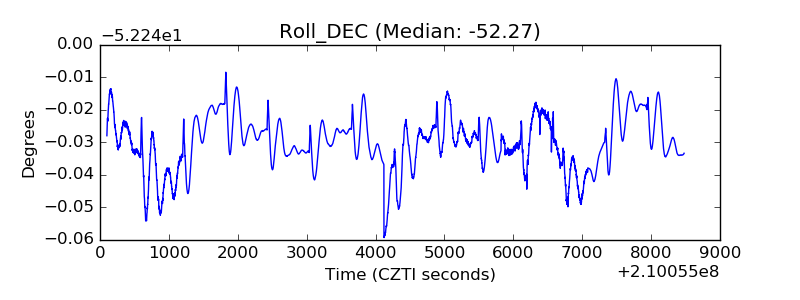 |
| _Roll_RA | 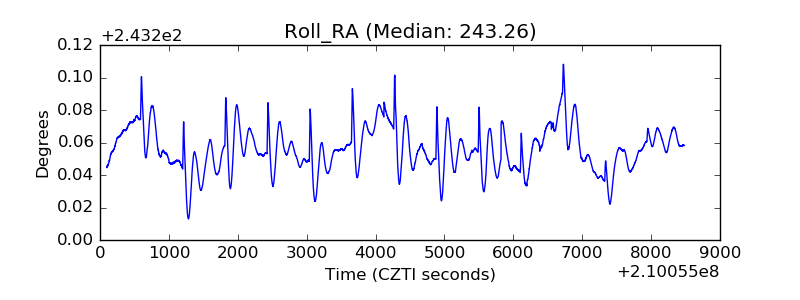 |
| Veto Counter | 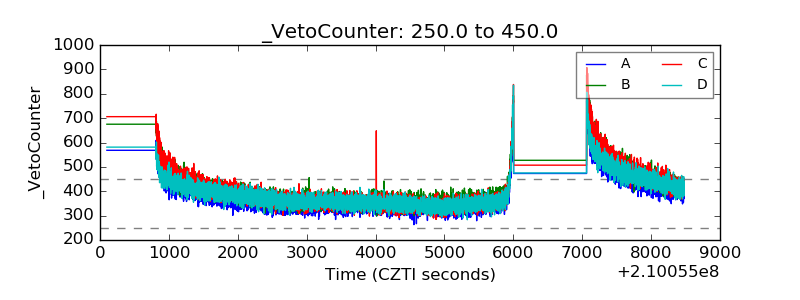 |