| Param | Original file | Final file |
|---|---|---|
| Filename | modeM0/AS1G05_140T01_9000000628_04965cztM0_level2.evt | modeM0/AS1G05_140T01_9000000628_04965cztM0_level2_quad_clean.evt |
| Size (bytes) | 275,889,600 | 53,444,160 |
| Size | 263.1 MB | 51.0 MB |
| Events in quadrant A | 1,898,559 | 339,743 |
| Events in quadrant B | 2,218,004 | 331,597 |
| Events in quadrant C | 1,811,216 | 334,968 |
| Events in quadrant D | 2,148,453 | 323,772 |
| Mode M0 | |||
|---|---|---|---|
| Quadrant | BADHDUFLAG | Total packets | Discarded packets |
| A | 0 | 8427 | 0 |
| B | 0 | 9329 | 0 |
| C | 0 | 8418 | 0 |
| D | 0 | 9224 | 0 |
| Mode SS | |||
|---|---|---|---|
| Quadrant | BADHDUFLAG | Total packets | Discarded packets |
| A | 0 | 82 | 0 |
| B | 0 | 82 | 0 |
| C | 0 | 82 | 0 |
| D | 0 | 82 | 0 |
| Quadrant | Total seconds | Saturated seconds | Saturation percentage |
|---|---|---|---|
| A | 4084 | 28 | 0.685602% |
| B | 4084 | 27 | 0.661117% |
| C | 4084 | 19 | 0.465230% |
| D | 4084 | 43 | 1.052889% |
Noise dominated data is calculated using 1-second bins in cleaned event files. If a bin has >2000 counts, and if more than 50% of those come from <1% of pixels, then it is considered to be noise-dominated and hence unusable.
| Quadrant | # 1 sec bins | Bins with >0 counts | Bins with >2000 counts | High rate bins dominated by noise | Noise dominated (total time) | Noise dominated (detector-on time) | Marked lightcurve |
|---|---|---|---|---|---|---|---|
| A | 4083 | 4083 | 4 | 4 | 0.10% | 0.10% | 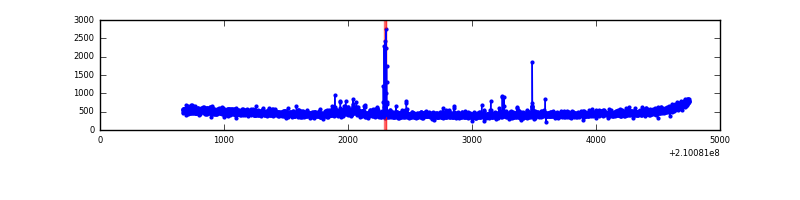 |
| B | 4084 | 4084 | 2 | 2 | 0.05% | 0.05% | 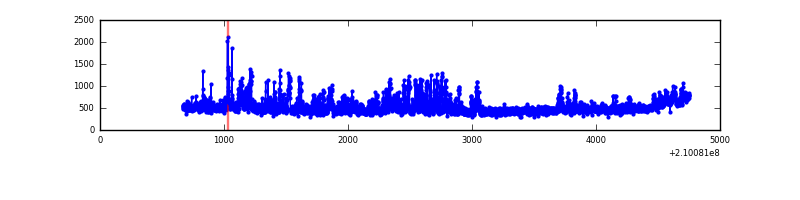 |
| C | 4084 | 4084 | 6 | 6 | 0.15% | 0.15% | 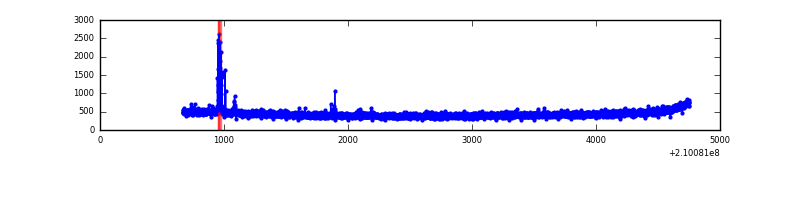 |
| D | 4084 | 4084 | 30 | 30 | 0.73% | 0.73% | 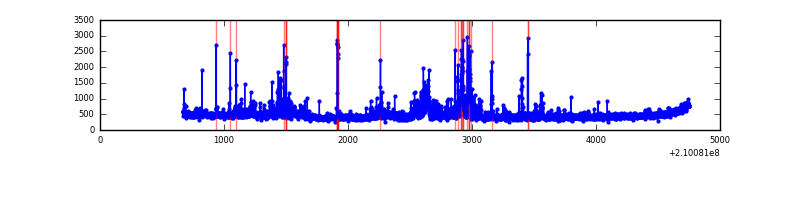 |
Top three noisy pixels from each quadrant. If the there are fewer than three noisy pixels in the level2.evt file, extra rows are filled as -1
| Pixel properties | Quadrant properties | ||||||
|---|---|---|---|---|---|---|---|
| Quadrant | DetID | PixID | Counts | Sigma | Mean | Median | Sigma |
| A | 8 | 15 | 32507 | 326.23 | 474 | 465 | 98.2 |
| A | 0 | 50 | 27040 | 270.57 | 474 | 465 | 98.2 |
| A | 13 | 251 | 8915 | 86.03 | 474 | 465 | 98.2 |
| B | 15 | 204 | 341251 | 3723.85 | 475 | 464 | 91.5 |
| B | 4 | 48 | 17863 | 190.12 | 475 | 464 | 91.5 |
| B | 15 | 54 | 9040 | 93.71 | 475 | 464 | 91.5 |
| C | 1 | 16 | 45254 | 428.48 | 452 | 454 | 104.6 |
| C | 13 | 61 | 3746 | 31.48 | 452 | 454 | 104.6 |
| C | 14 | 67 | 1549 | 10.47 | 452 | 454 | 104.6 |
| D | 2 | 33 | 99546 | 892.14 | 454 | 441 | 111.1 |
| D | 13 | 235 | 85294 | 763.84 | 454 | 441 | 111.1 |
| D | 1 | 7 | 79979 | 716.0 | 454 | 441 | 111.1 |
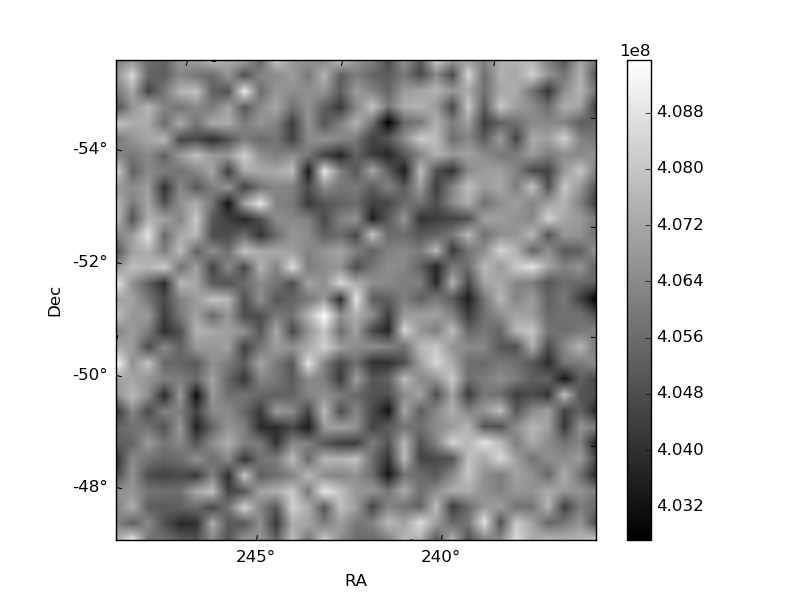
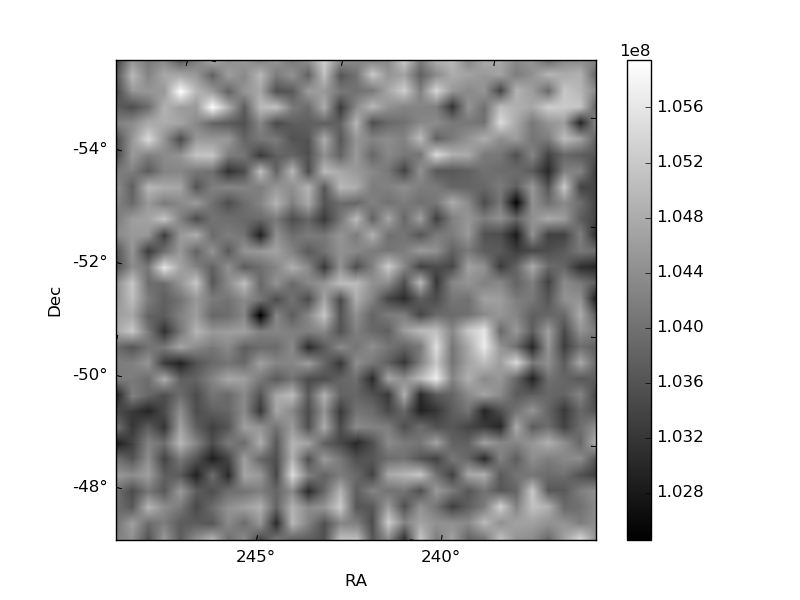
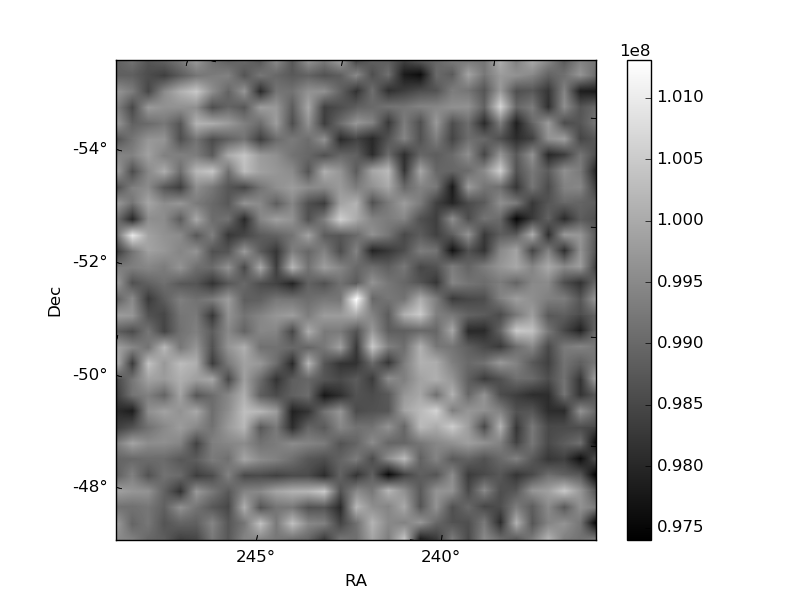
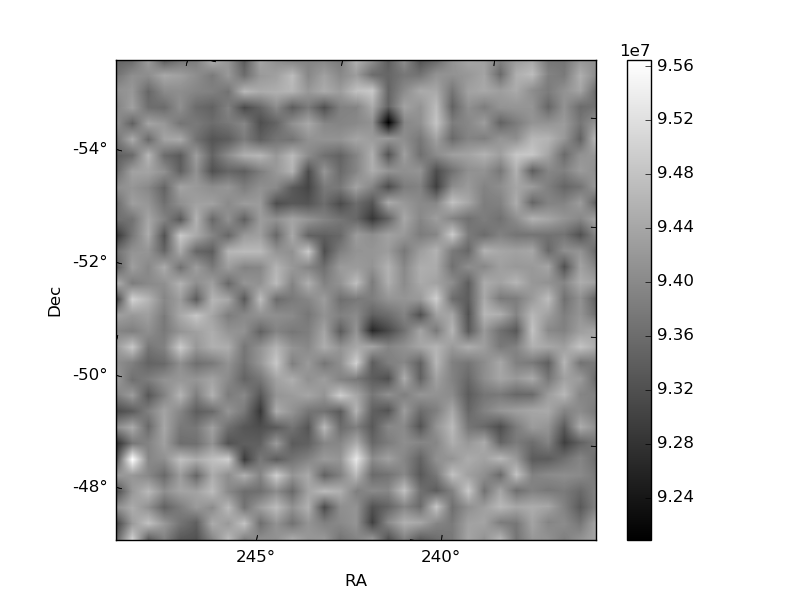
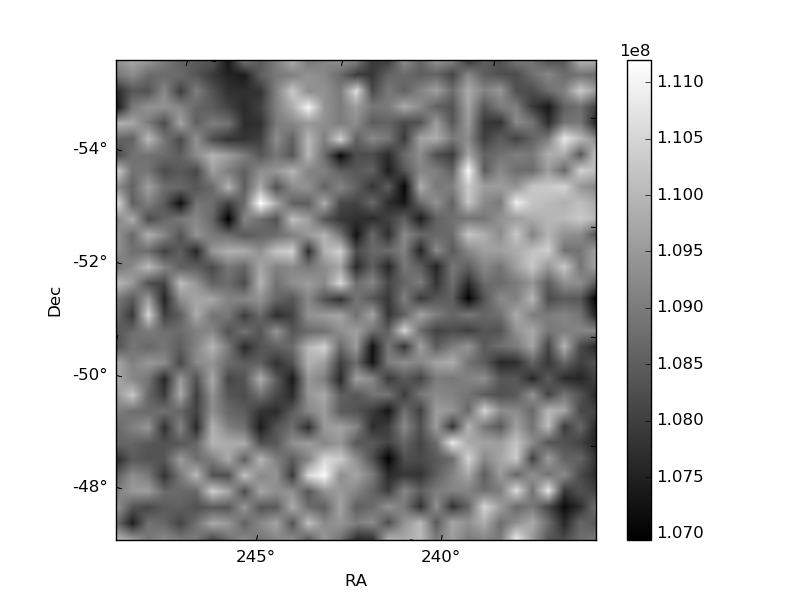
Histogram calculated using DETX and DETY for each event in the final _common_clean file
| Quadrant A | 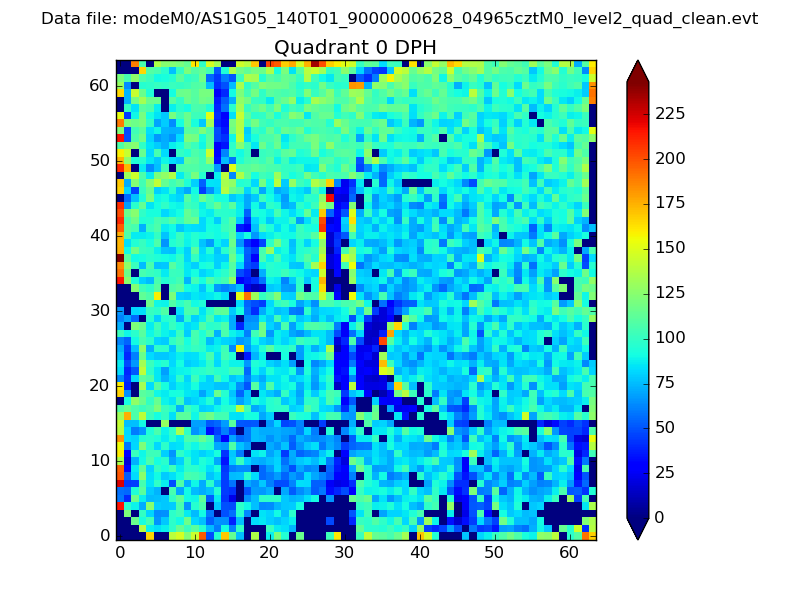 |
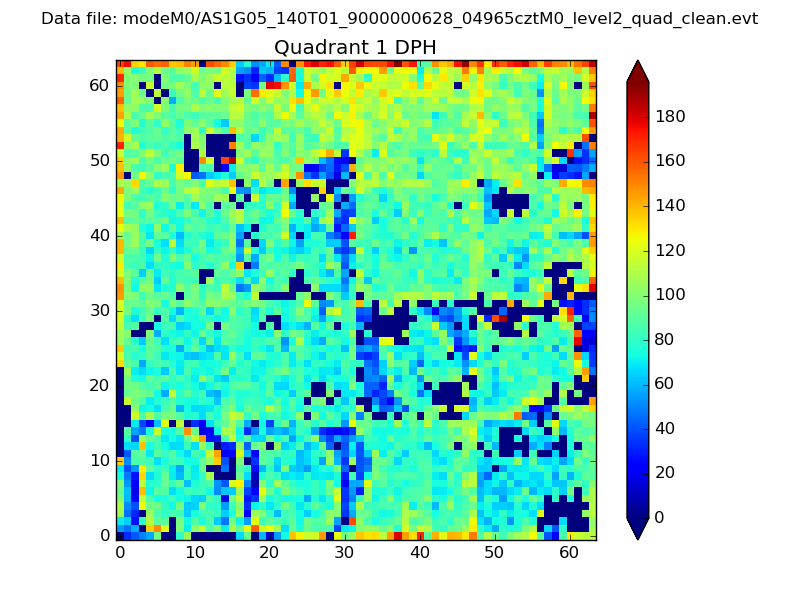 |
Quadrant B |
|---|---|---|---|
| Quadrant D | 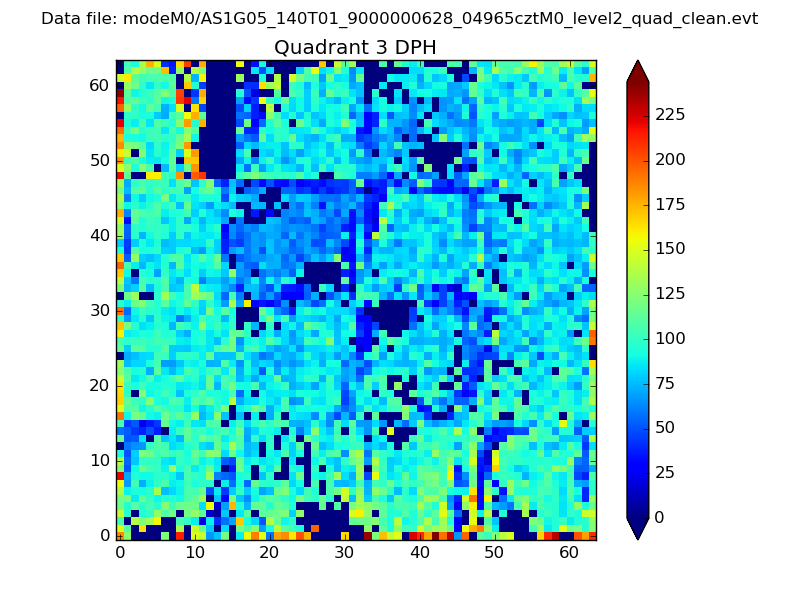 |
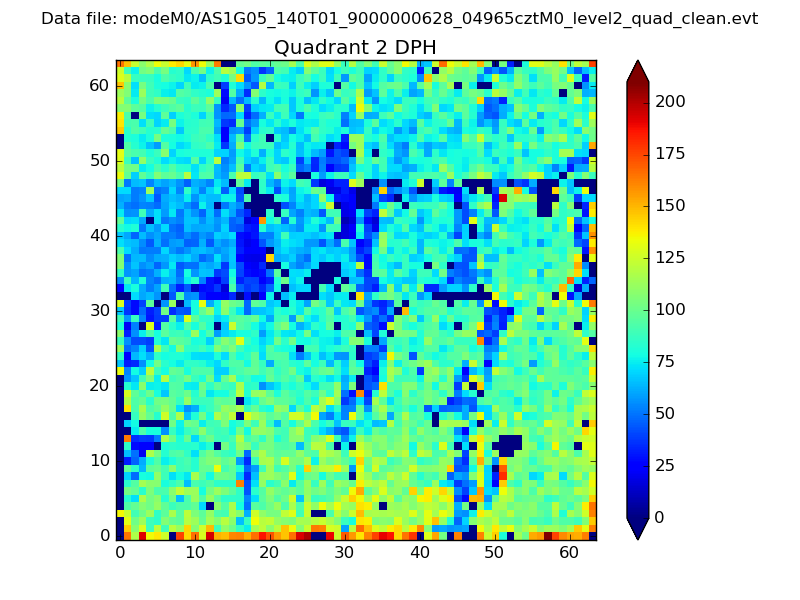 |
Quadrant C |
| Plot type | Count rate plots | Images |
|---|---|---|
| Comparison with Poisson distribution Blue bars denote a histogram of data divided into 1 sec bins. Red curve is a Poisson curve with rate = median count rate of data. |
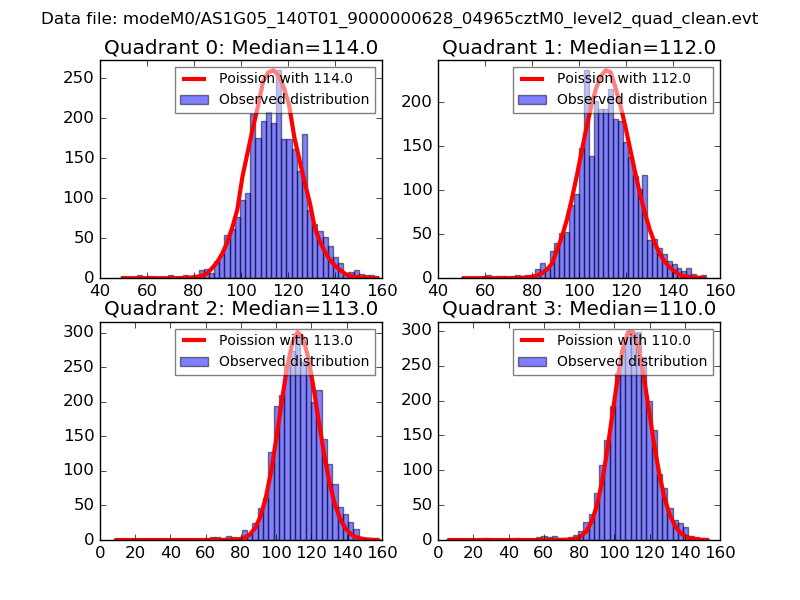 |
 |
| Quadrant-wise count rates Data is divided into 100 sec bins |
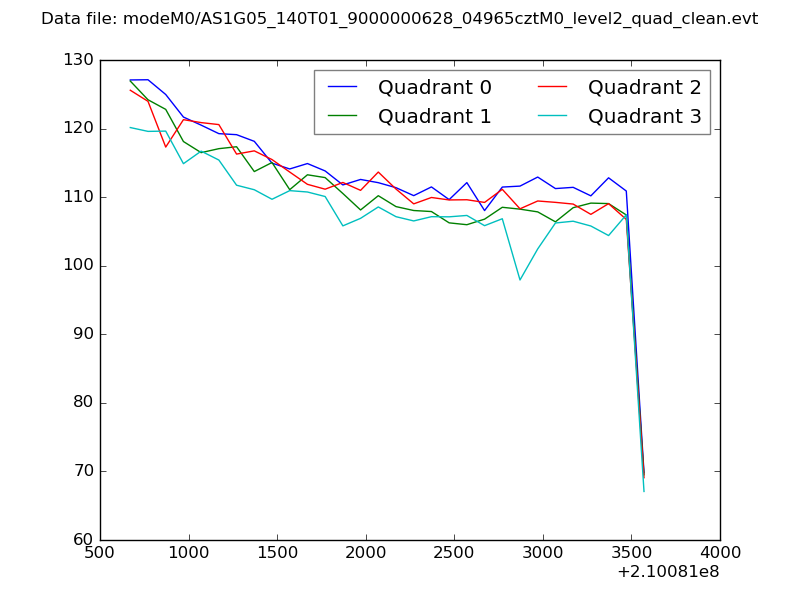 |
|
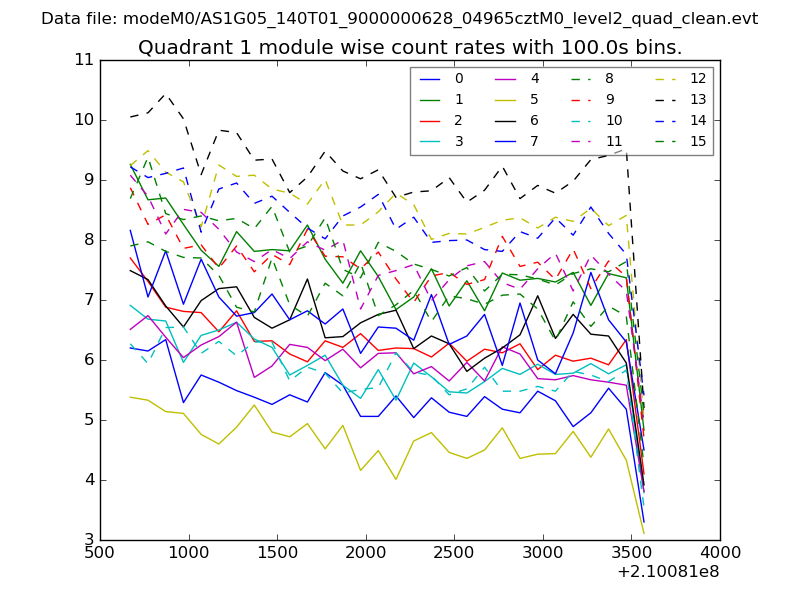
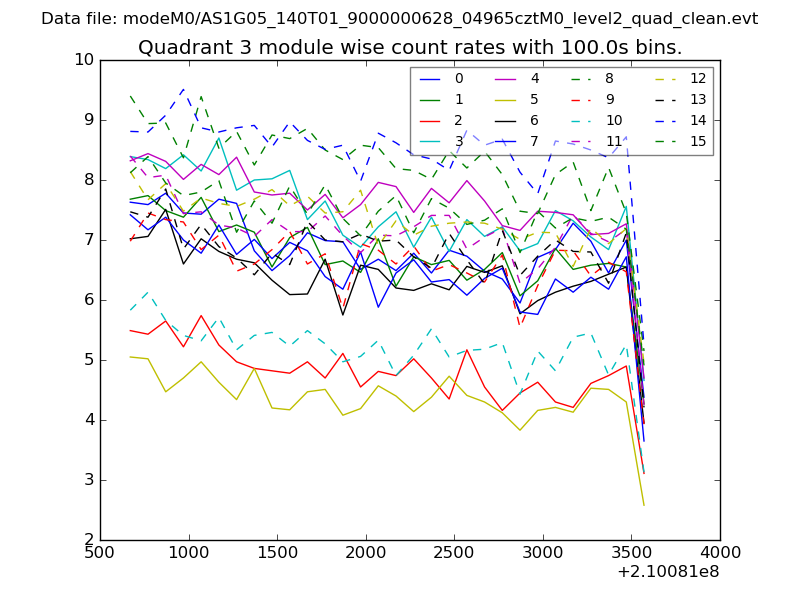
| Module-wise count rates for Quadrant A Data is divided into 100 sec bins |
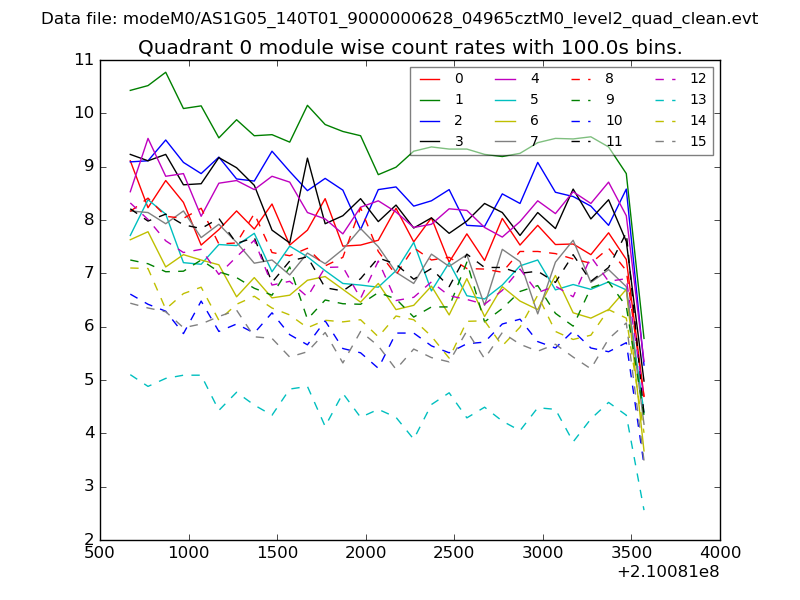 |
 |
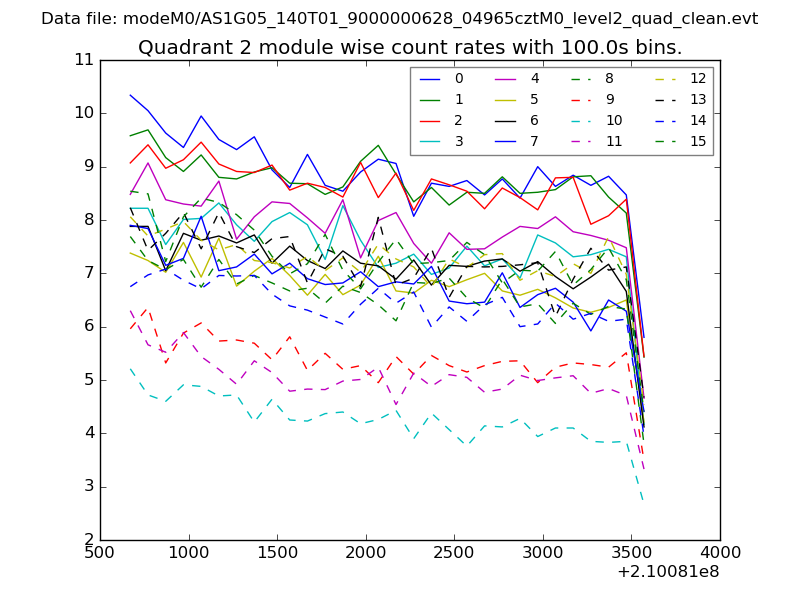
| Module-wise count rates for Quadrant B Data is divided into 100 sec bins |
 |
 |
| Module-wise count rates for Quadrant C Data is divided into 100 sec bins |
 |
 |
| Module-wise count rates for Quadrant D Data is divided into 100 sec bins |
 |
 |
| Parameter | Plot |
|---|---|
| CZT HV Monitor | 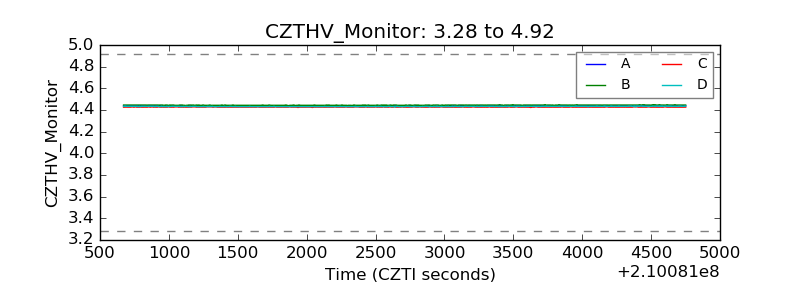 |
| D_VDD | 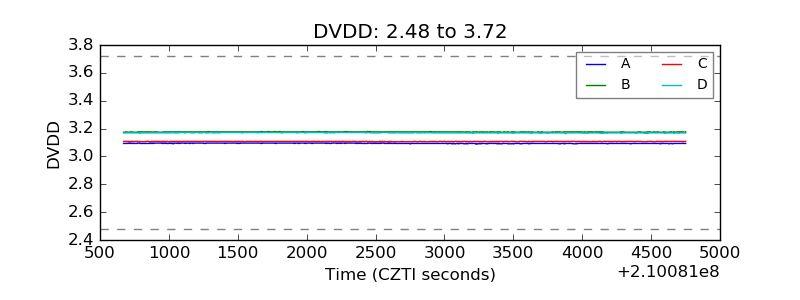 |
| Temperature 1 | 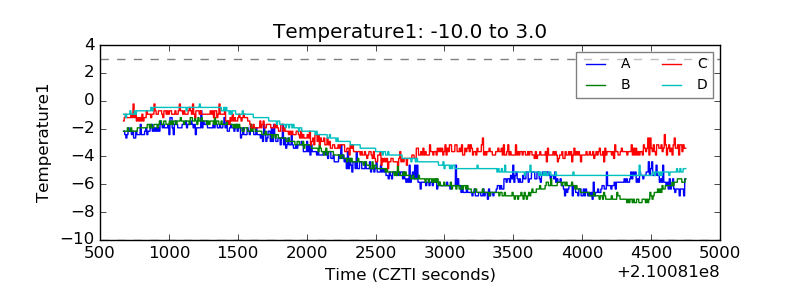 |
| Veto HV Monitor | 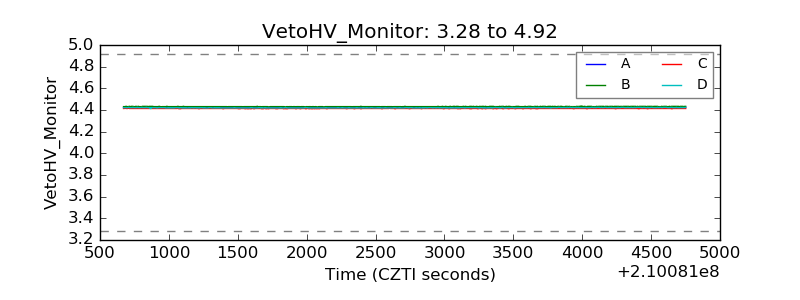 |
| Veto LLD | 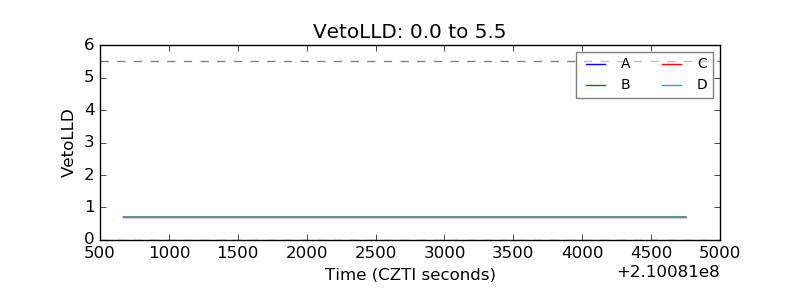 |
| Alpha Counter | 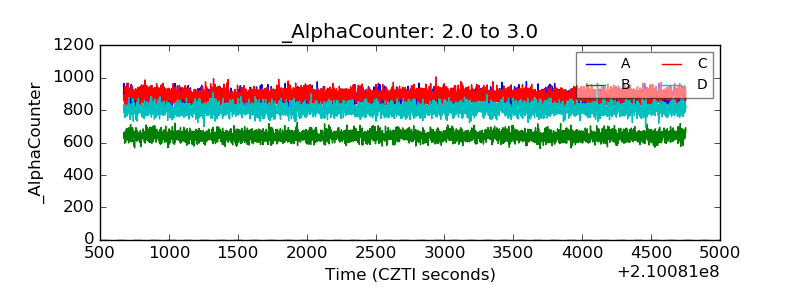 |
| _CPM_Rate | 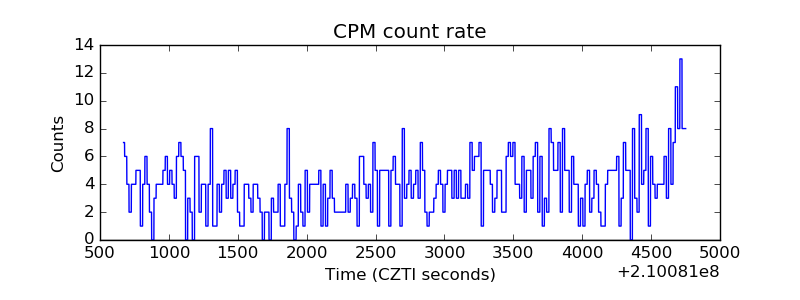 |
| CZT Counter | 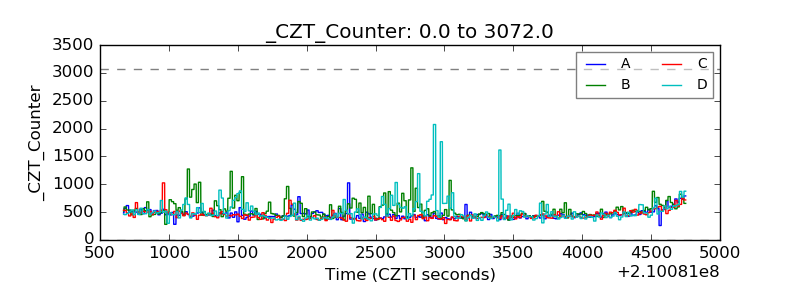 |
| +2.5 Volts monitor |  |
| +5 Volts monitor |  |
| _ROLL_ROT | 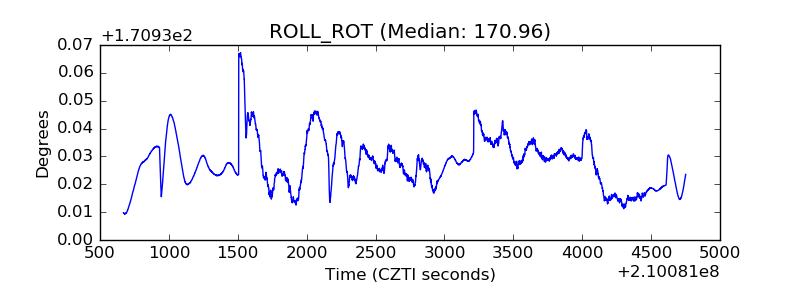 |
| _Roll_DEC | 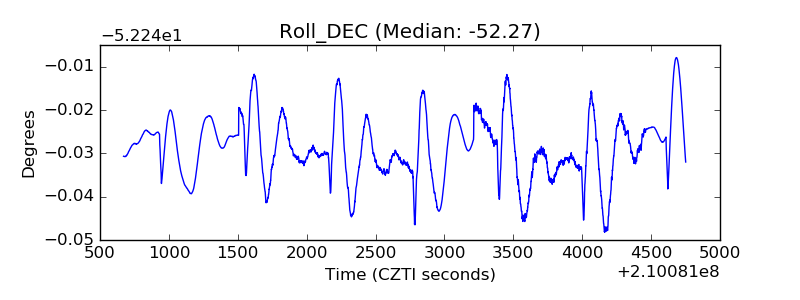 |
| _Roll_RA | 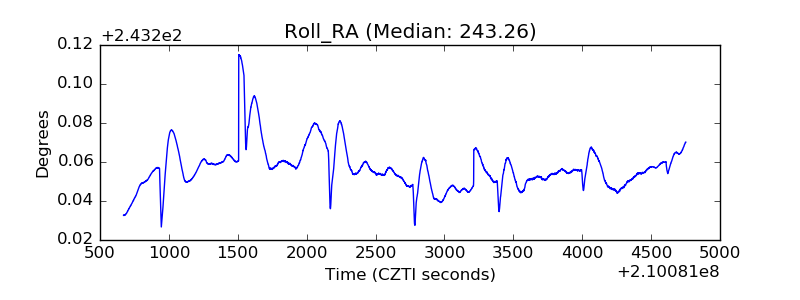 |
| Veto Counter | 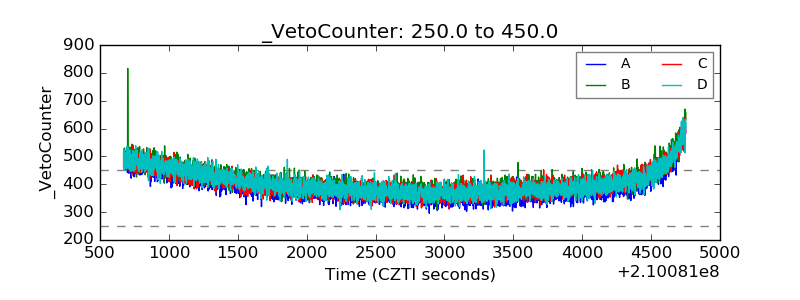 |