| Param | Original file | Final file |
|---|---|---|
| Filename | modeM0/AS1G05_158T01_9000000630cztM0_level2.fits | modeM0/AS1G05_158T01_9000000630cztM0_level2_quad_clean.evt |
| Size (bytes) | 728,533,440 | 749,715,840 |
| Size | 694.8 MB | 715.0 MB |
| Events in quadrant A | 4,438,048 | 4,545,812 |
| Events in quadrant B | 4,268,286 | 4,550,818 |
| Events in quadrant C | 4,367,948 | 4,442,353 |
| Events in quadrant D | 3,618,686 | 3,798,582 |
| Mode M9 | |||
|---|---|---|---|
| Quadrant | BADHDUFLAG | Total packets | Discarded packets |
| A | 0 | 133 | 0 |
| B | 0 | 133 | 0 |
| C | 0 | 133 | 0 |
| D | 0 | 133 | 0 |
| Mode M0 | |||
|---|---|---|---|
| Quadrant | BADHDUFLAG | Total packets | Discarded packets |
| A | 0 | 166005 | 0 |
| B | 0 | 171915 | 0 |
| C | 0 | 161391 | 0 |
| D | 0 | 223796 | 0 |
| Mode SS | |||
|---|---|---|---|
| Quadrant | BADHDUFLAG | Total packets | Discarded packets |
| A | 0 | 1586 | 0 |
| B | 0 | 1586 | 0 |
| C | 0 | 1586 | 0 |
| D | 0 | 1586 | 0 |
| Quadrant | Total seconds | Saturated seconds | Saturation percentage |
|---|---|---|---|
| A | 78323 | 1099 | 1.403164% |
| B | 78323 | 1072 | 1.368691% |
| C | 78323 | 504 | 0.643489% |
| D | 78323 | 6029 | 7.697611% |
Noise dominated data is calculated using 1-second bins in cleaned event files. If a bin has >2000 counts, and if more than 50% of those come from <1% of pixels, then it is considered to be noise-dominated and hence unusable.
| Quadrant | # 1 sec bins | Bins with >0 counts | Bins with >2000 counts | High rate bins dominated by noise | Noise dominated (total time) | Noise dominated (detector-on time) | Marked lightcurve |
|---|---|---|---|---|---|---|---|
| A | 90426 | 78300 | 0 | 0 | 0.00% | 0.00% | 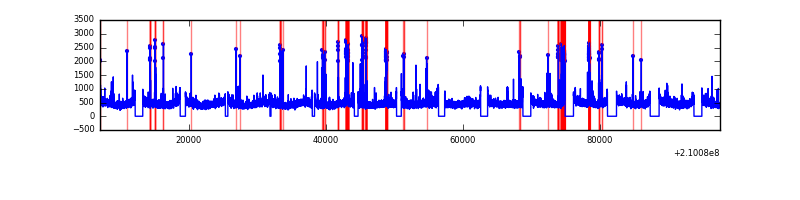 |
| B | 90426 | 78308 | 0 | 0 | 0.00% | 0.00% | 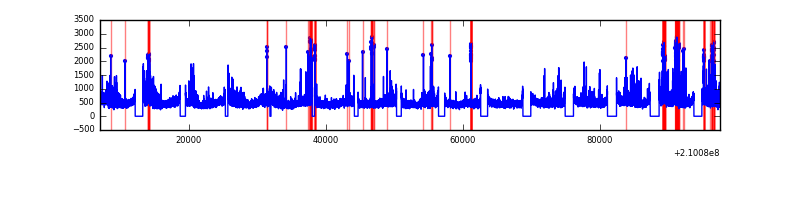 |
| C | 90426 | 78311 | 0 | 0 | 0.00% | 0.00% | 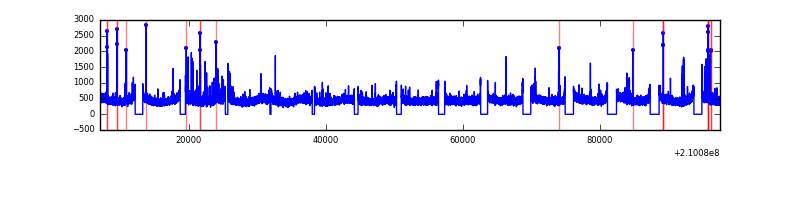 |
| D | 90426 | 78182 | 0 | 0 | 0.00% | 0.00% | 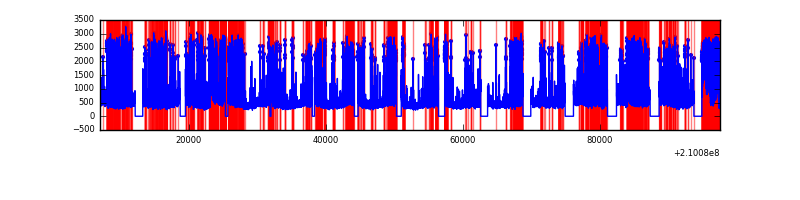 |
Top three noisy pixels from each quadrant. If the there are fewer than three noisy pixels in the level2.evt file, extra rows are filled as -1
| Pixel properties | Quadrant properties | ||||||
|---|---|---|---|---|---|---|---|
| Quadrant | DetID | PixID | Counts | Sigma | Mean | Median | Sigma |
| A | 14 | 188 | 4389 | 11.27 | 1151 | 1074 | 294.1 |
| A | 0 | 29 | 4249 | 10.79 | 1151 | 1074 | 294.1 |
| A | 14 | 204 | 3807 | 9.29 | 1151 | 1074 | 294.1 |
| B | 2 | 9 | 3726 | 11.51 | 1128 | 1074 | 230.4 |
| B | 12 | 226 | 3025 | 8.47 | 1128 | 1074 | 230.4 |
| B | 14 | 254 | 2831 | 7.62 | 1128 | 1074 | 230.4 |
| C | 1 | 80 | 3156 | 6.76 | 1153 | 1065 | 309.2 |
| C | 1 | 81 | 3069 | 6.48 | 1153 | 1065 | 309.2 |
| C | 9 | 188 | 3021 | 6.33 | 1153 | 1065 | 309.2 |
| D | 11 | 82 | 2926 | 7.18 | 1031 | 936 | 277.3 |
| D | 3 | 14 | 2747 | 6.53 | 1031 | 936 | 277.3 |
| D | 6 | 231 | 2717 | 6.42 | 1031 | 936 | 277.3 |
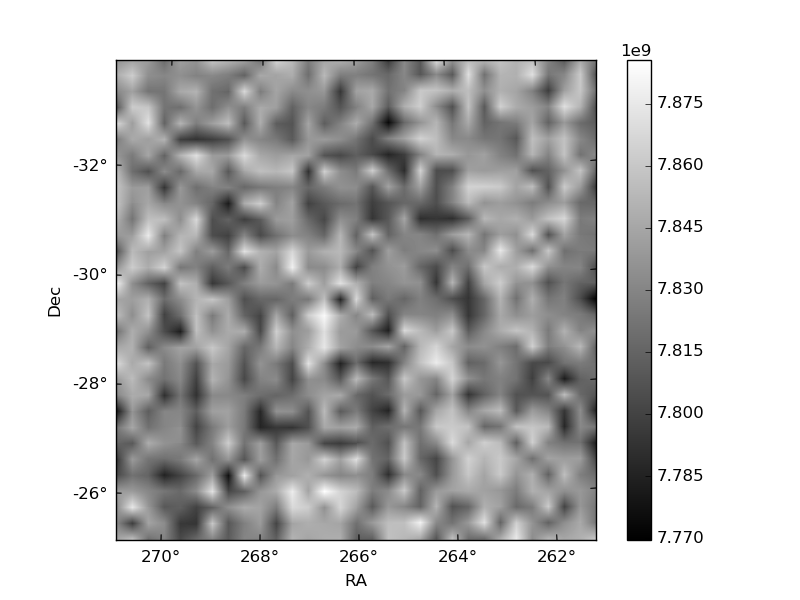
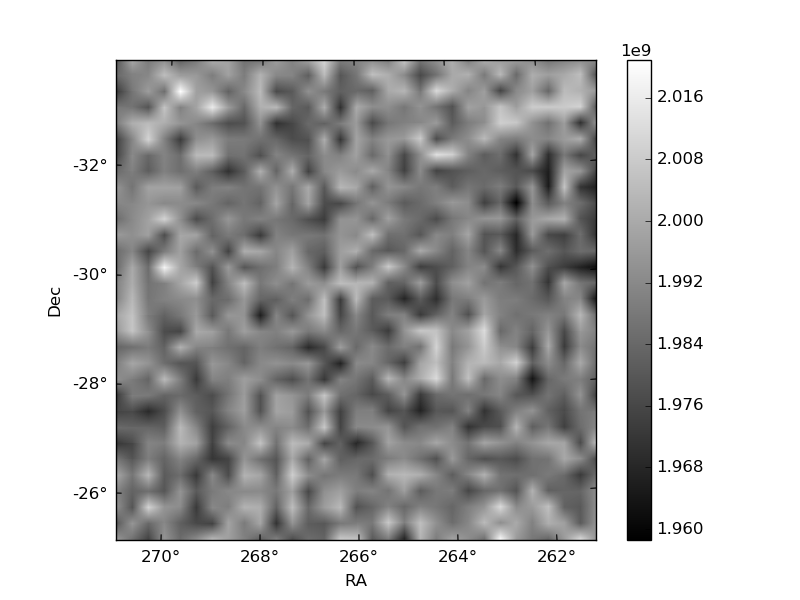
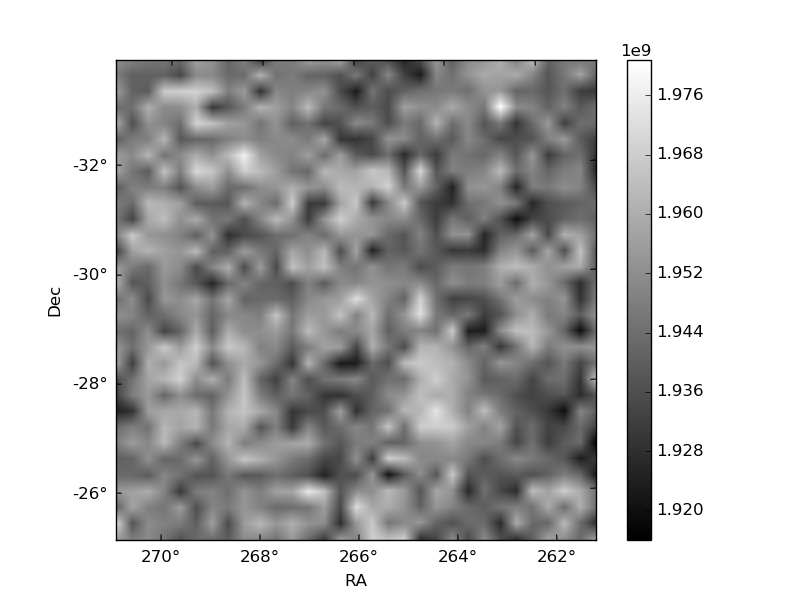
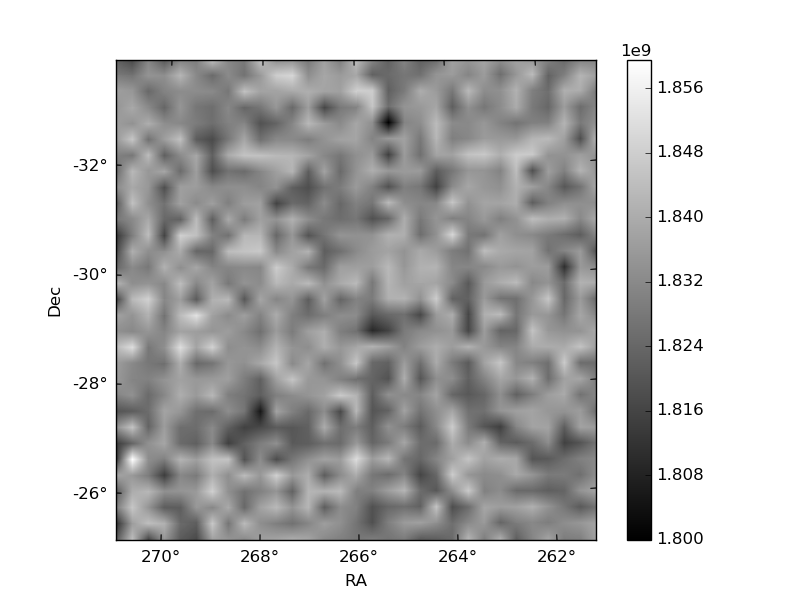
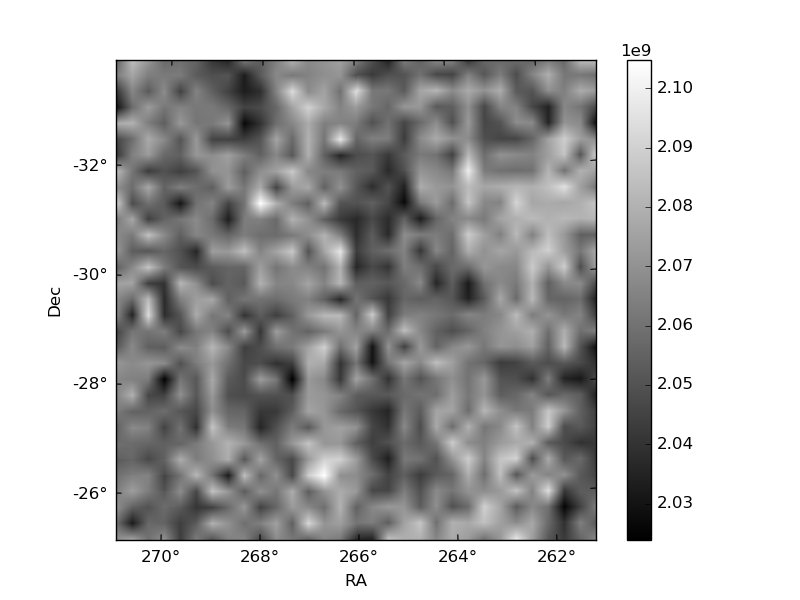
Histogram calculated using DETX and DETY for each event in the final _common_clean file
| Quadrant A | 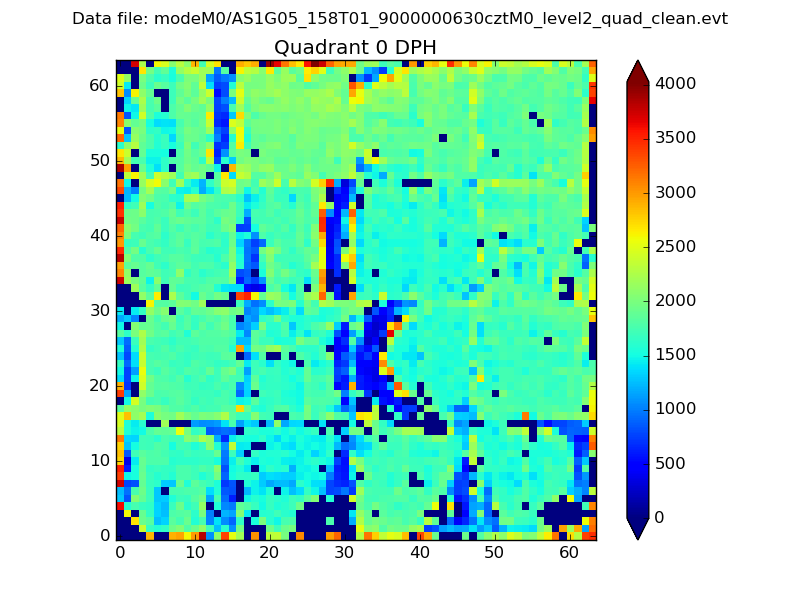 |
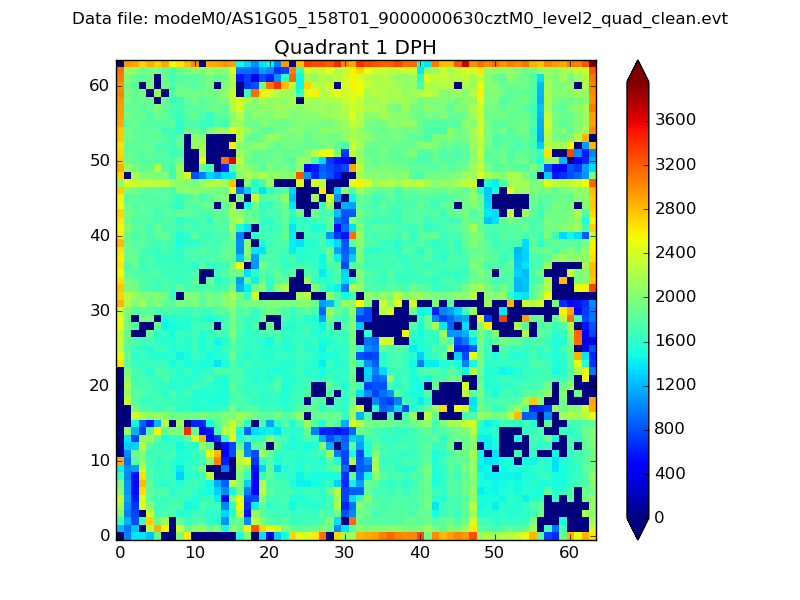 |
Quadrant B |
|---|---|---|---|
| Quadrant D | 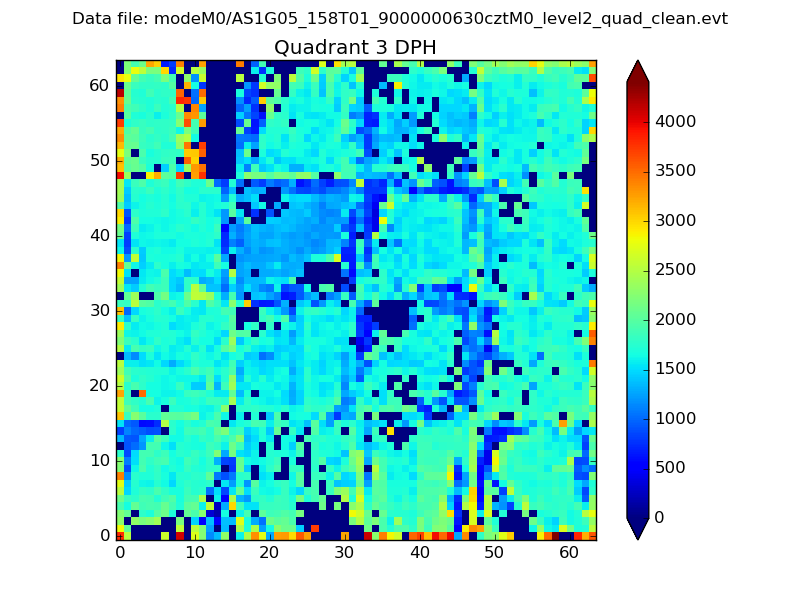 |
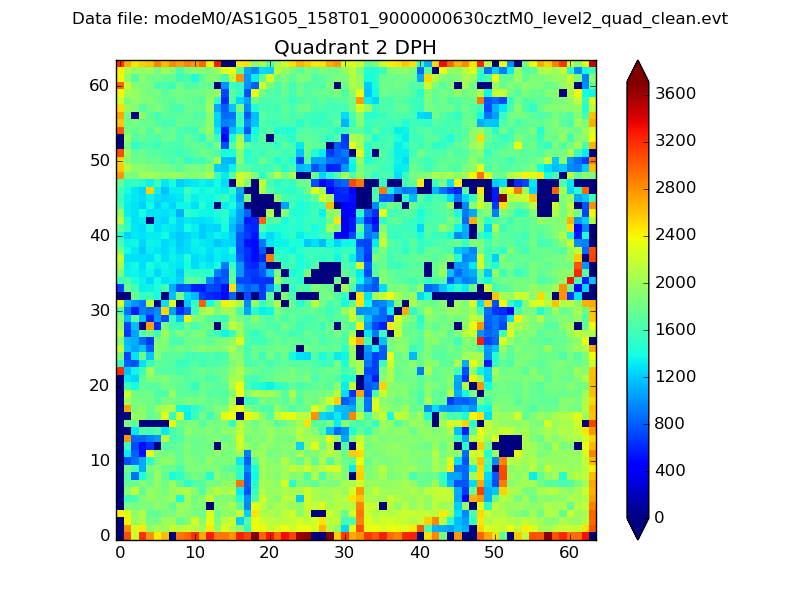 |
Quadrant C |
| Plot type | Count rate plots | Images |
|---|---|---|
| Comparison with Poisson distribution Blue bars denote a histogram of data divided into 1 sec bins. Red curve is a Poisson curve with rate = median count rate of data. |
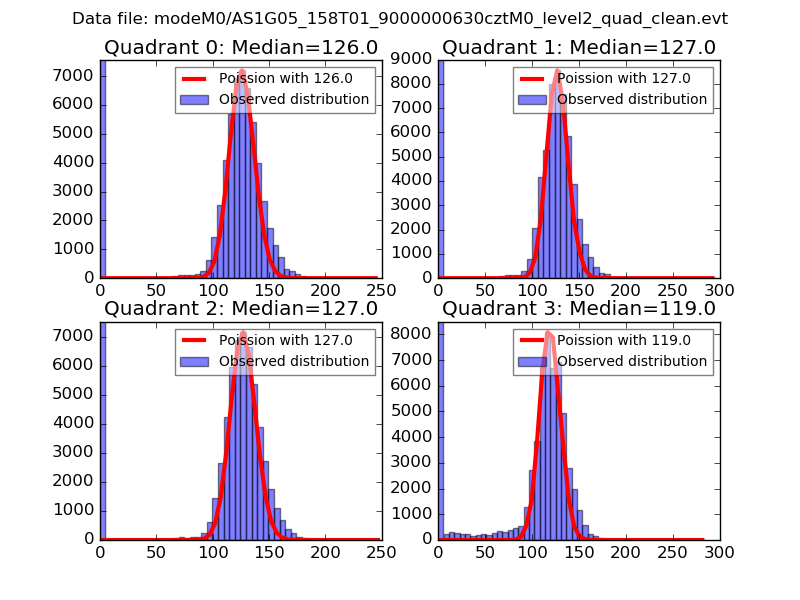 |
 |
| Quadrant-wise count rates Data is divided into 100 sec bins |
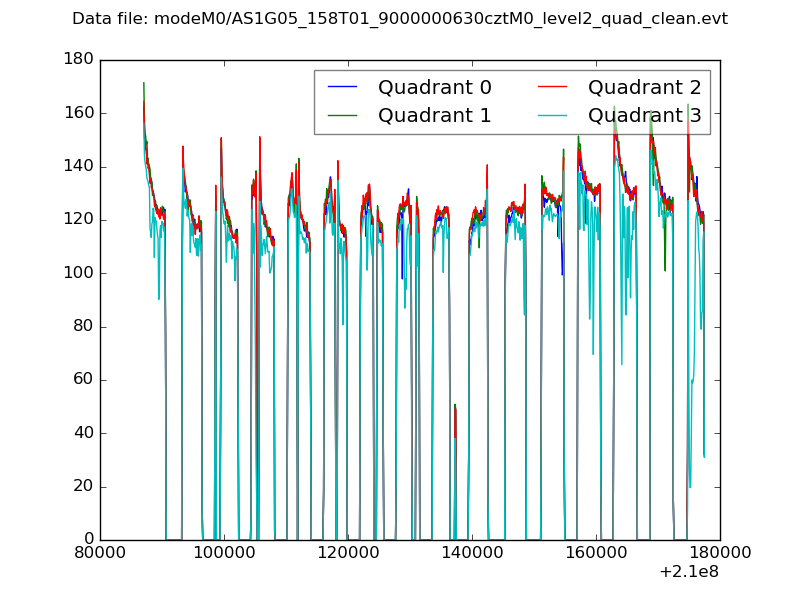 |
|
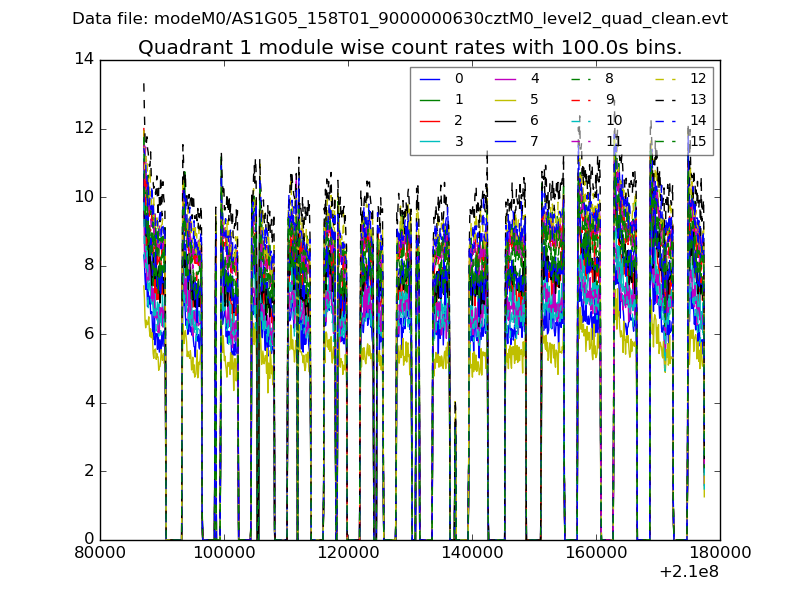
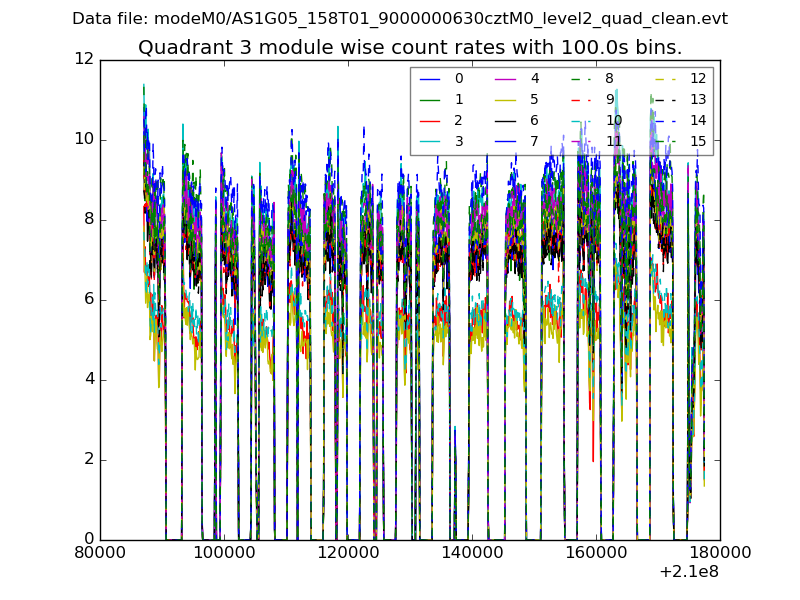
| Module-wise count rates for Quadrant A Data is divided into 100 sec bins |
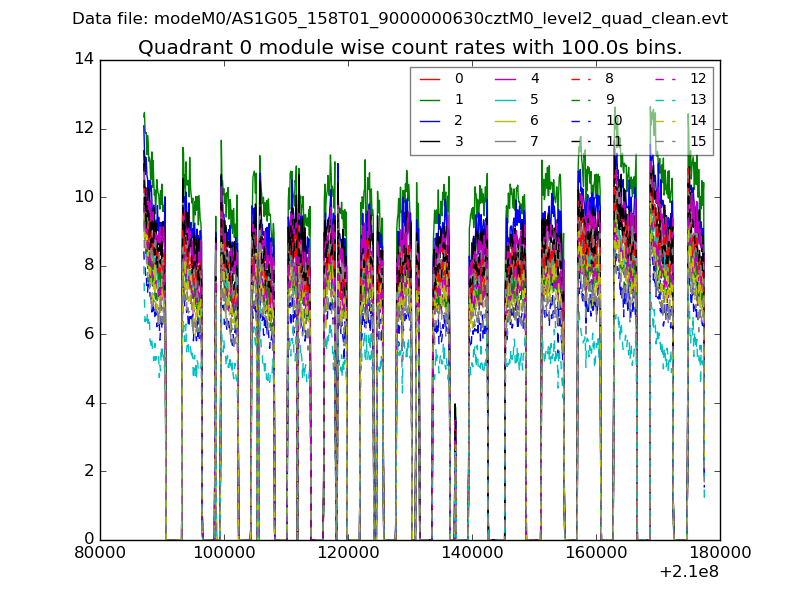 |
 |
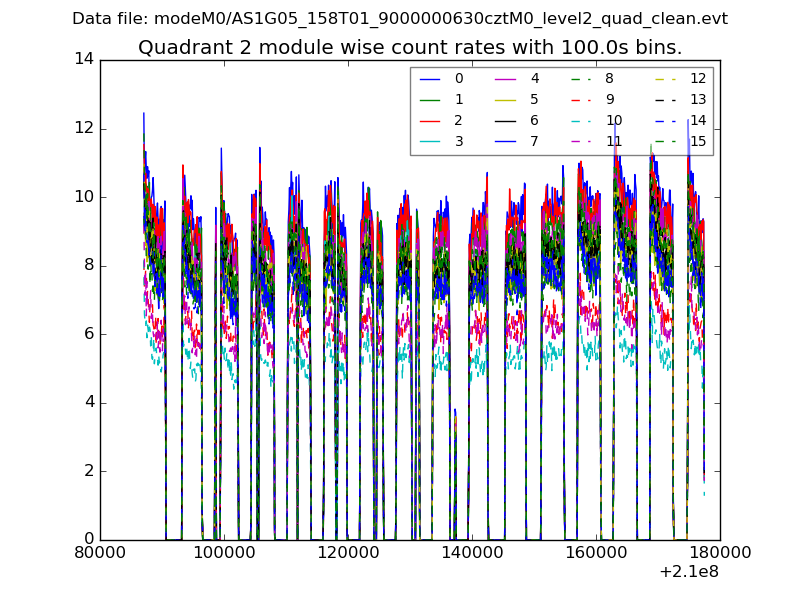
| Module-wise count rates for Quadrant B Data is divided into 100 sec bins |
 |
 |
| Module-wise count rates for Quadrant C Data is divided into 100 sec bins |
 |
 |
| Module-wise count rates for Quadrant D Data is divided into 100 sec bins |
 |
 |
| Parameter | Plot |
|---|---|
| CZT HV Monitor | 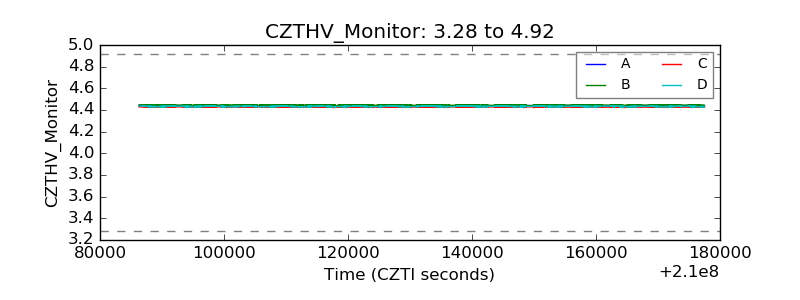 |
| D_VDD | 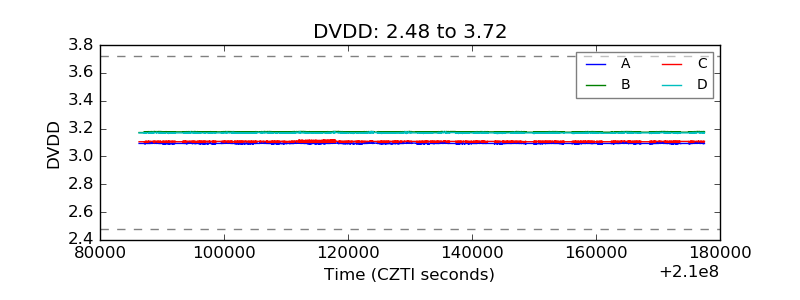 |
| Temperature 1 | 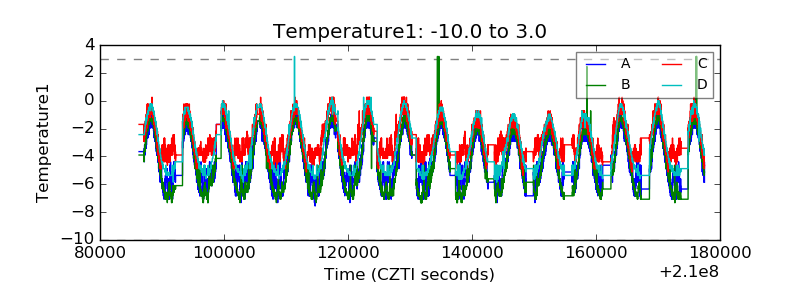 |
| Veto HV Monitor | 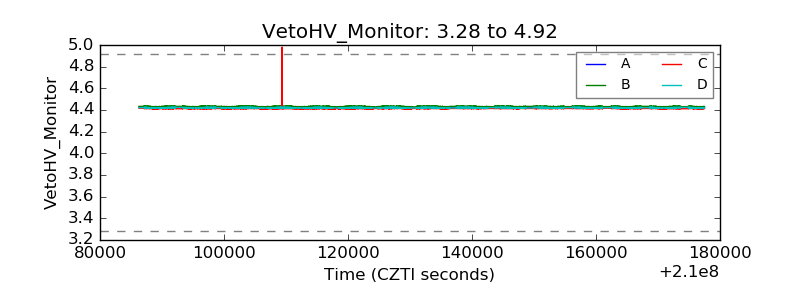 |
| Veto LLD | 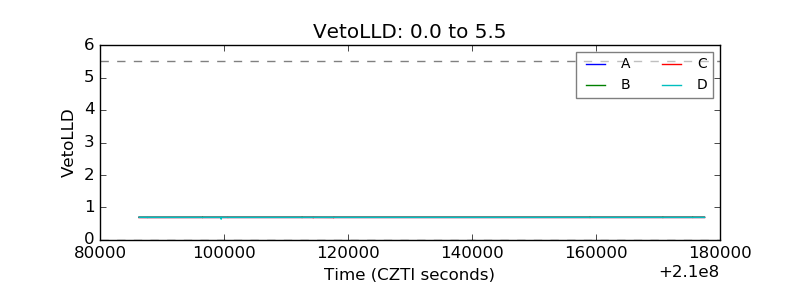 |
| Alpha Counter | 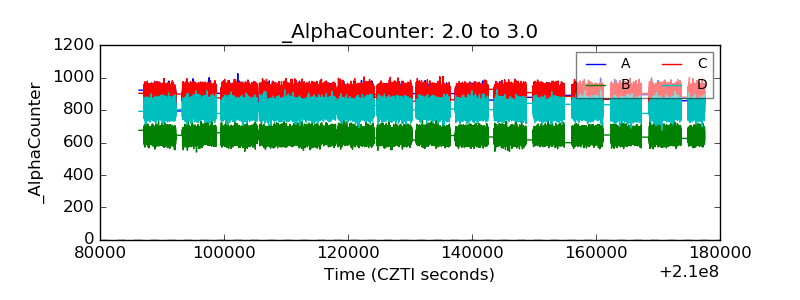 |
| _CPM_Rate | 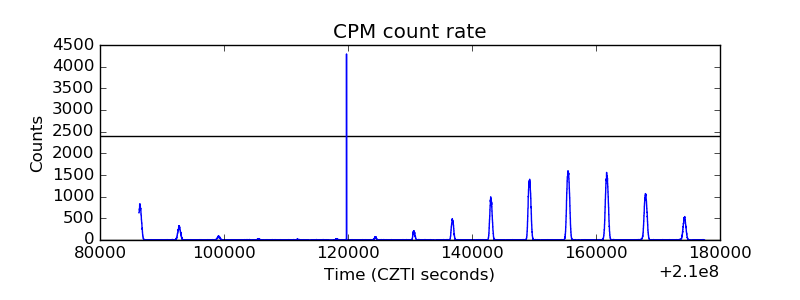 |
| CZT Counter | 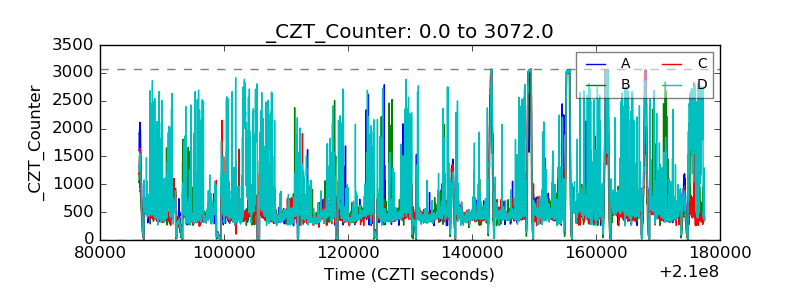 |
| +2.5 Volts monitor | 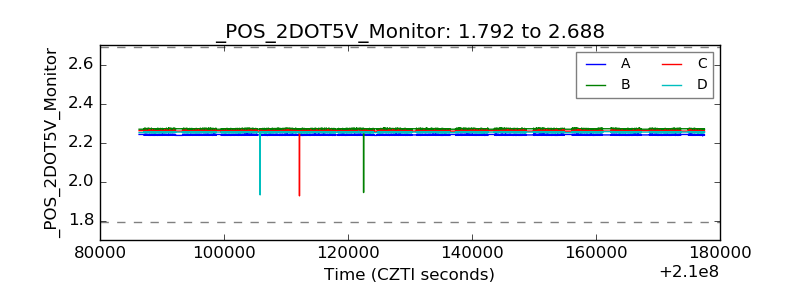 |
| +5 Volts monitor | 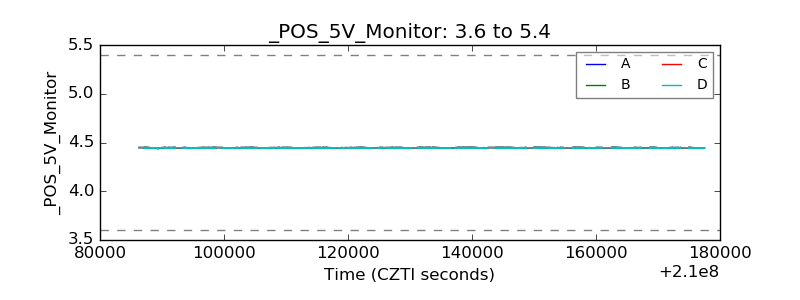 |
| _ROLL_ROT | 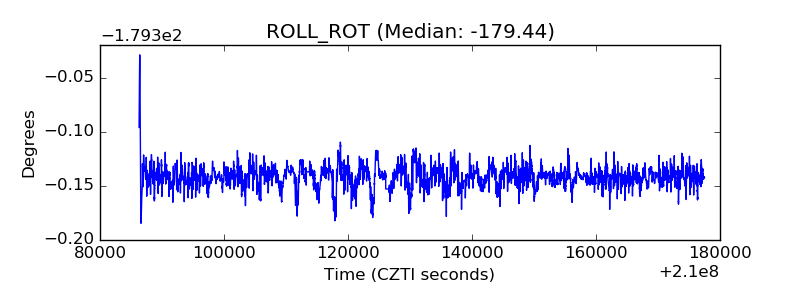 |
| _Roll_DEC | 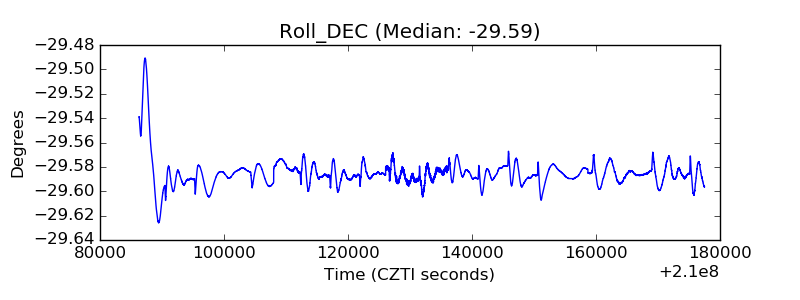 |
| _Roll_RA | 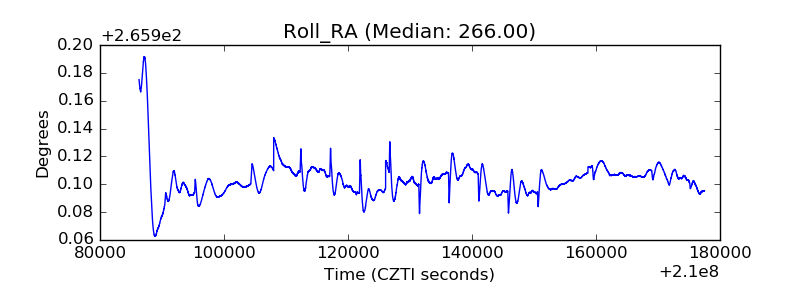 |
| Veto Counter | 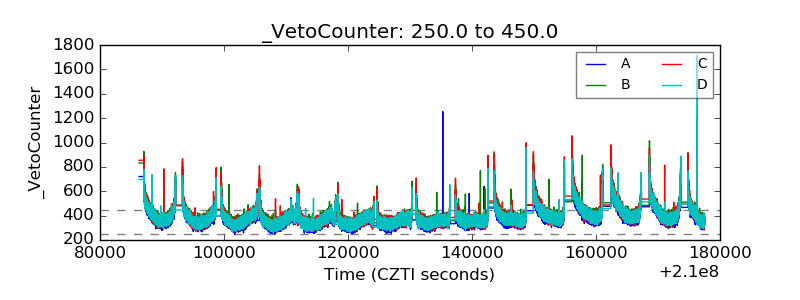 |