| Param | Original file | Final file |
|---|---|---|
| Filename | modeM0/AS1G05_158T01_9000000630_04965cztM0_level2.evt | modeM0/AS1G05_158T01_9000000630_04965cztM0_level2_quad_clean.evt |
| Size (bytes) | 110,810,880 | 25,899,840 |
| Size | 105.7 MB | 24.7 MB |
| Events in quadrant A | 746,982 | 172,662 |
| Events in quadrant B | 795,013 | 175,440 |
| Events in quadrant C | 722,521 | 171,691 |
| Events in quadrant D | 993,807 | 160,000 |
| Mode M9 | |||
|---|---|---|---|
| Quadrant | BADHDUFLAG | Total packets | Discarded packets |
| A | 0 | 8 | 0 |
| B | 0 | 8 | 0 |
| C | 0 | 8 | 0 |
| D | 0 | 8 | 0 |
| Mode M0 | |||
|---|---|---|---|
| Quadrant | BADHDUFLAG | Total packets | Discarded packets |
| A | 0 | 2985 | 2 |
| B | 0 | 3147 | 1 |
| C | 0 | 2950 | 1 |
| D | 0 | 3839 | 1 |
| Mode SS | |||
|---|---|---|---|
| Quadrant | BADHDUFLAG | Total packets | Discarded packets |
| A | 0 | 28 | 0 |
| B | 0 | 28 | 0 |
| C | 0 | 28 | 0 |
| D | 0 | 28 | 0 |
| Quadrant | Total seconds | Saturated seconds | Saturation percentage |
|---|---|---|---|
| A | 1394 | 17 | 1.219512% |
| B | 1394 | 7 | 0.502152% |
| C | 1394 | 3 | 0.215208% |
| D | 1394 | 73 | 5.236729% |
Noise dominated data is calculated using 1-second bins in cleaned event files. If a bin has >2000 counts, and if more than 50% of those come from <1% of pixels, then it is considered to be noise-dominated and hence unusable.
| Quadrant | # 1 sec bins | Bins with >0 counts | Bins with >2000 counts | High rate bins dominated by noise | Noise dominated (total time) | Noise dominated (detector-on time) | Marked lightcurve |
|---|---|---|---|---|---|---|---|
| A | 1394 | 1394 | 2 | 2 | 0.14% | 0.14% |  |
| B | 1394 | 1394 | 0 | 0 | 0.00% | 0.00% | 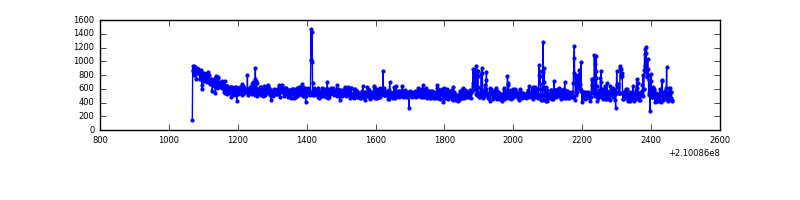 |
| C | 1394 | 1394 | 2 | 2 | 0.14% | 0.14% | 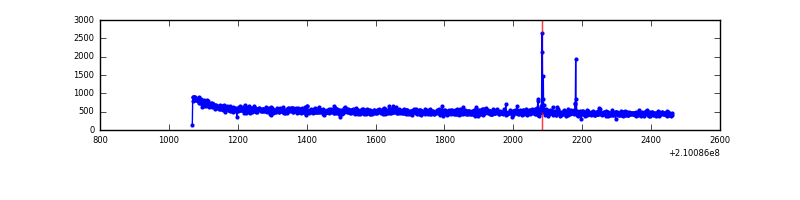 |
| D | 1394 | 1394 | 66 | 66 | 4.73% | 4.73% | 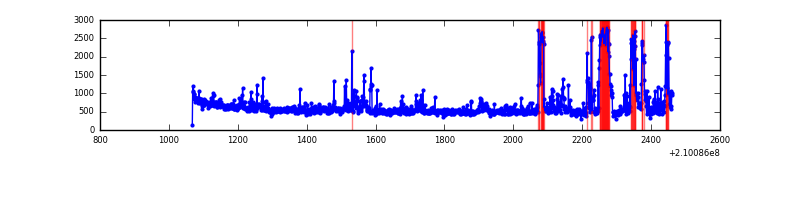 |
Top three noisy pixels from each quadrant. If the there are fewer than three noisy pixels in the level2.evt file, extra rows are filled as -1
| Pixel properties | Quadrant properties | ||||||
|---|---|---|---|---|---|---|---|
| Quadrant | DetID | PixID | Counts | Sigma | Mean | Median | Sigma |
| A | 0 | 50 | 9023 | 219.26 | 190 | 187 | 40.3 |
| A | 13 | 251 | 2132 | 48.27 | 190 | 187 | 40.3 |
| A | 12 | 194 | 1961 | 44.02 | 190 | 187 | 40.3 |
| B | 15 | 54 | 25722 | 652.8 | 190 | 185 | 39.1 |
| B | 15 | 204 | 23149 | 587.03 | 190 | 185 | 39.1 |
| B | 0 | 183 | 4664 | 114.5 | 190 | 185 | 39.1 |
| C | 1 | 16 | 12382 | 281.33 | 181 | 181 | 43.4 |
| C | 13 | 61 | 1515 | 30.76 | 181 | 181 | 43.4 |
| C | 14 | 67 | 812 | 14.55 | 181 | 181 | 43.4 |
| D | 2 | 33 | 185921 | 3860.51 | 183 | 177 | 48.1 |
| D | 2 | 136 | 50929 | 1054.83 | 183 | 177 | 48.1 |
| D | 10 | 15 | 16367 | 336.49 | 183 | 177 | 48.1 |
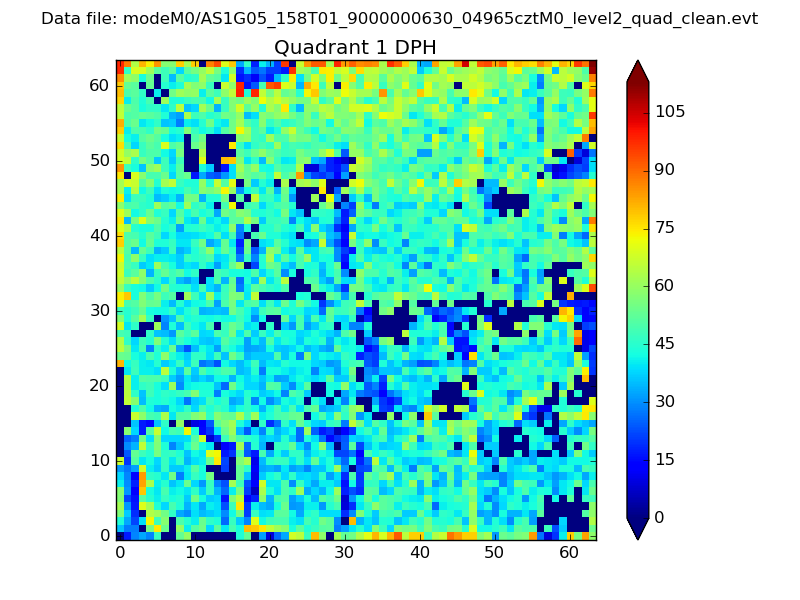
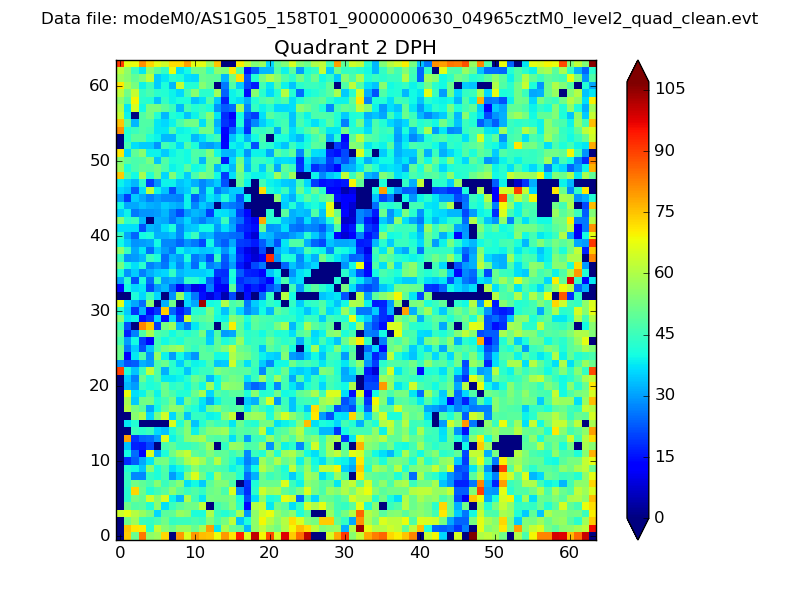
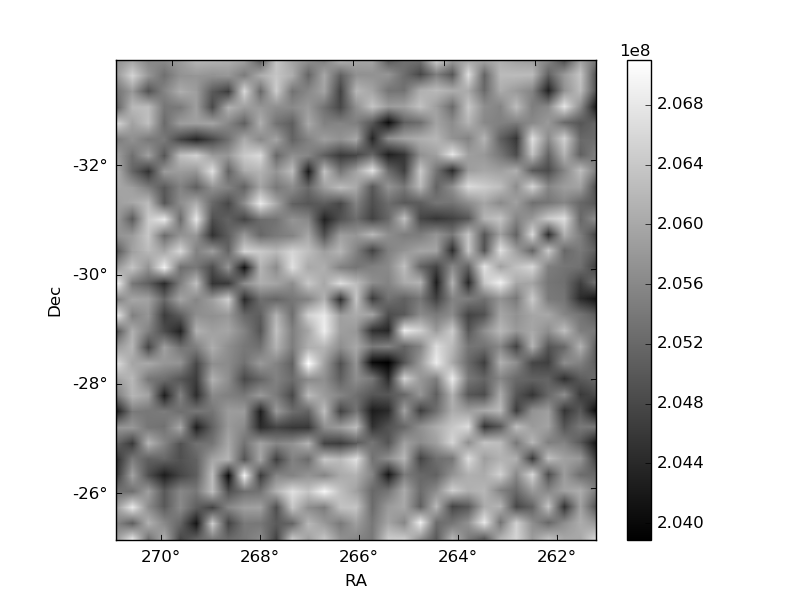
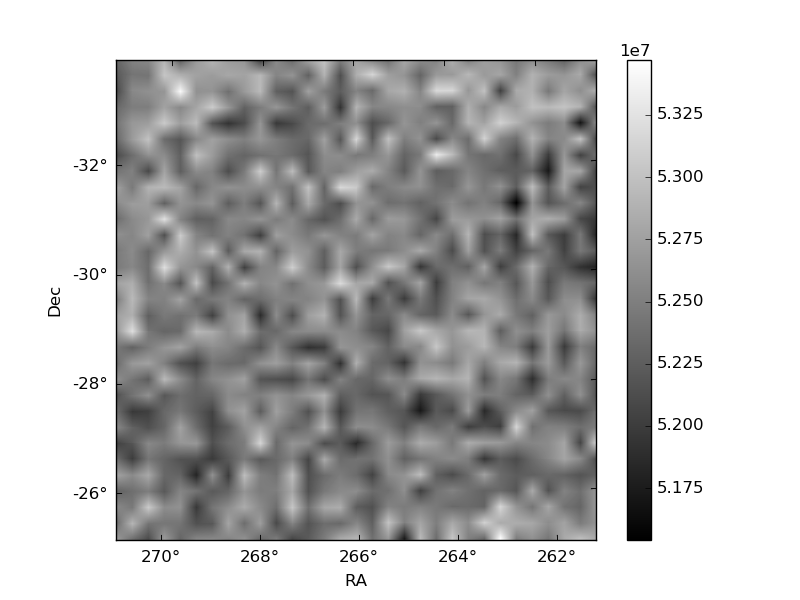
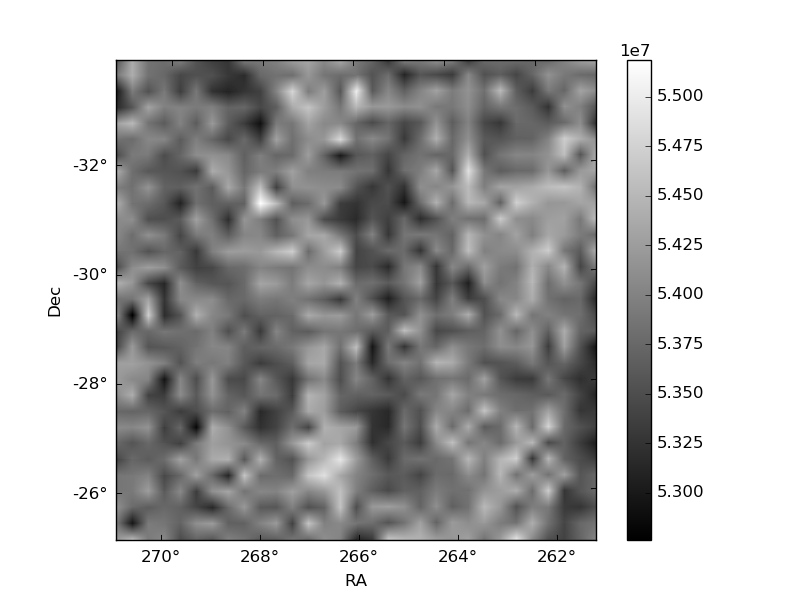
Histogram calculated using DETX and DETY for each event in the final _common_clean file
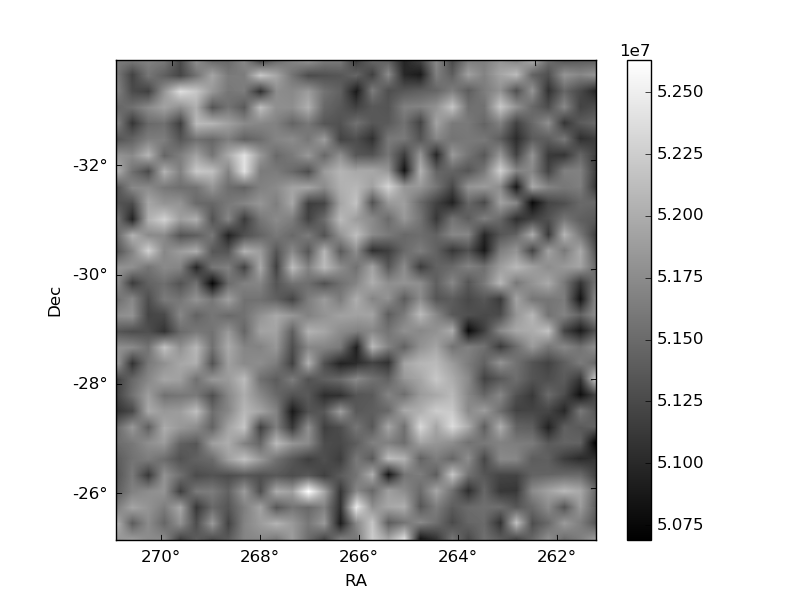
| Quadrant A | 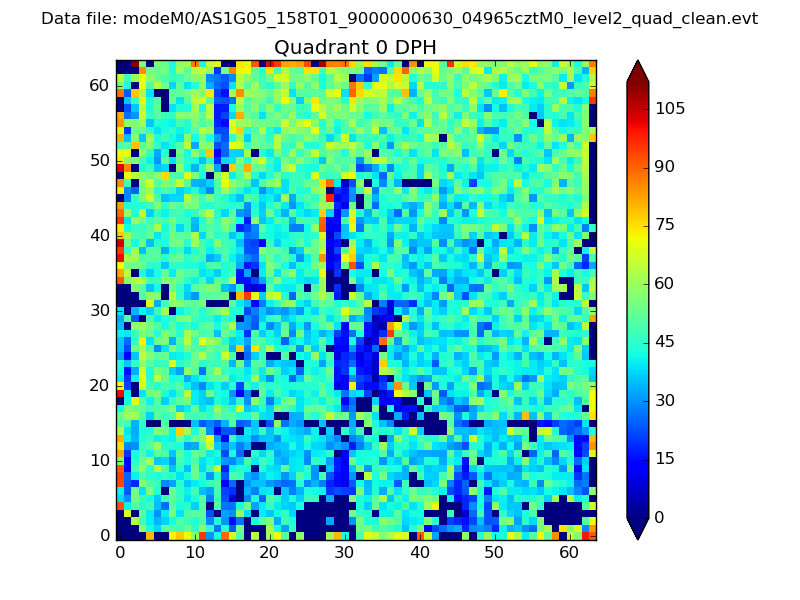 |
 |
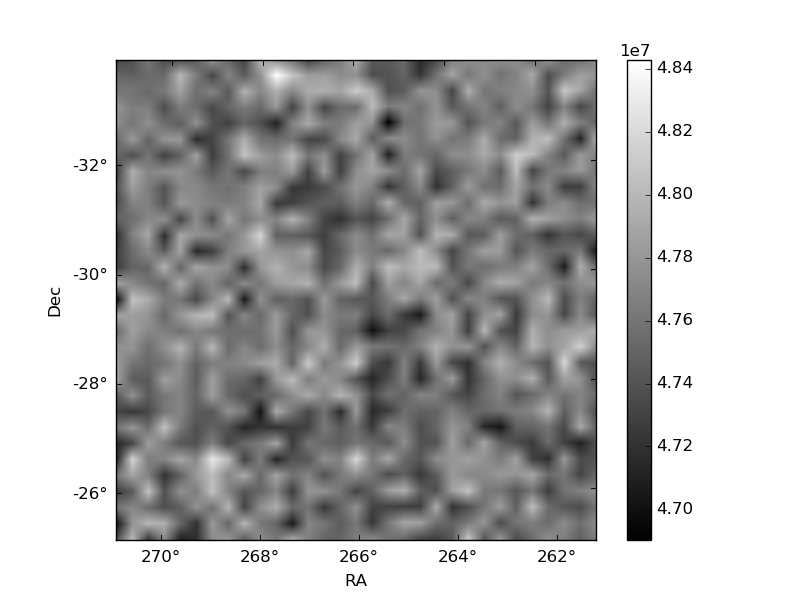
Quadrant B |
|---|---|---|---|
| Quadrant D | 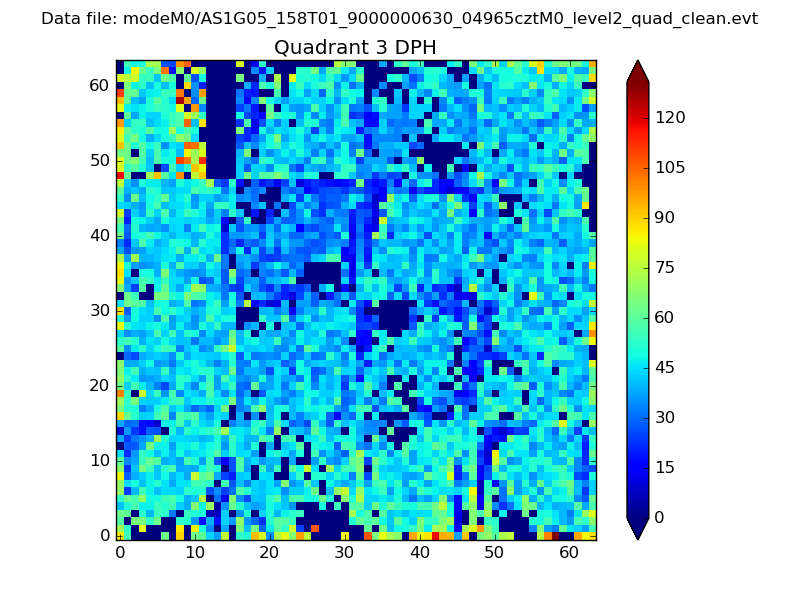 |
 |
Quadrant C |
| Plot type | Count rate plots | Images |
|---|---|---|
| Comparison with Poisson distribution Blue bars denote a histogram of data divided into 1 sec bins. Red curve is a Poisson curve with rate = median count rate of data. |
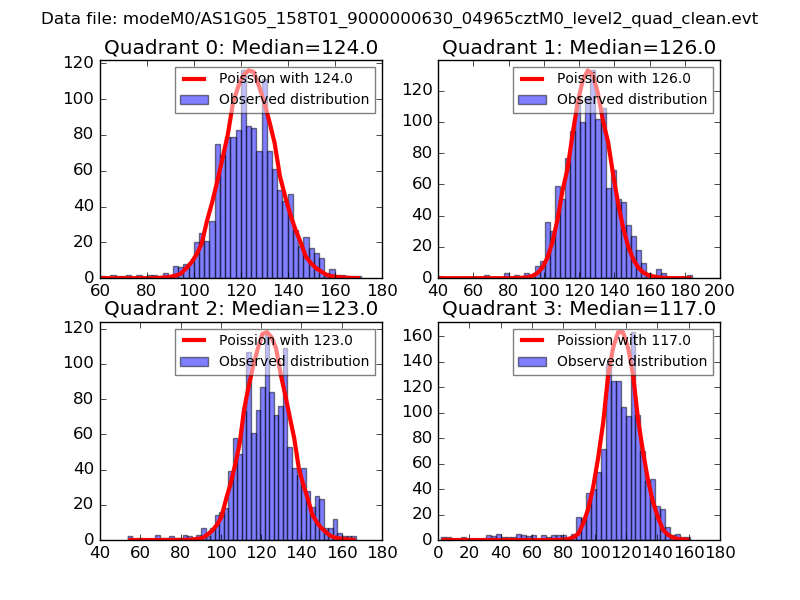 |
 |
| Quadrant-wise count rates Data is divided into 100 sec bins |
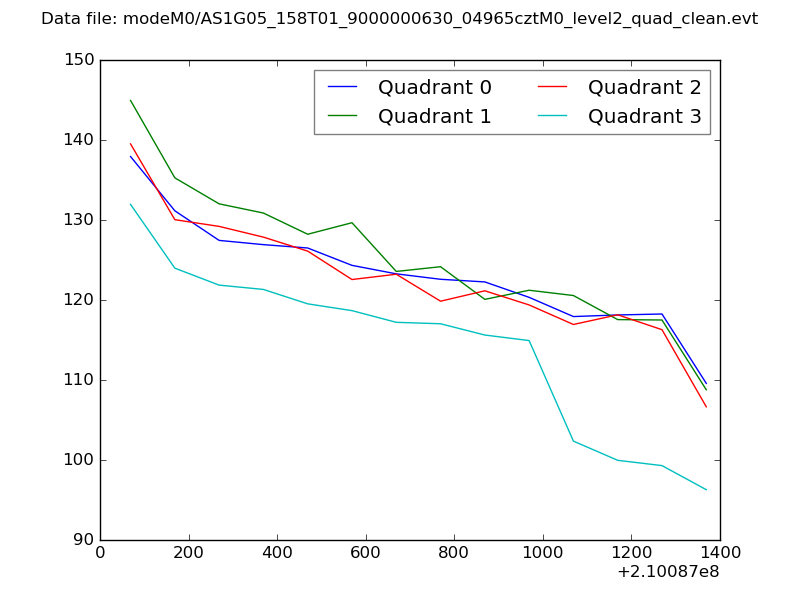 |
|
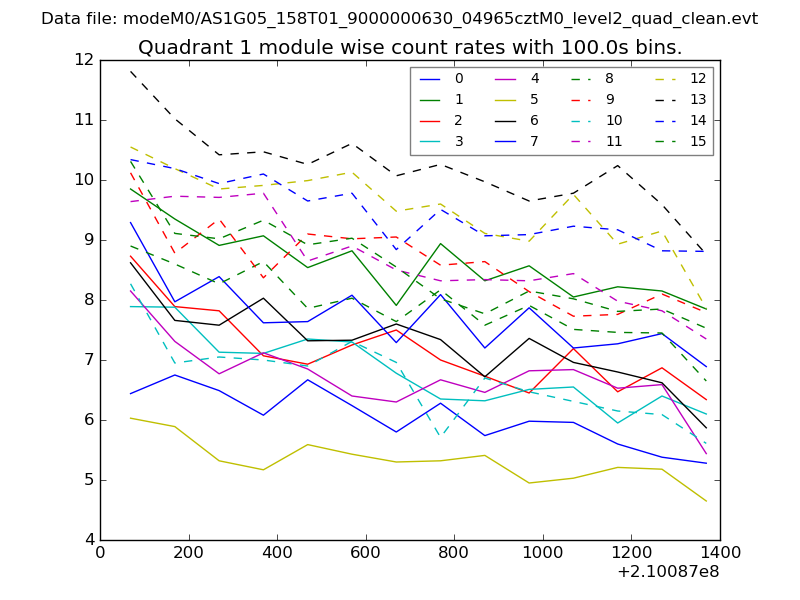
| Module-wise count rates for Quadrant A Data is divided into 100 sec bins |
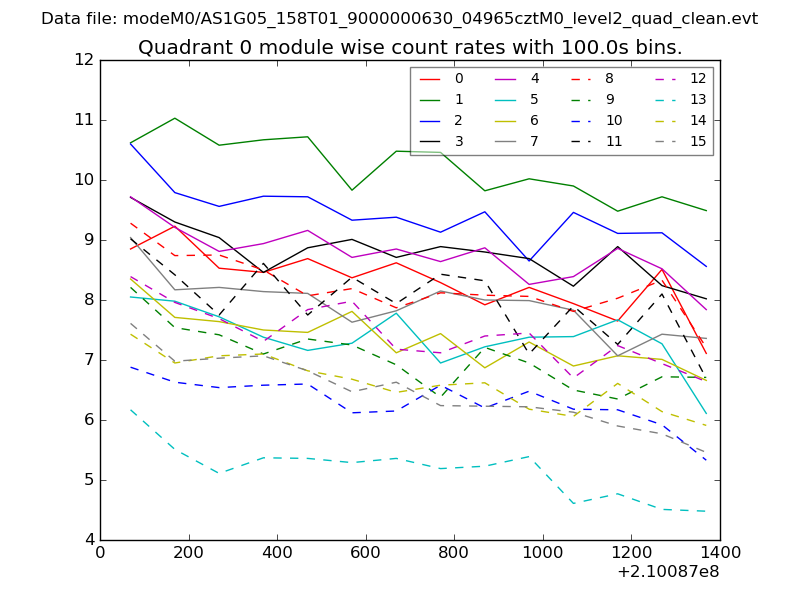 |
 |
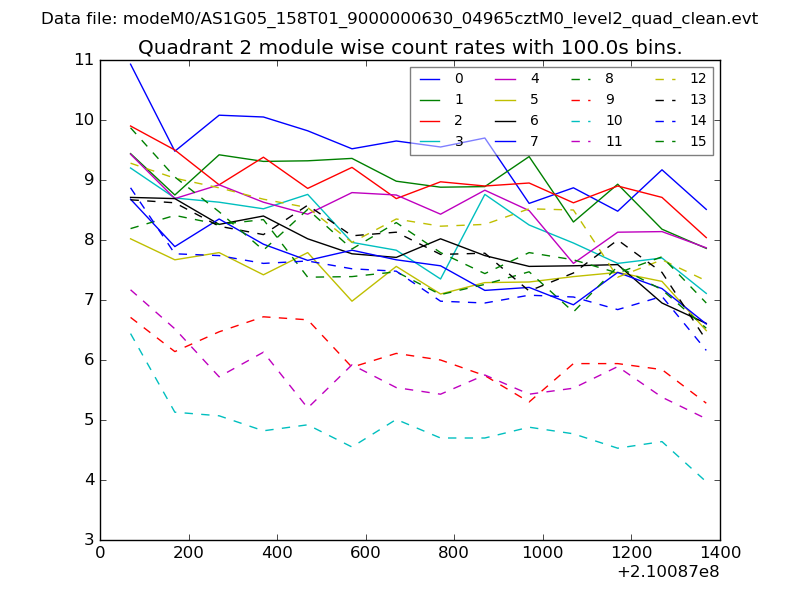
| Module-wise count rates for Quadrant B Data is divided into 100 sec bins |
 |
 |
| Module-wise count rates for Quadrant C Data is divided into 100 sec bins |
 |
 |
| Module-wise count rates for Quadrant D Data is divided into 100 sec bins |
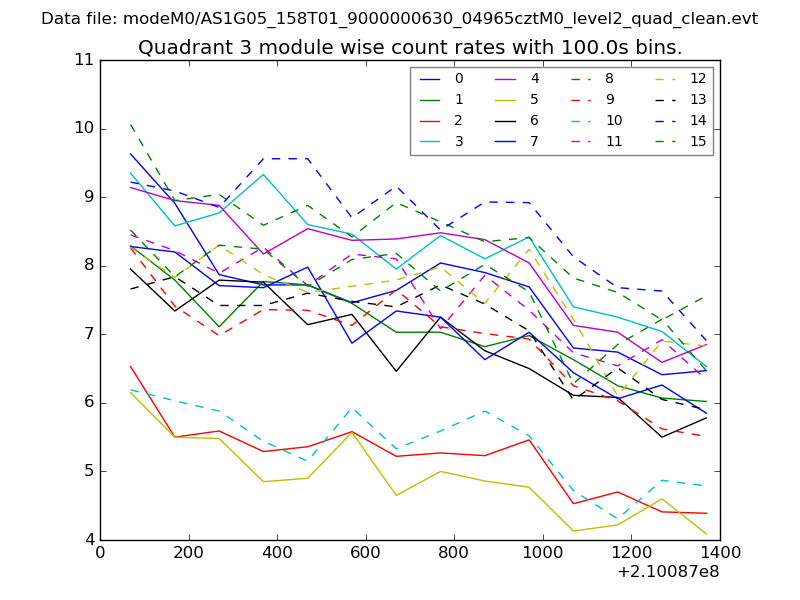 |
 |
| Parameter | Plot |
|---|---|
| CZT HV Monitor | 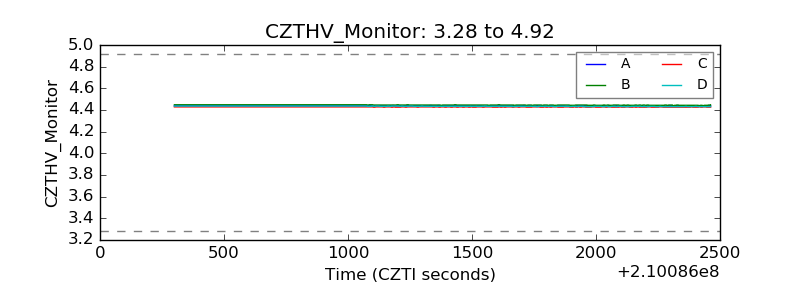 |
| D_VDD | 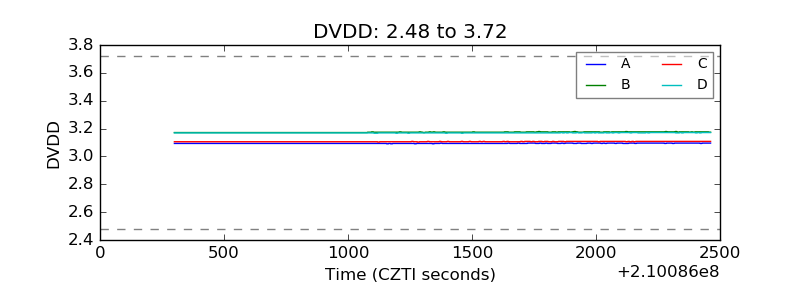 |
| Temperature 1 | 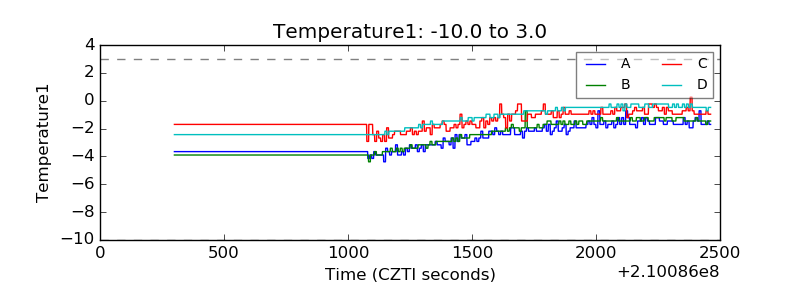 |
| Veto HV Monitor | 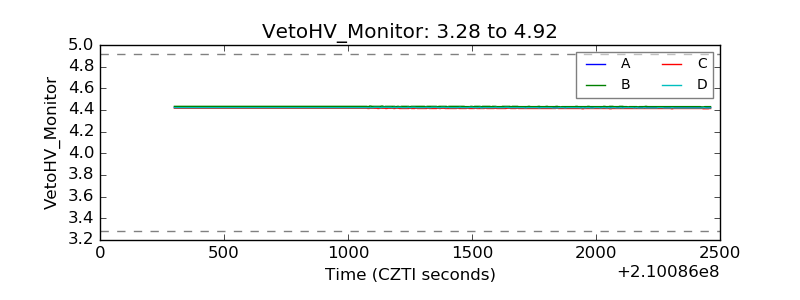 |
| Veto LLD | 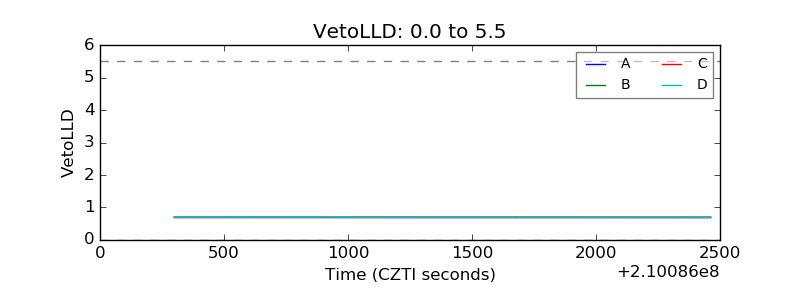 |
| Alpha Counter | 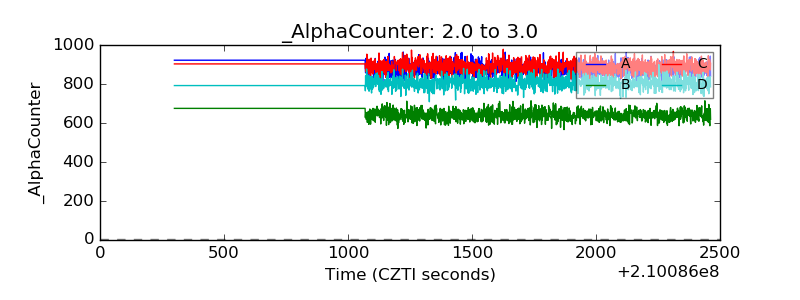 |
| _CPM_Rate | 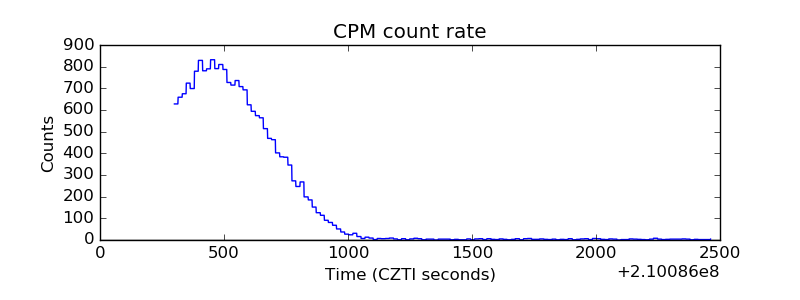 |
| CZT Counter | 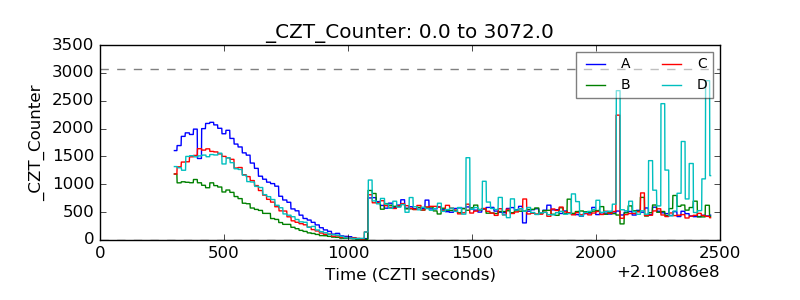 |
| +2.5 Volts monitor |  |
| +5 Volts monitor |  |
| _ROLL_ROT | 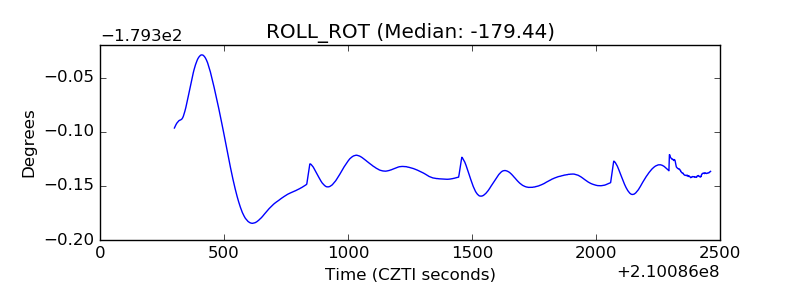 |
| _Roll_DEC | 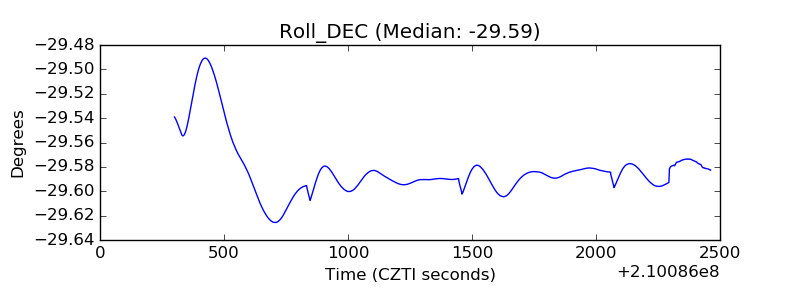 |
| _Roll_RA | 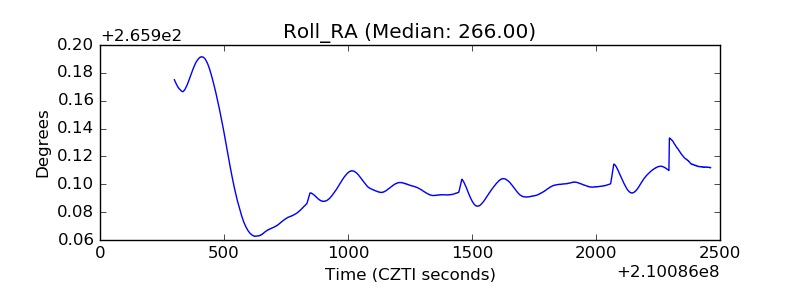 |
| Veto Counter | 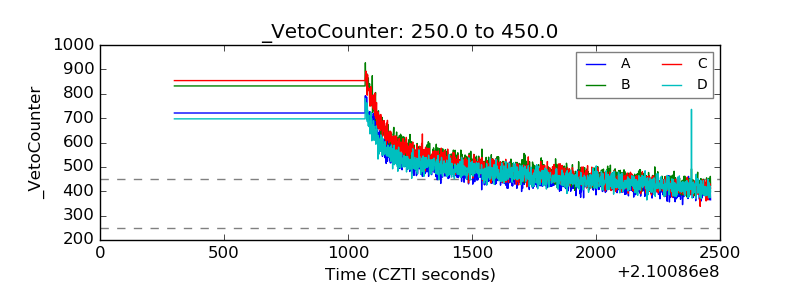 |