| Param | Original file | Final file |
|---|---|---|
| Filename | modeM0/AS1G05_158T01_9000000630_04966cztM0_level2.evt | modeM0/AS1G05_158T01_9000000630_04966cztM0_level2_quad_clean.evt |
| Size (bytes) | 481,403,520 | 84,925,440 |
| Size | 459.1 MB | 81.0 MB |
| Events in quadrant A | 3,023,771 | 543,802 |
| Events in quadrant B | 3,661,860 | 540,834 |
| Events in quadrant C | 2,911,375 | 542,032 |
| Events in quadrant D | 4,552,078 | 502,785 |
| Mode M9 | |||
|---|---|---|---|
| Quadrant | BADHDUFLAG | Total packets | Discarded packets |
| A | 0 | 12 | 0 |
| B | 0 | 12 | 0 |
| C | 0 | 12 | 0 |
| D | 0 | 12 | 0 |
| Mode M0 | |||
|---|---|---|---|
| Quadrant | BADHDUFLAG | Total packets | Discarded packets |
| A | 0 | 13232 | 2 |
| B | 0 | 14997 | 1 |
| C | 0 | 13128 | 1 |
| D | 0 | 17843 | 1 |
| Mode SS | |||
|---|---|---|---|
| Quadrant | BADHDUFLAG | Total packets | Discarded packets |
| A | 0 | 126 | 0 |
| B | 0 | 126 | 0 |
| C | 0 | 126 | 0 |
| D | 0 | 126 | 0 |
| Quadrant | Total seconds | Saturated seconds | Saturation percentage |
|---|---|---|---|
| A | 6346 | 86 | 1.355184% |
| B | 6346 | 108 | 1.701859% |
| C | 6346 | 29 | 0.456981% |
| D | 6346 | 376 | 5.924992% |
Noise dominated data is calculated using 1-second bins in cleaned event files. If a bin has >2000 counts, and if more than 50% of those come from <1% of pixels, then it is considered to be noise-dominated and hence unusable.
| Quadrant | # 1 sec bins | Bins with >0 counts | Bins with >2000 counts | High rate bins dominated by noise | Noise dominated (total time) | Noise dominated (detector-on time) | Marked lightcurve |
|---|---|---|---|---|---|---|---|
| A | 7461 | 6346 | 6 | 6 | 0.08% | 0.09% | 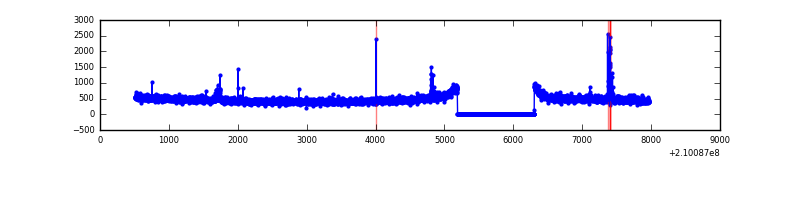 |
| B | 7461 | 6346 | 11 | 11 | 0.15% | 0.17% | 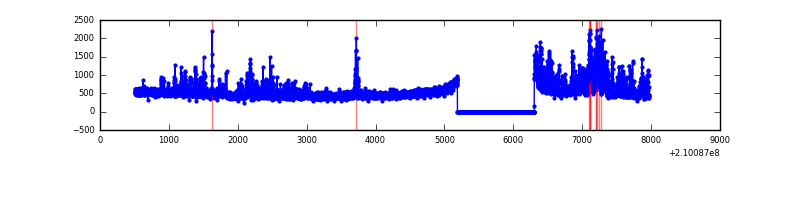 |
| C | 7461 | 6346 | 6 | 6 | 0.08% | 0.09% | 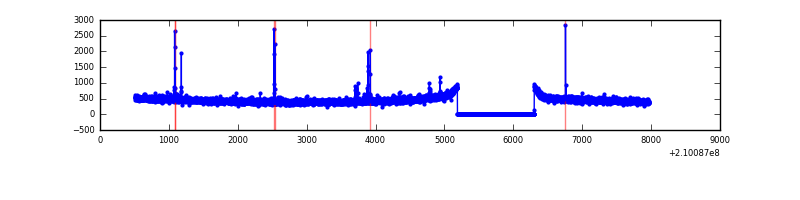 |
| D | 7461 | 6346 | 347 | 347 | 4.65% | 5.47% | 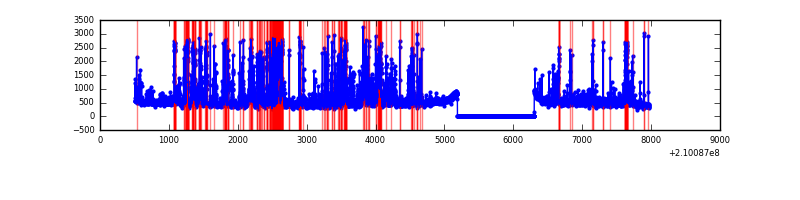 |
Top three noisy pixels from each quadrant. If the there are fewer than three noisy pixels in the level2.evt file, extra rows are filled as -1
| Pixel properties | Quadrant properties | ||||||
|---|---|---|---|---|---|---|---|
| Quadrant | DetID | PixID | Counts | Sigma | Mean | Median | Sigma |
| A | 15 | 234 | 29127 | 181.69 | 766 | 749 | 156.2 |
| A | 0 | 50 | 18420 | 113.14 | 766 | 749 | 156.2 |
| A | 13 | 251 | 13410 | 81.06 | 766 | 749 | 156.2 |
| B | 15 | 204 | 554236 | 3741.95 | 767 | 751 | 147.9 |
| B | 15 | 54 | 44780 | 297.67 | 767 | 751 | 147.9 |
| B | 4 | 239 | 24288 | 159.13 | 767 | 751 | 147.9 |
| C | 1 | 16 | 42850 | 248.99 | 733 | 735 | 169.1 |
| C | 13 | 61 | 5950 | 30.83 | 733 | 735 | 169.1 |
| C | 1 | 3 | 5946 | 30.81 | 733 | 735 | 169.1 |
| D | 2 | 33 | 772607 | 4316.2 | 725 | 703 | 178.8 |
| D | 13 | 235 | 533767 | 2980.69 | 725 | 703 | 178.8 |
| D | 12 | 233 | 182926 | 1018.92 | 725 | 703 | 178.8 |
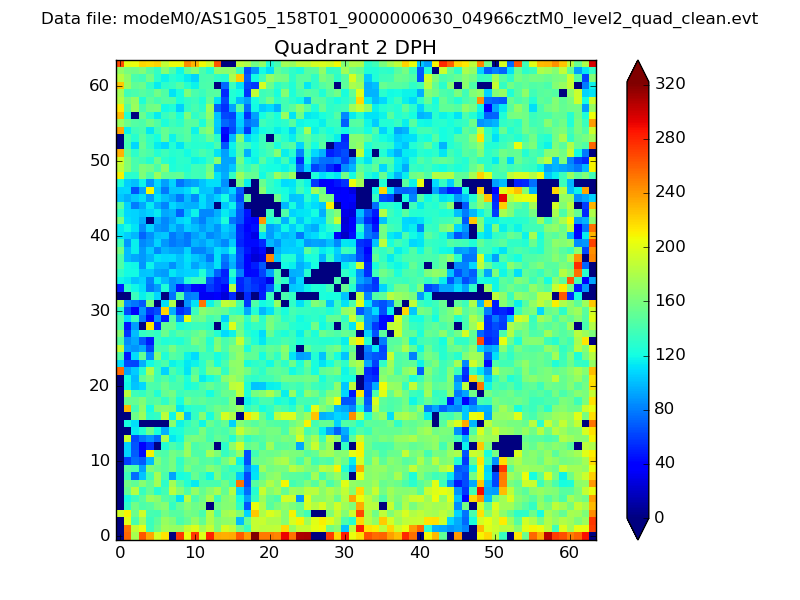
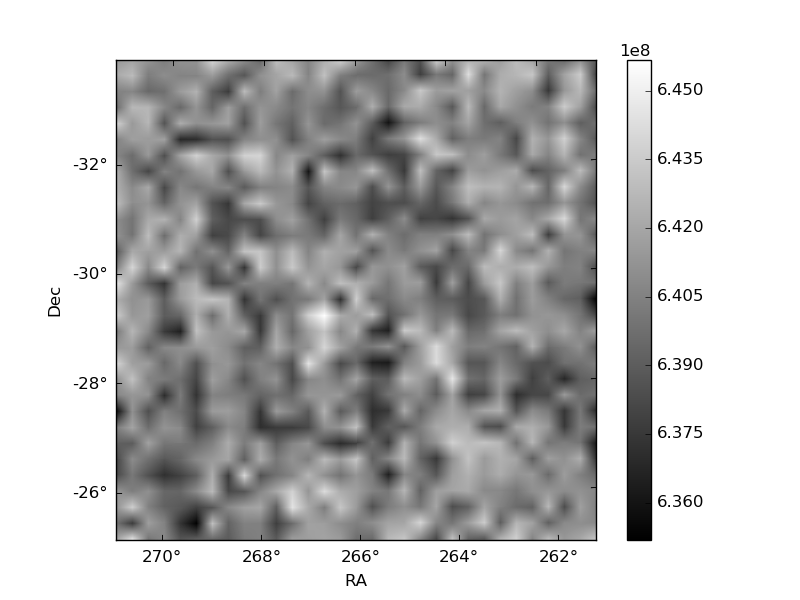
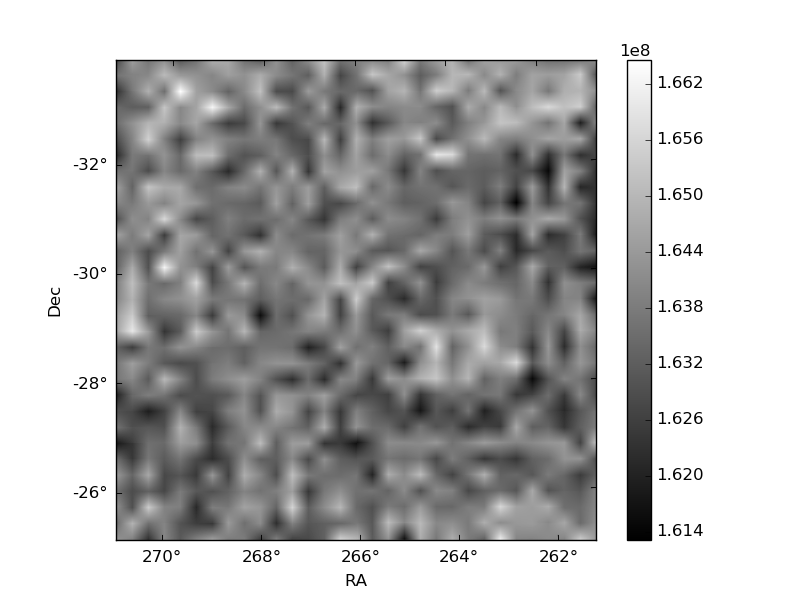
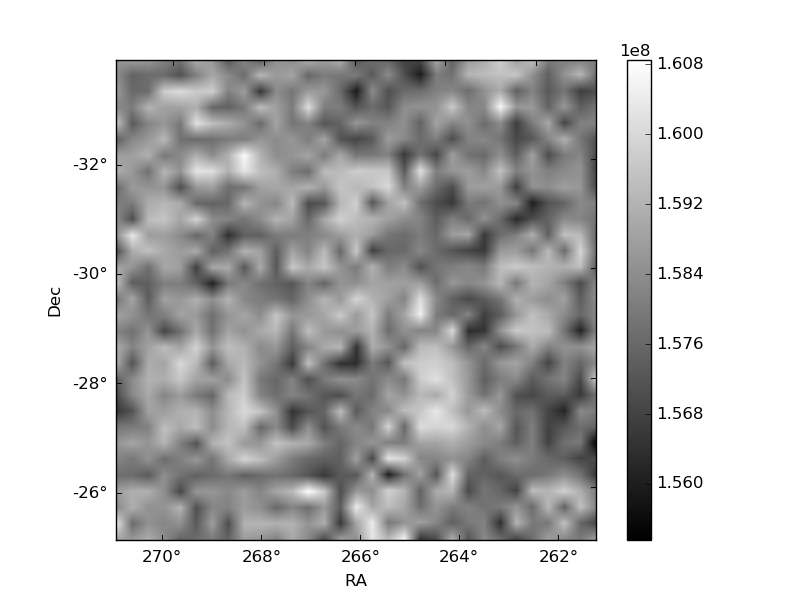
Histogram calculated using DETX and DETY for each event in the final _common_clean file
| Quadrant A | 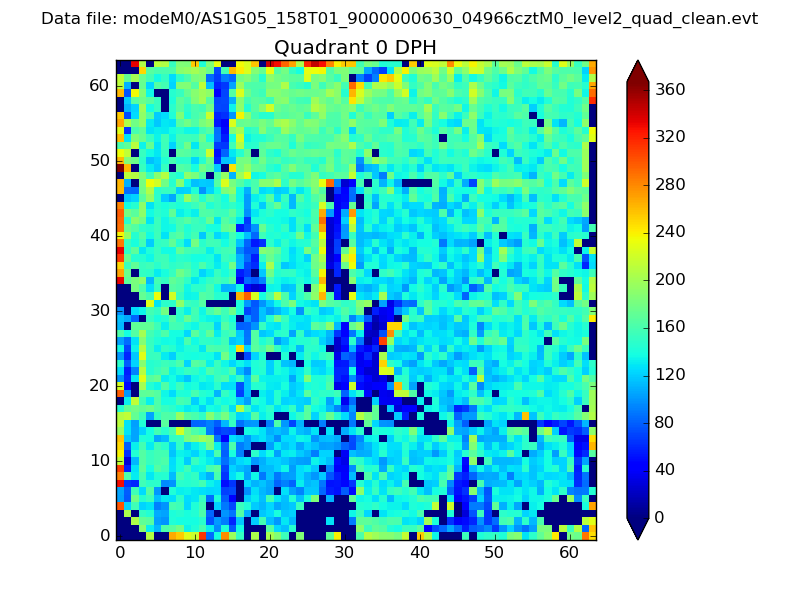 |
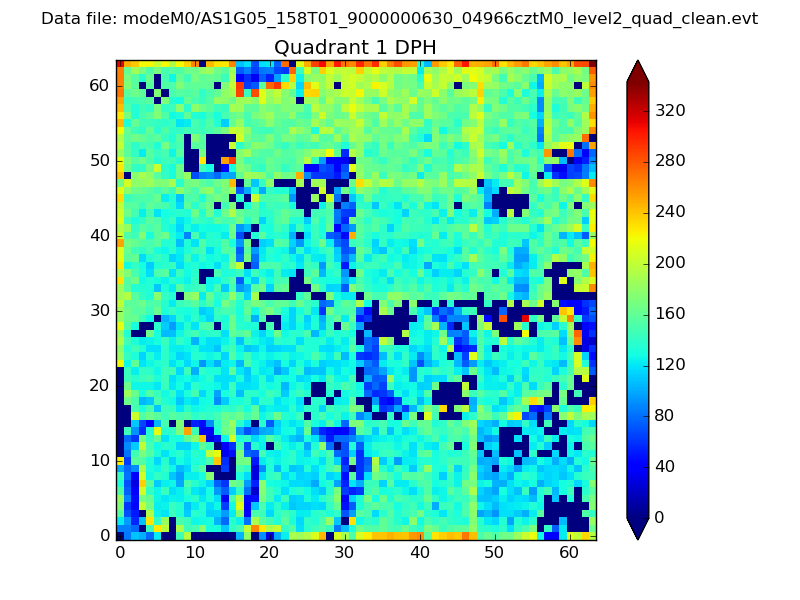 |
Quadrant B |
|---|---|---|---|
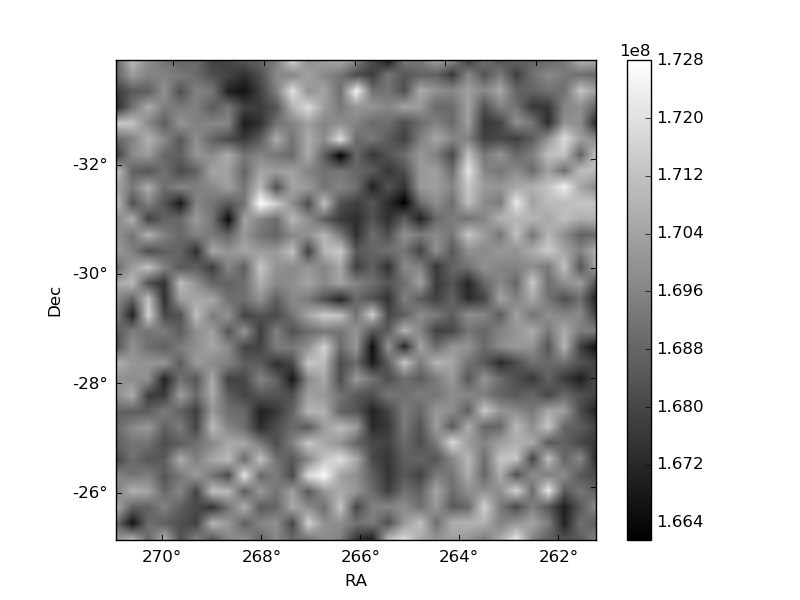
| Quadrant D | 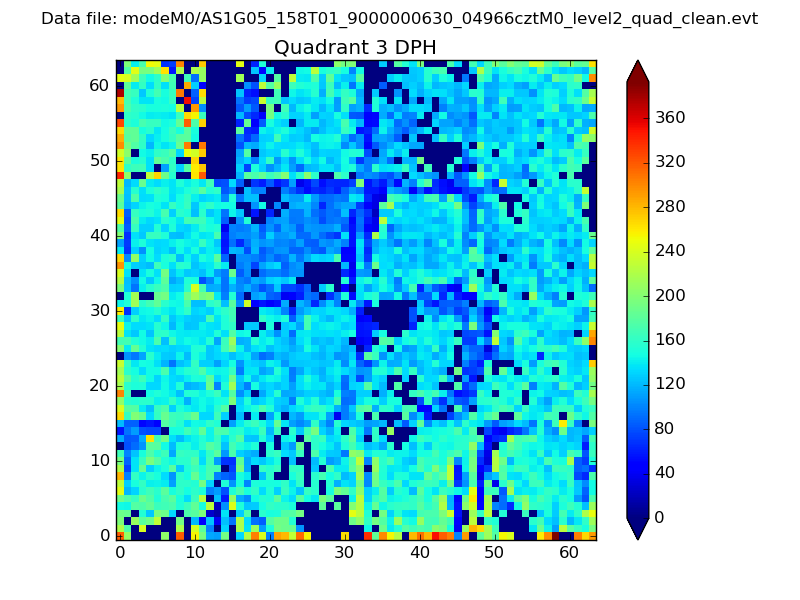 |
 |
Quadrant C |
| Plot type | Count rate plots | Images |
|---|---|---|
| Comparison with Poisson distribution Blue bars denote a histogram of data divided into 1 sec bins. Red curve is a Poisson curve with rate = median count rate of data. |
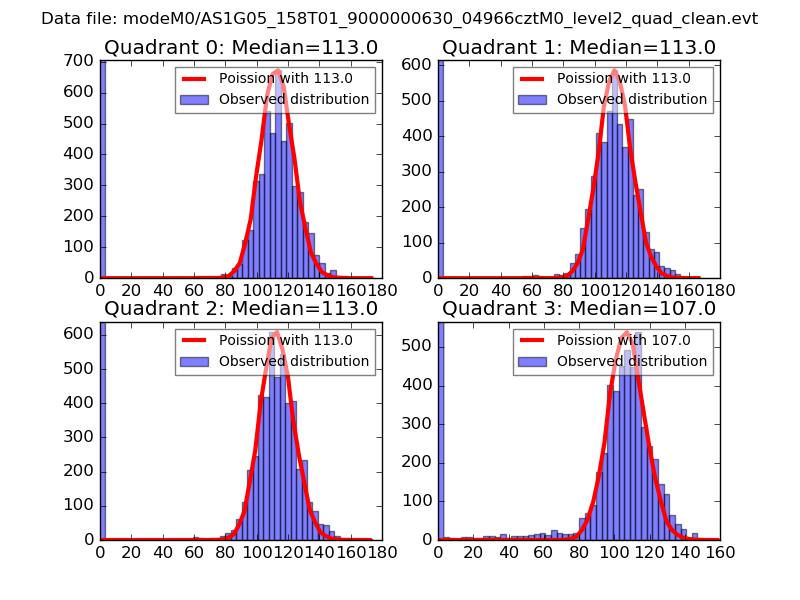 |
 |
| Quadrant-wise count rates Data is divided into 100 sec bins |
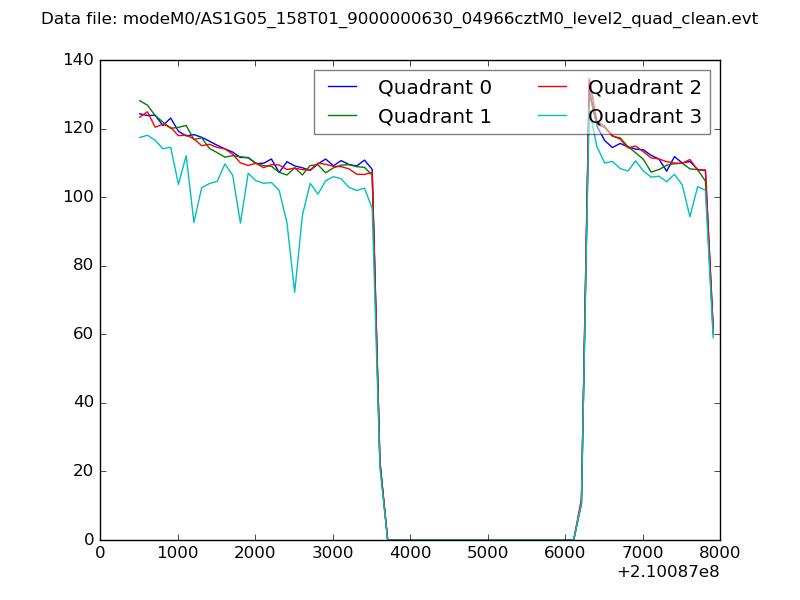 |
|
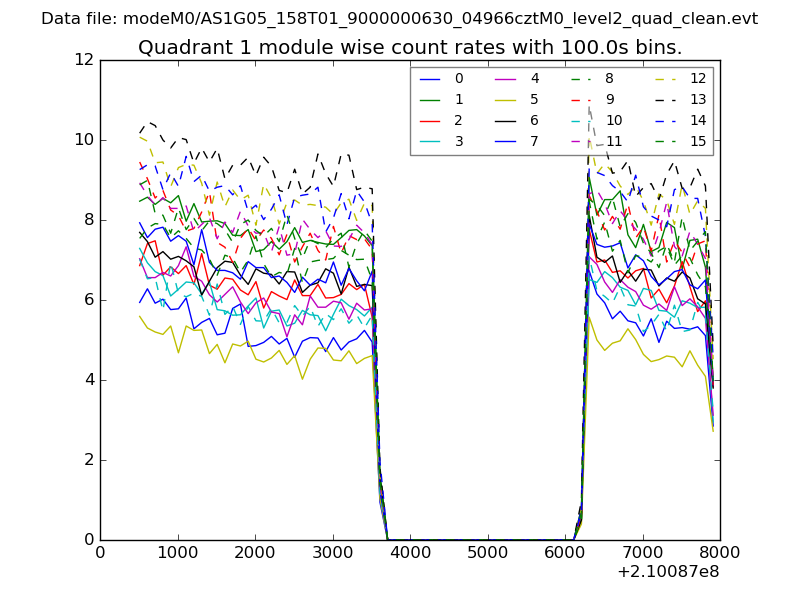
| Module-wise count rates for Quadrant A Data is divided into 100 sec bins |
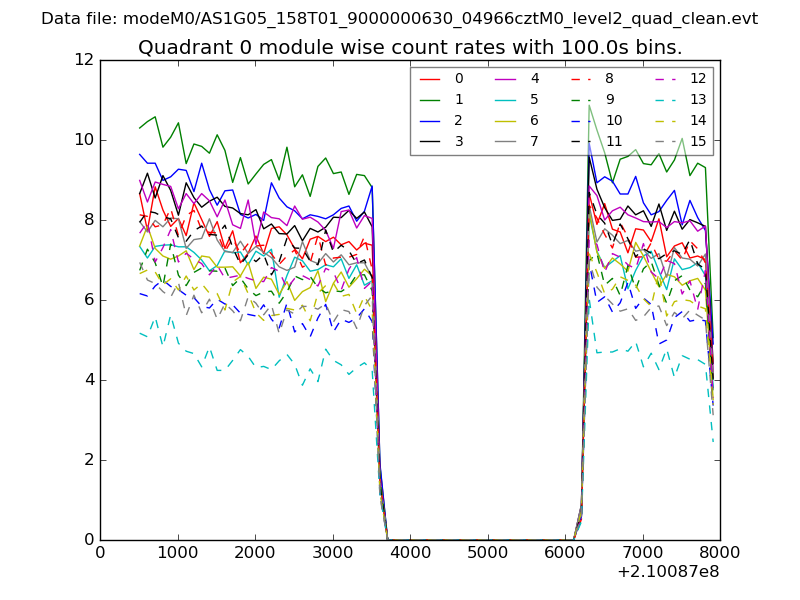 |
 |
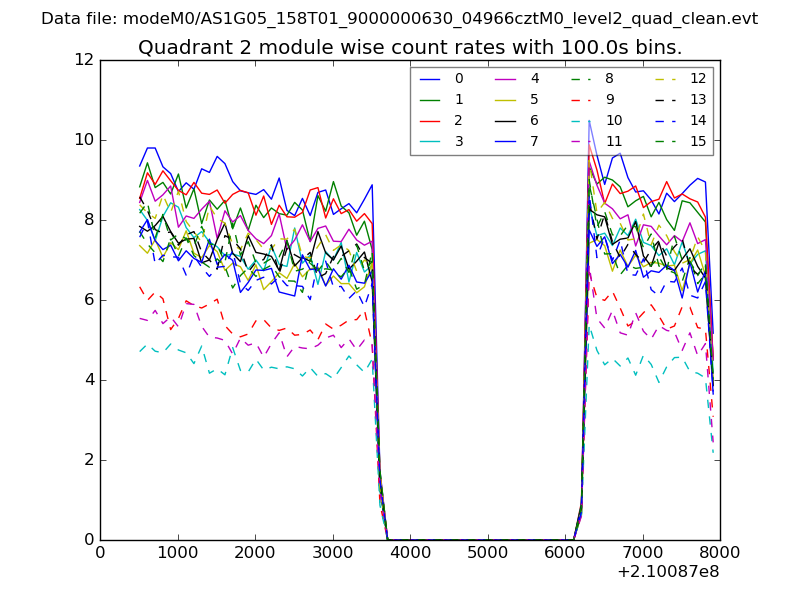
| Module-wise count rates for Quadrant B Data is divided into 100 sec bins |
 |
 |
| Module-wise count rates for Quadrant C Data is divided into 100 sec bins |
 |
 |
| Module-wise count rates for Quadrant D Data is divided into 100 sec bins |
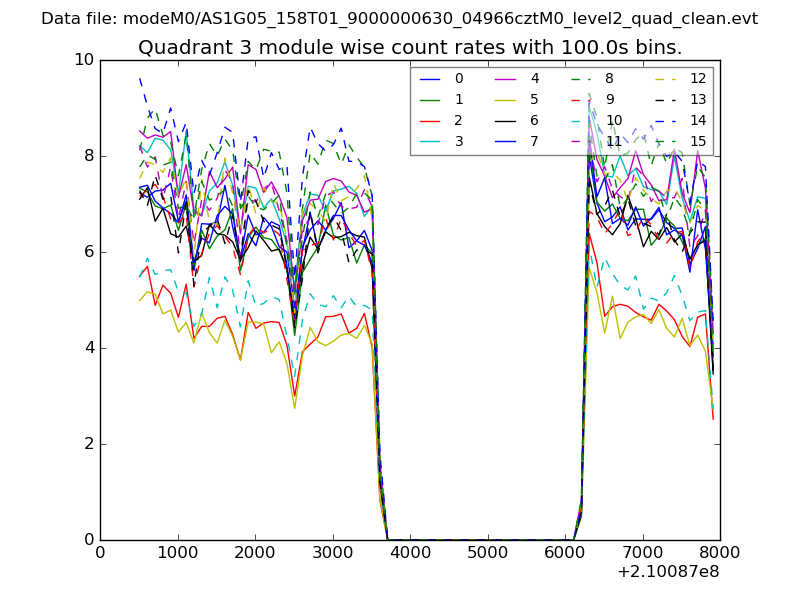 |
 |
| Parameter | Plot |
|---|---|
| CZT HV Monitor | 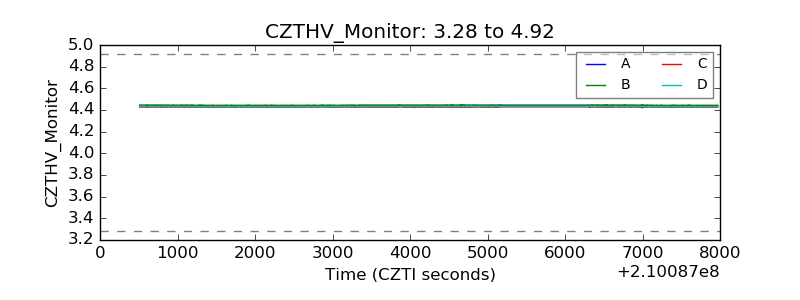 |
| D_VDD | 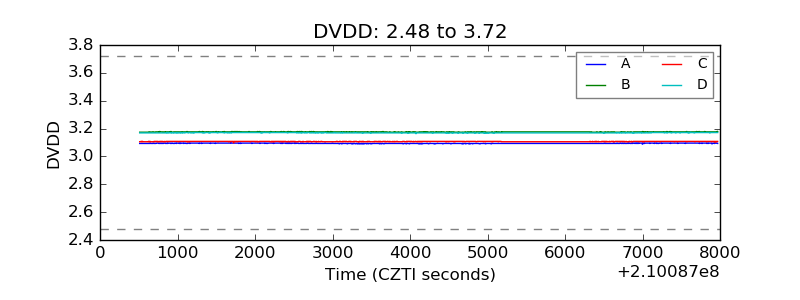 |
| Temperature 1 | 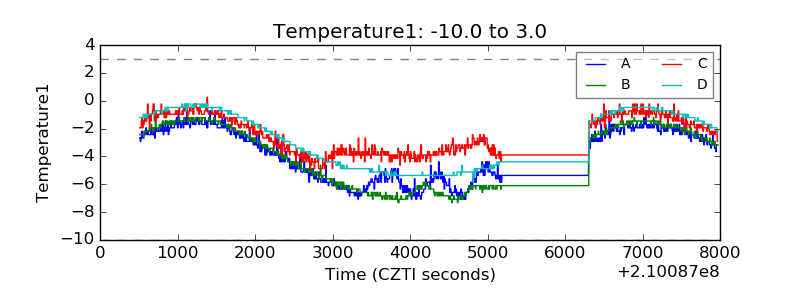 |
| Veto HV Monitor | 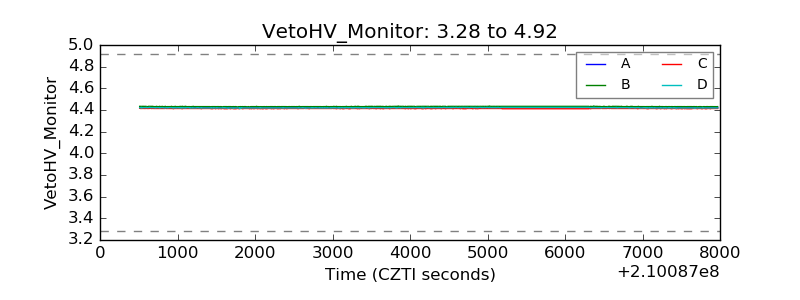 |
| Veto LLD | 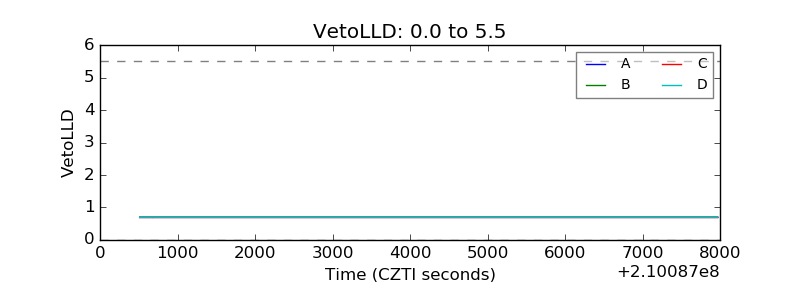 |
| Alpha Counter | 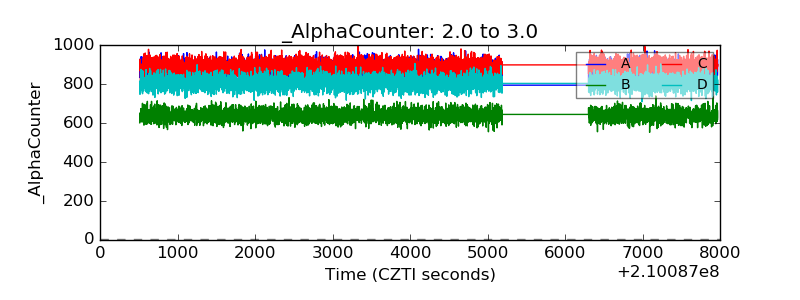 |
| _CPM_Rate | 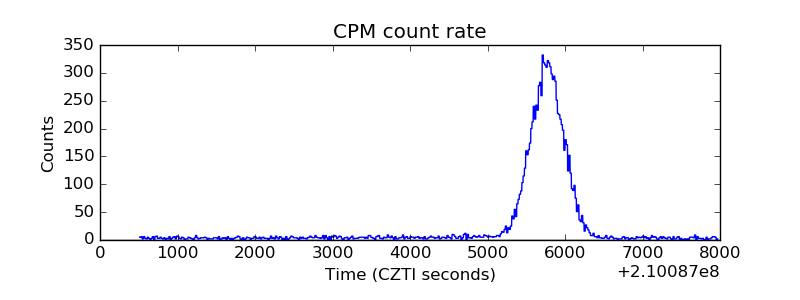 |
| CZT Counter | 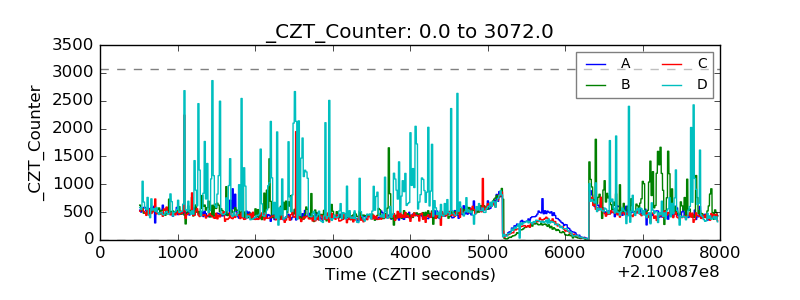 |
| +2.5 Volts monitor |  |
| +5 Volts monitor |  |
| _ROLL_ROT | 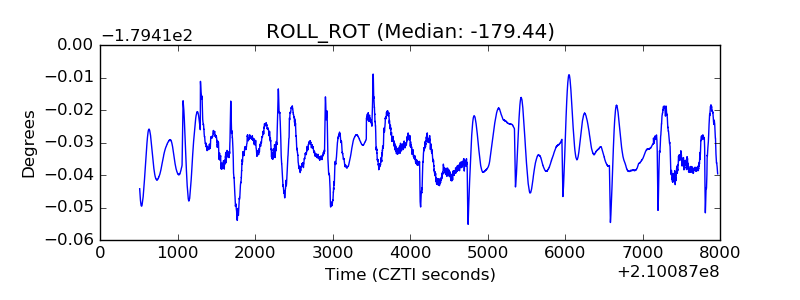 |
| _Roll_DEC | 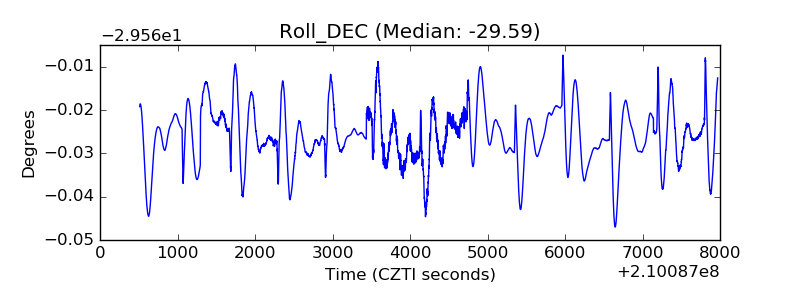 |
| _Roll_RA | 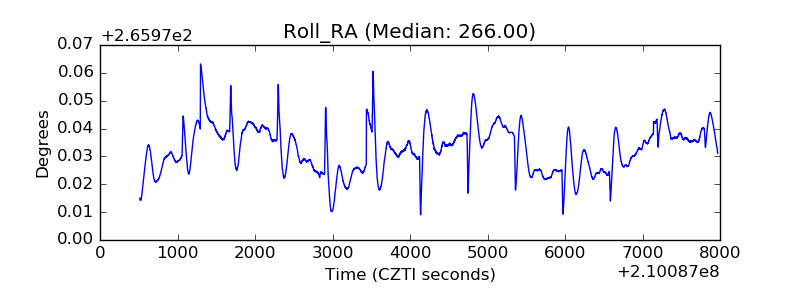 |
| Veto Counter | 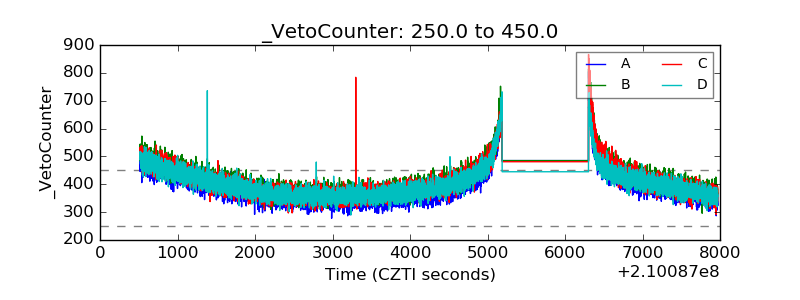 |