| Param | Original file | Final file |
|---|---|---|
| Filename | modeM0/AS1G05_158T01_9000000630_04969cztM0_level2.evt | modeM0/AS1G05_158T01_9000000630_04969cztM0_level2_quad_clean.evt |
| Size (bytes) | 552,000,960 | 94,849,920 |
| Size | 526.4 MB | 90.5 MB |
| Events in quadrant A | 3,577,243 | 594,566 |
| Events in quadrant B | 4,038,654 | 593,755 |
| Events in quadrant C | 3,423,041 | 597,187 |
| Events in quadrant D | 5,158,742 | 553,992 |
| Mode M9 | |||
|---|---|---|---|
| Quadrant | BADHDUFLAG | Total packets | Discarded packets |
| A | 0 | 2 | 0 |
| B | 0 | 2 | 0 |
| C | 0 | 2 | 0 |
| D | 0 | 3 | 0 |
| Mode M0 | |||
|---|---|---|---|
| Quadrant | BADHDUFLAG | Total packets | Discarded packets |
| A | 0 | 16020 | 3 |
| B | 0 | 17098 | 2 |
| C | 0 | 15761 | 2 |
| D | 0 | 20733 | 2 |
| Mode SS | |||
|---|---|---|---|
| Quadrant | BADHDUFLAG | Total packets | Discarded packets |
| A | 0 | 154 | 0 |
| B | 0 | 154 | 0 |
| C | 0 | 154 | 0 |
| D | 0 | 154 | 0 |
| Quadrant | Total seconds | Saturated seconds | Saturation percentage |
|---|---|---|---|
| A | 7664 | 38 | 0.495825% |
| B | 7664 | 58 | 0.756785% |
| C | 7664 | 21 | 0.274008% |
| D | 7664 | 342 | 4.462422% |
Noise dominated data is calculated using 1-second bins in cleaned event files. If a bin has >2000 counts, and if more than 50% of those come from <1% of pixels, then it is considered to be noise-dominated and hence unusable.
| Quadrant | # 1 sec bins | Bins with >0 counts | Bins with >2000 counts | High rate bins dominated by noise | Noise dominated (total time) | Noise dominated (detector-on time) | Marked lightcurve |
|---|---|---|---|---|---|---|---|
| A | 7824 | 7665 | 7 | 7 | 0.09% | 0.09% |  |
| B | 7824 | 7665 | 3 | 3 | 0.04% | 0.04% | 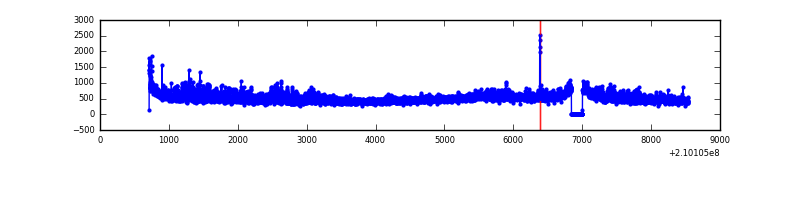 |
| C | 7824 | 7665 | 0 | 0 | 0.00% | 0.00% | 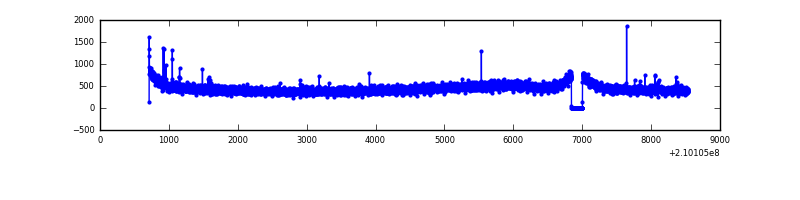 |
| D | 7824 | 7665 | 259 | 259 | 3.31% | 3.38% |  |
Top three noisy pixels from each quadrant. If the there are fewer than three noisy pixels in the level2.evt file, extra rows are filled as -1
| Pixel properties | Quadrant properties | ||||||
|---|---|---|---|---|---|---|---|
| Quadrant | DetID | PixID | Counts | Sigma | Mean | Median | Sigma |
| A | 0 | 50 | 76744 | 408.61 | 898 | 876 | 185.7 |
| A | 13 | 251 | 42681 | 225.15 | 898 | 876 | 185.7 |
| A | 0 | 226 | 9270 | 45.21 | 898 | 876 | 185.7 |
| B | 15 | 204 | 417267 | 2391.95 | 905 | 884 | 174.1 |
| B | 0 | 219 | 33331 | 186.39 | 905 | 884 | 174.1 |
| B | 14 | 167 | 28378 | 157.94 | 905 | 884 | 174.1 |
| C | 1 | 16 | 22858 | 108.36 | 867 | 870 | 202.9 |
| C | 13 | 61 | 7192 | 31.16 | 867 | 870 | 202.9 |
| C | 1 | 3 | 6455 | 27.52 | 867 | 870 | 202.9 |
| D | 2 | 136 | 787523 | 3726.96 | 853 | 828 | 211.1 |
| D | 2 | 33 | 399909 | 1890.64 | 853 | 828 | 211.1 |
| D | 13 | 235 | 212101 | 1000.9 | 853 | 828 | 211.1 |
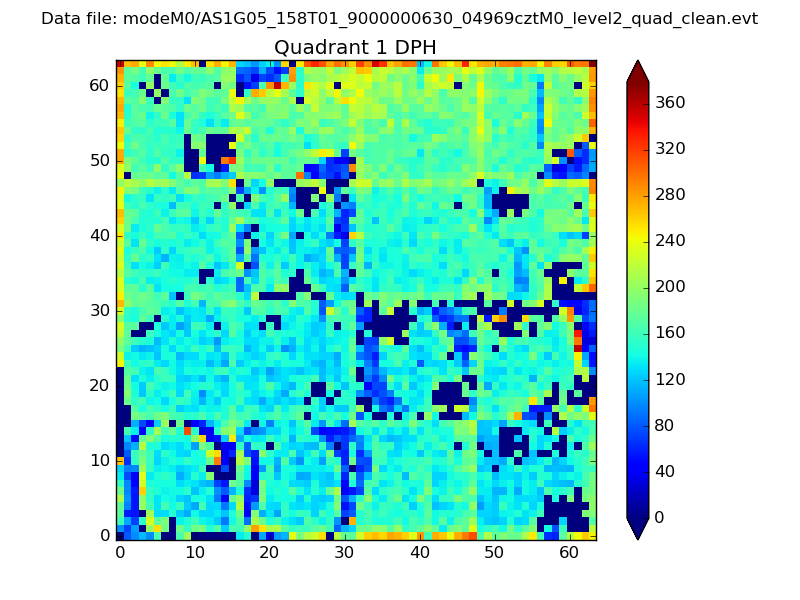
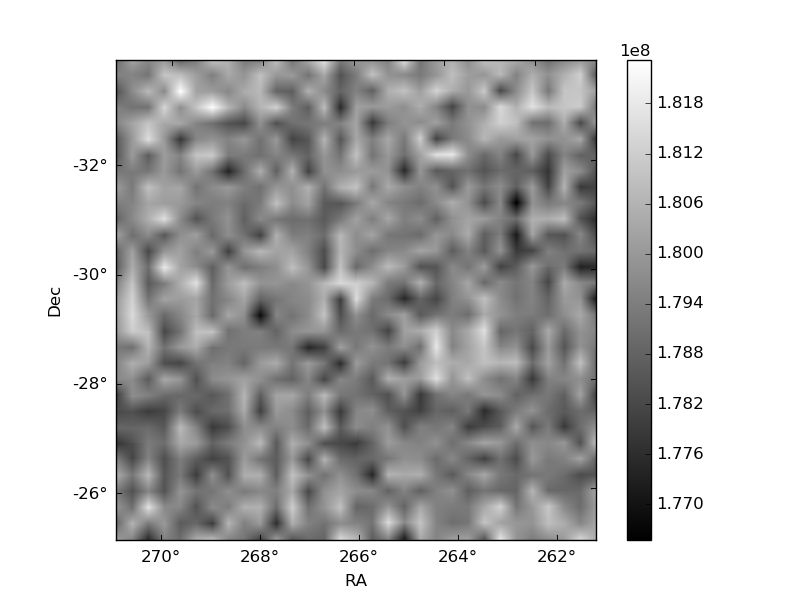
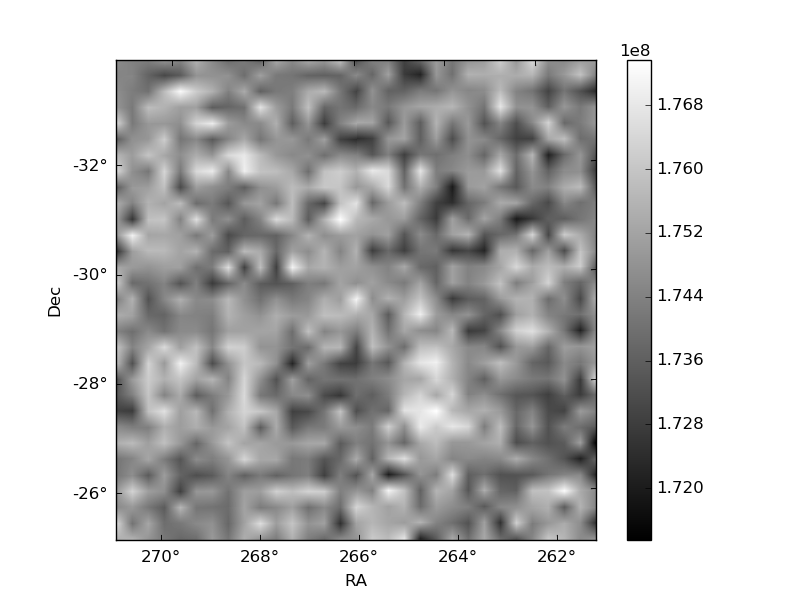
Histogram calculated using DETX and DETY for each event in the final _common_clean file
| Quadrant A | 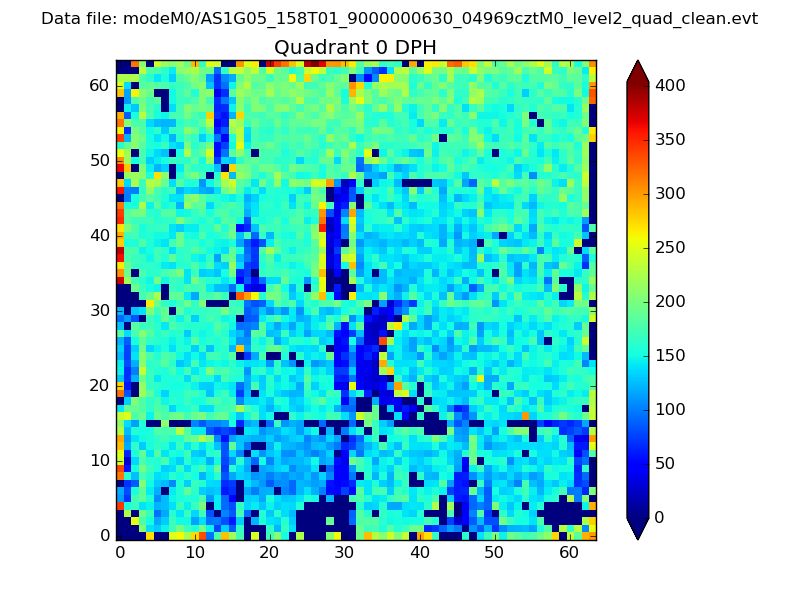 |
 |
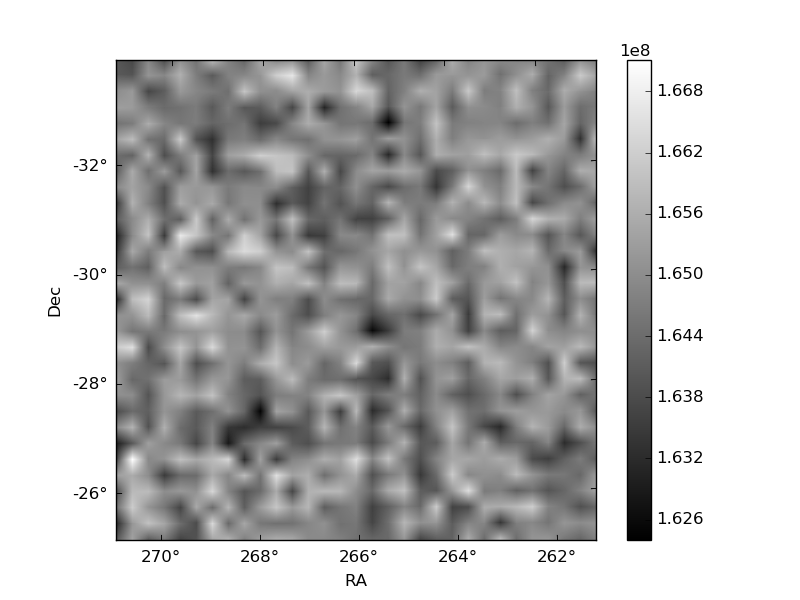
Quadrant B |
|---|---|---|---|
| Quadrant D |  |
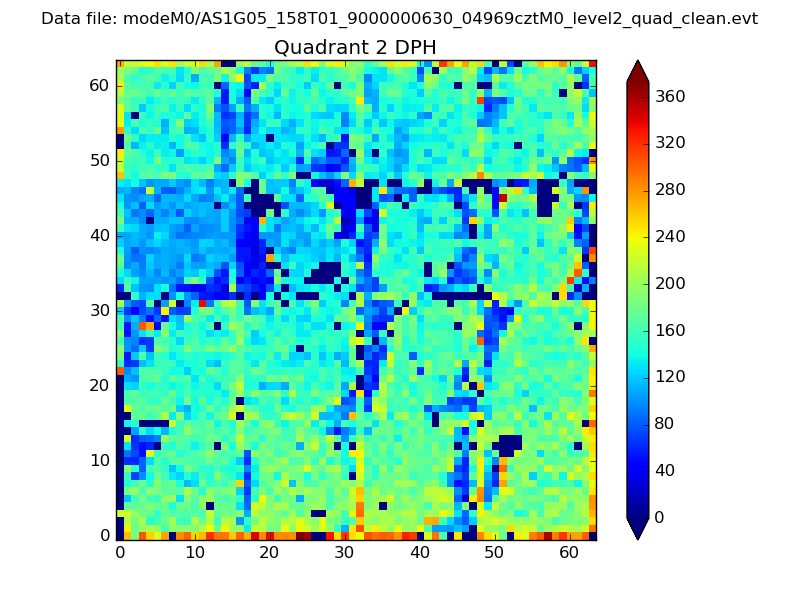 |
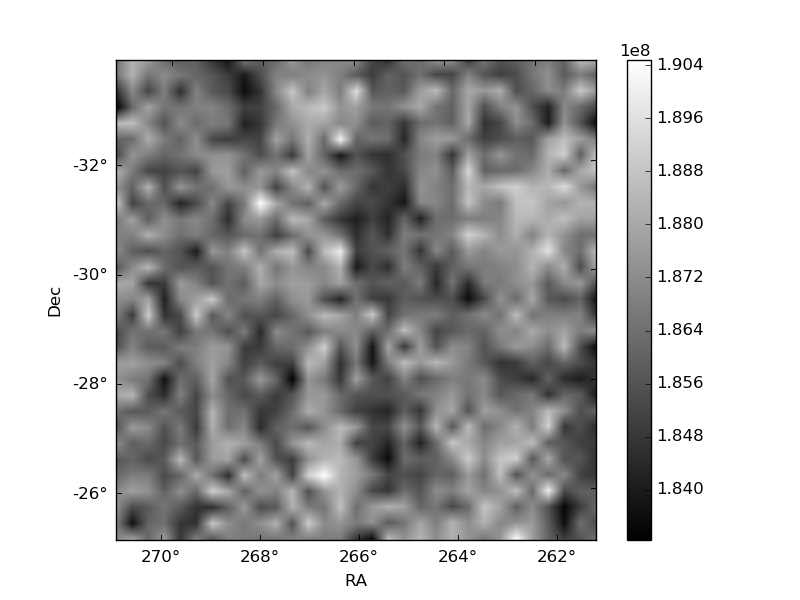
Quadrant C |
| Plot type | Count rate plots | Images |
|---|---|---|
| Comparison with Poisson distribution Blue bars denote a histogram of data divided into 1 sec bins. Red curve is a Poisson curve with rate = median count rate of data. |
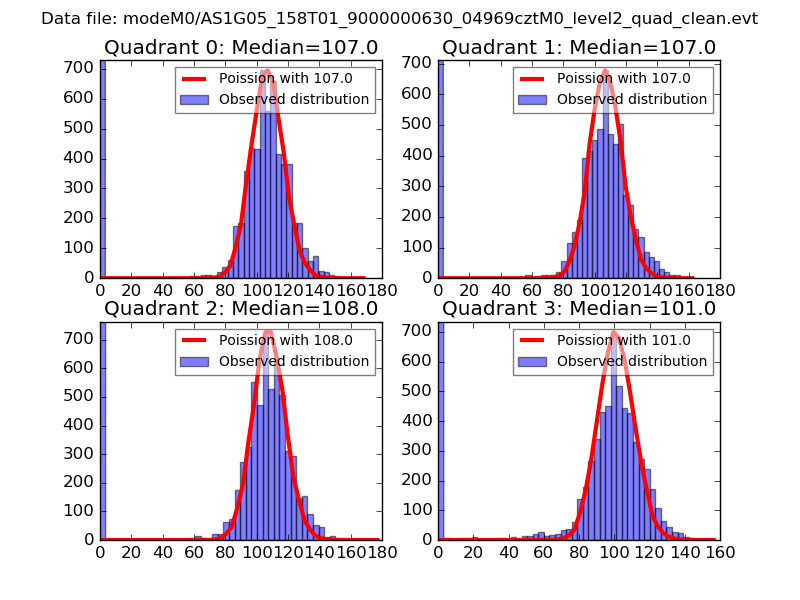 |
 |
| Quadrant-wise count rates Data is divided into 100 sec bins |
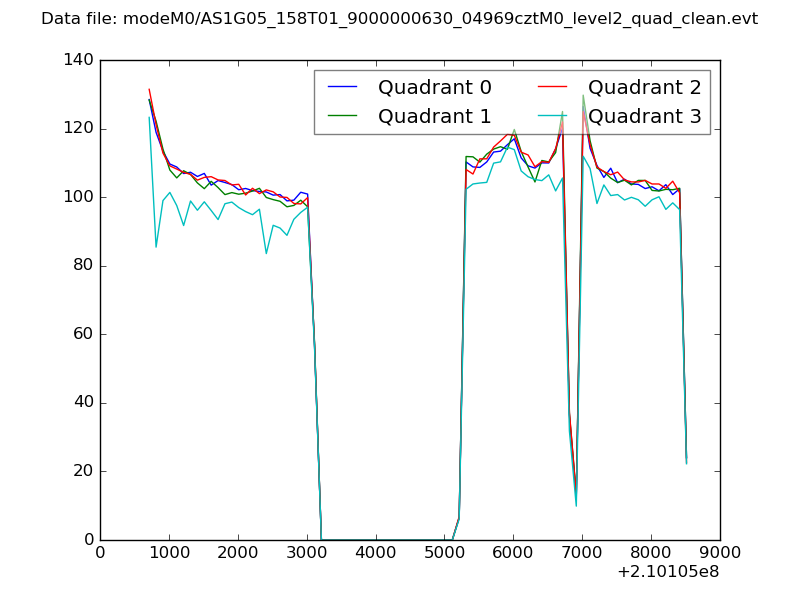 |
|
| Module-wise count rates for Quadrant A Data is divided into 100 sec bins |
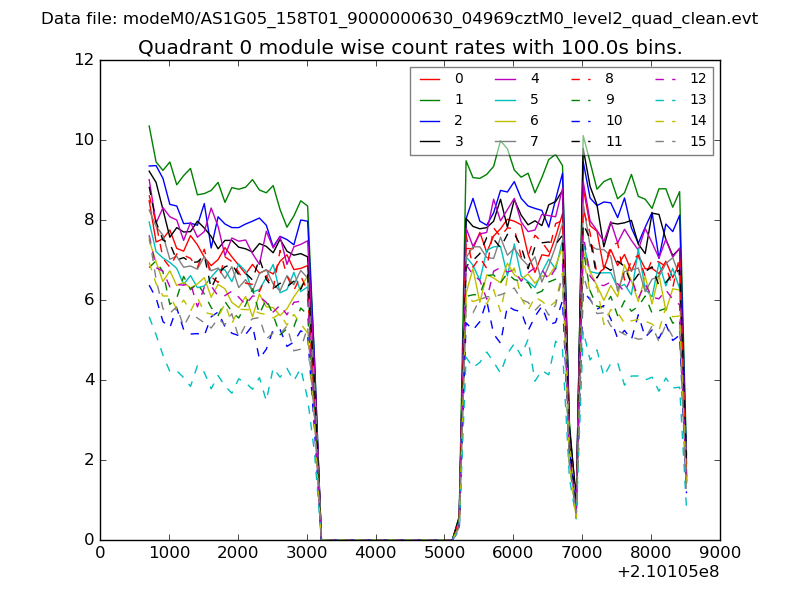 |
 |
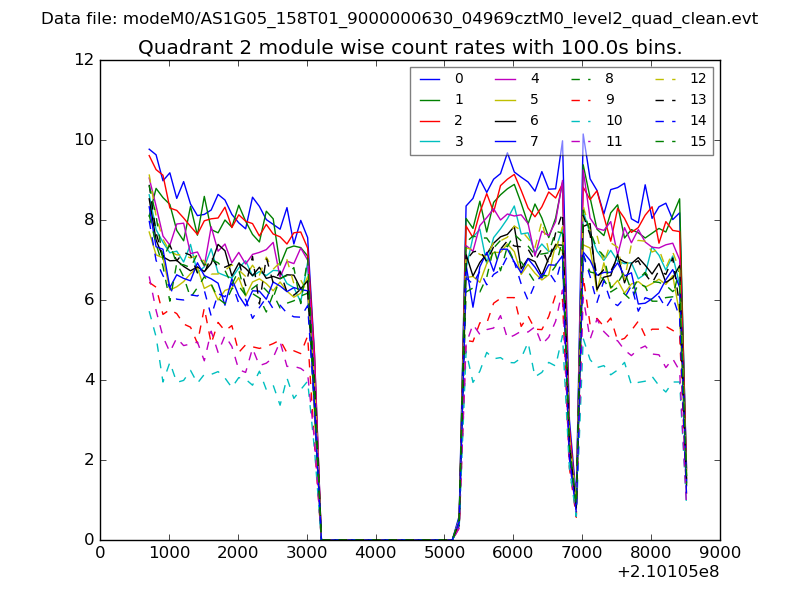
| Module-wise count rates for Quadrant B Data is divided into 100 sec bins |
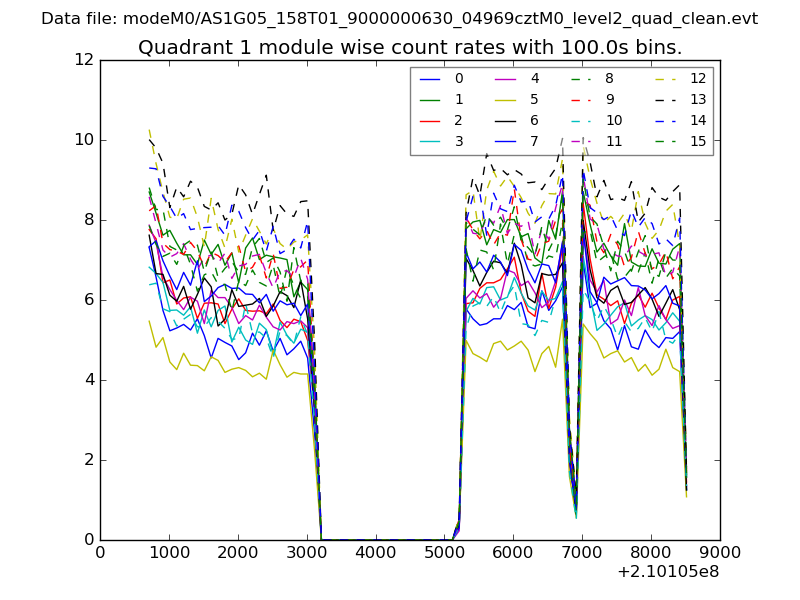 |
 |
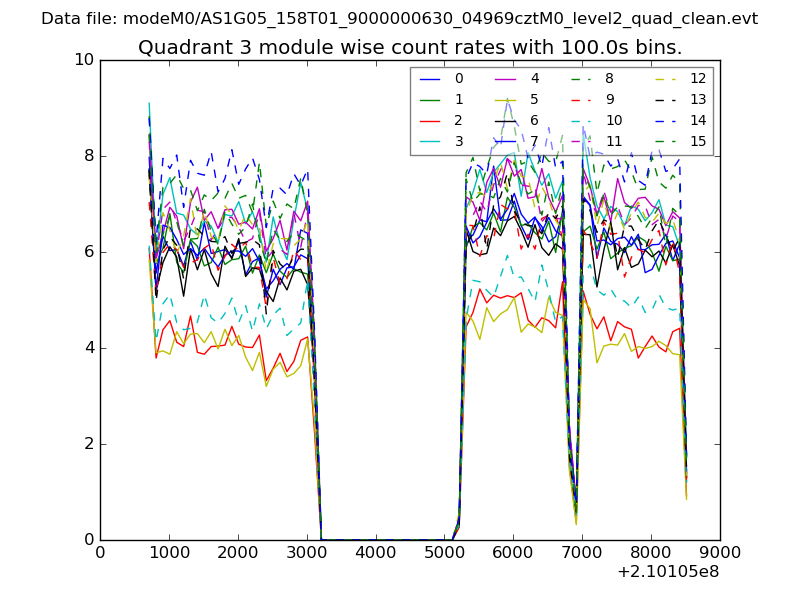
| Module-wise count rates for Quadrant C Data is divided into 100 sec bins |
 |
 |
| Module-wise count rates for Quadrant D Data is divided into 100 sec bins |
 |
 |
| Parameter | Plot |
|---|---|
| CZT HV Monitor | 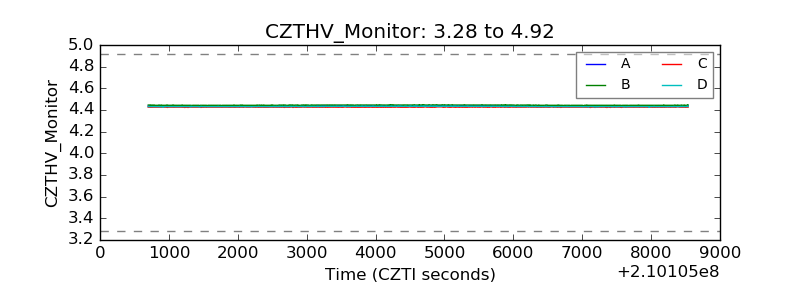 |
| D_VDD | 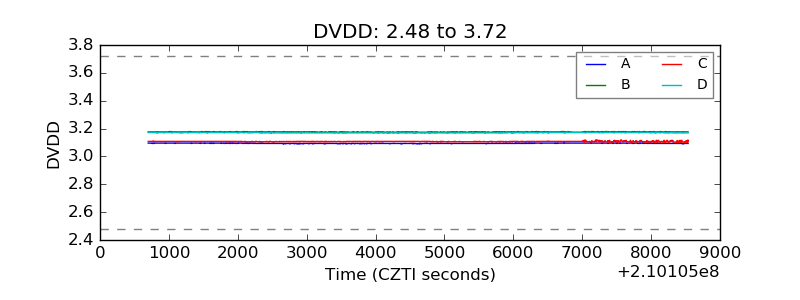 |
| Temperature 1 |  |
| Veto HV Monitor | 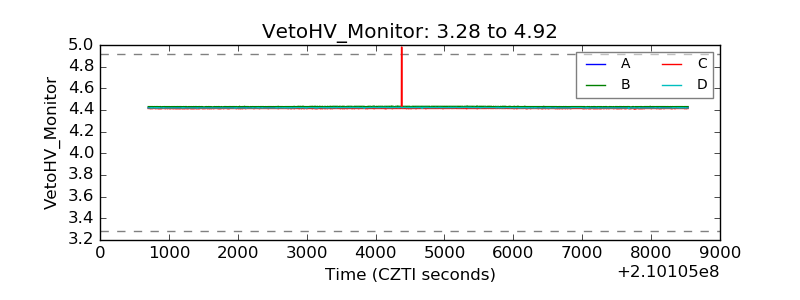 |
| Veto LLD | 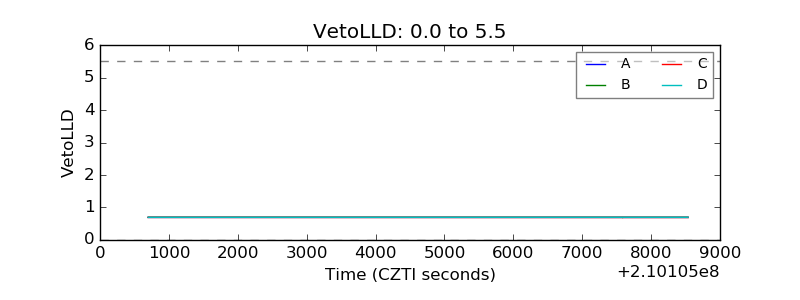 |
| Alpha Counter | 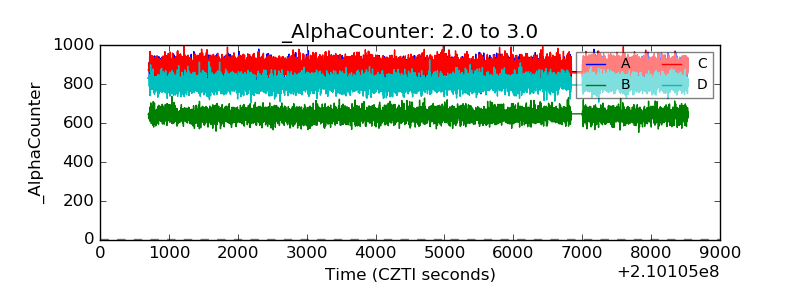 |
| _CPM_Rate | 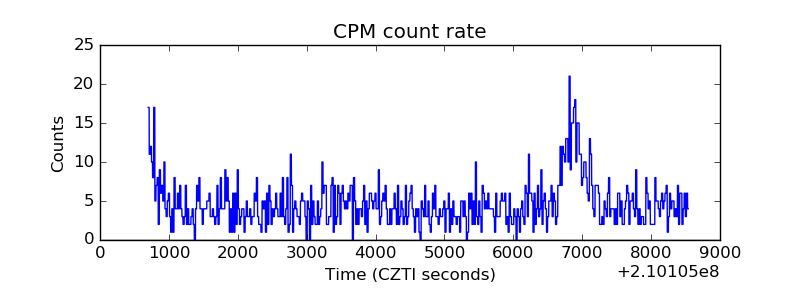 |
| CZT Counter | 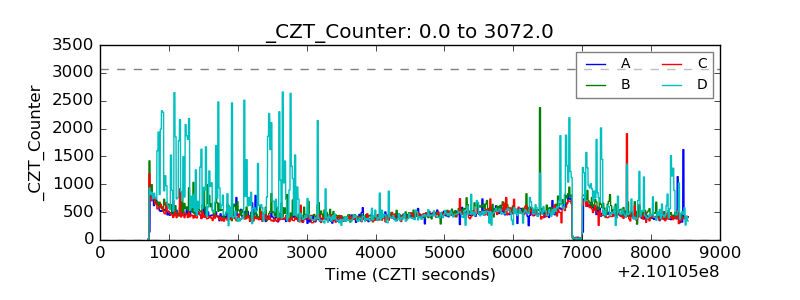 |
| +2.5 Volts monitor |  |
| +5 Volts monitor |  |
| _ROLL_ROT | 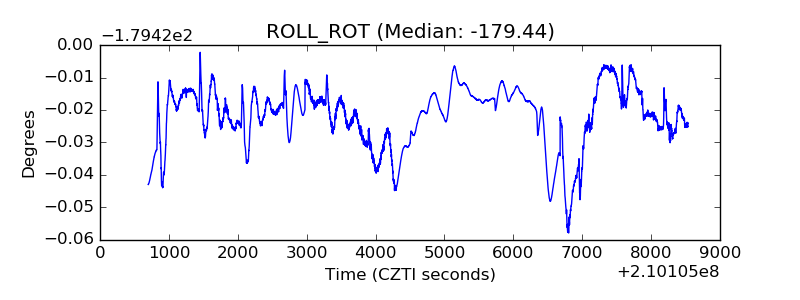 |
| _Roll_DEC | 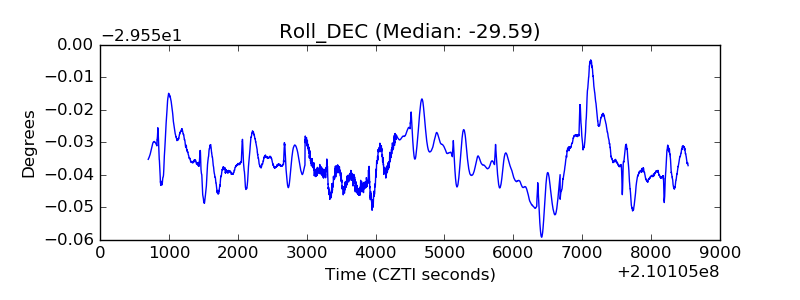 |
| _Roll_RA | 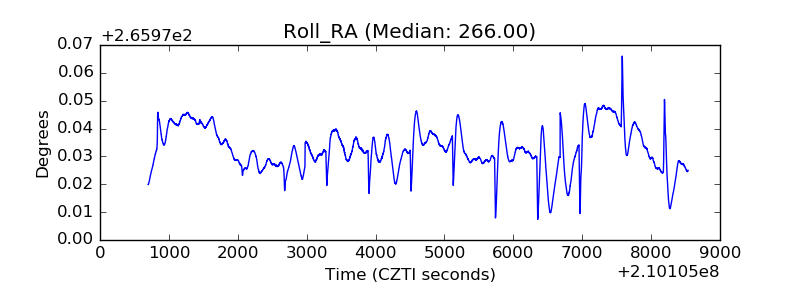 |
| Veto Counter | 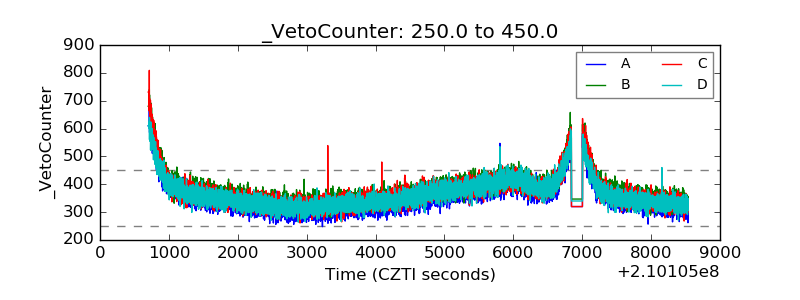 |