| Param | Original file | Final file |
|---|---|---|
| Filename | modeM0/AS1G05_158T01_9000000630_04970cztM0_level2.evt | modeM0/AS1G05_158T01_9000000630_04970cztM0_level2_quad_clean.evt |
| Size (bytes) | 541,368,000 | 95,515,200 |
| Size | 516.3 MB | 91.1 MB |
| Events in quadrant A | 3,576,713 | 598,292 |
| Events in quadrant B | 3,911,347 | 597,981 |
| Events in quadrant C | 3,429,153 | 598,417 |
| Events in quadrant D | 4,954,701 | 561,497 |
| Mode M9 | |||
|---|---|---|---|
| Quadrant | BADHDUFLAG | Total packets | Discarded packets |
| A | 0 | 5 | 0 |
| B | 0 | 5 | 0 |
| C | 0 | 5 | 0 |
| D | 0 | 5 | 0 |
| Mode M0 | |||
|---|---|---|---|
| Quadrant | BADHDUFLAG | Total packets | Discarded packets |
| A | 0 | 16132 | 3 |
| B | 0 | 16902 | 2 |
| C | 0 | 15794 | 2 |
| D | 0 | 20285 | 2 |
| Mode SS | |||
|---|---|---|---|
| Quadrant | BADHDUFLAG | Total packets | Discarded packets |
| A | 0 | 158 | 0 |
| B | 0 | 158 | 0 |
| C | 0 | 158 | 0 |
| D | 0 | 158 | 0 |
| Quadrant | Total seconds | Saturated seconds | Saturation percentage |
|---|---|---|---|
| A | 7713 | 36 | 0.466744% |
| B | 7713 | 97 | 1.257617% |
| C | 7713 | 9 | 0.116686% |
| D | 7713 | 300 | 3.889537% |
Noise dominated data is calculated using 1-second bins in cleaned event files. If a bin has >2000 counts, and if more than 50% of those come from <1% of pixels, then it is considered to be noise-dominated and hence unusable.
| Quadrant | # 1 sec bins | Bins with >0 counts | Bins with >2000 counts | High rate bins dominated by noise | Noise dominated (total time) | Noise dominated (detector-on time) | Marked lightcurve |
|---|---|---|---|---|---|---|---|
| A | 8213 | 7715 | 11 | 11 | 0.13% | 0.14% | 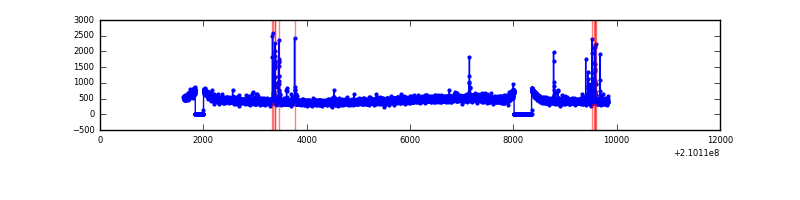 |
| B | 8213 | 7715 | 23 | 23 | 0.28% | 0.30% | 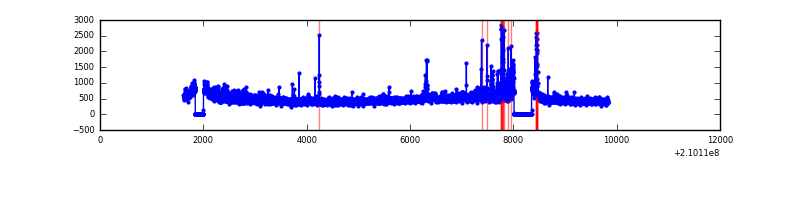 |
| C | 8213 | 7715 | 0 | 0 | 0.00% | 0.00% | 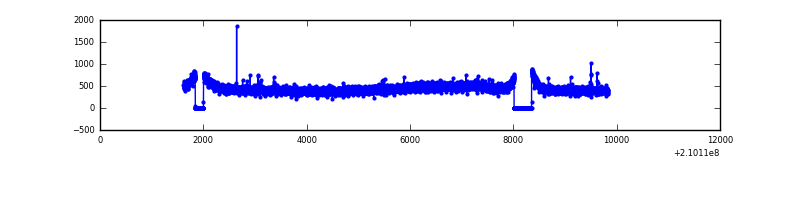 |
| D | 8213 | 7715 | 216 | 216 | 2.63% | 2.80% |  |
Top three noisy pixels from each quadrant. If the there are fewer than three noisy pixels in the level2.evt file, extra rows are filled as -1
| Pixel properties | Quadrant properties | ||||||
|---|---|---|---|---|---|---|---|
| Quadrant | DetID | PixID | Counts | Sigma | Mean | Median | Sigma |
| A | 0 | 50 | 67776 | 362.92 | 897 | 877 | 184.3 |
| A | 13 | 251 | 42930 | 228.13 | 897 | 877 | 184.3 |
| A | 15 | 234 | 10595 | 52.72 | 897 | 877 | 184.3 |
| B | 15 | 204 | 226234 | 1288.0 | 905 | 882 | 175.0 |
| B | 14 | 167 | 108832 | 616.99 | 905 | 882 | 175.0 |
| B | 15 | 54 | 19861 | 108.47 | 905 | 882 | 175.0 |
| C | 8 | 128 | 16981 | 79.54 | 866 | 871 | 202.5 |
| C | 8 | 112 | 8319 | 36.77 | 866 | 871 | 202.5 |
| C | 1 | 16 | 7730 | 33.87 | 866 | 871 | 202.5 |
| D | 2 | 136 | 458232 | 2151.02 | 856 | 829 | 212.6 |
| D | 2 | 33 | 373318 | 1751.7 | 856 | 829 | 212.6 |
| D | 13 | 239 | 244259 | 1144.78 | 856 | 829 | 212.6 |
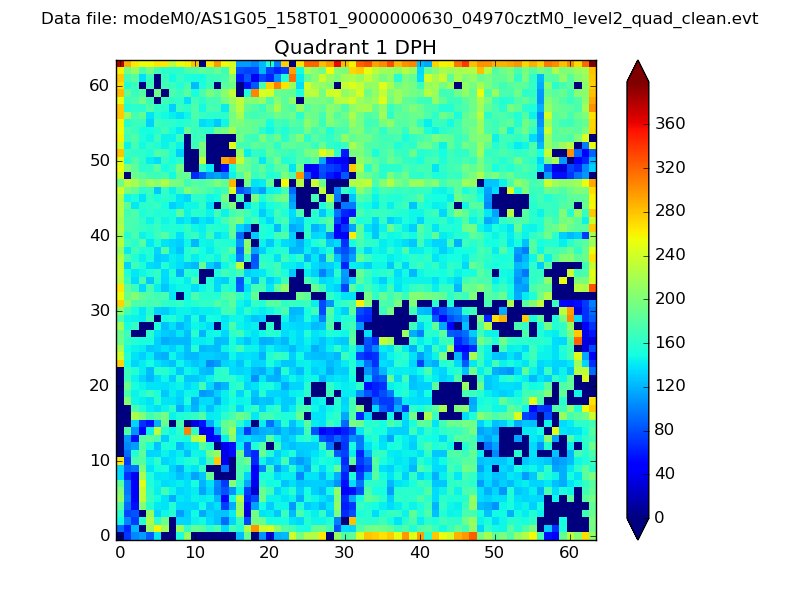
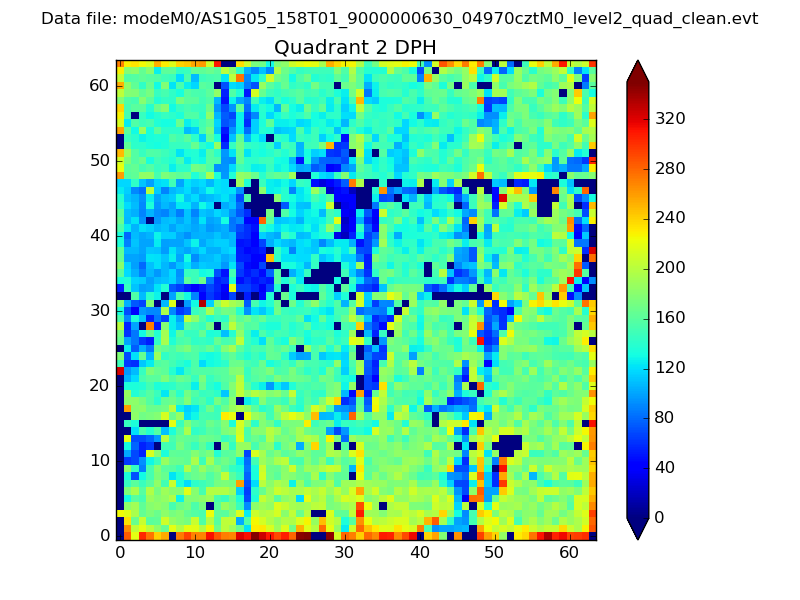
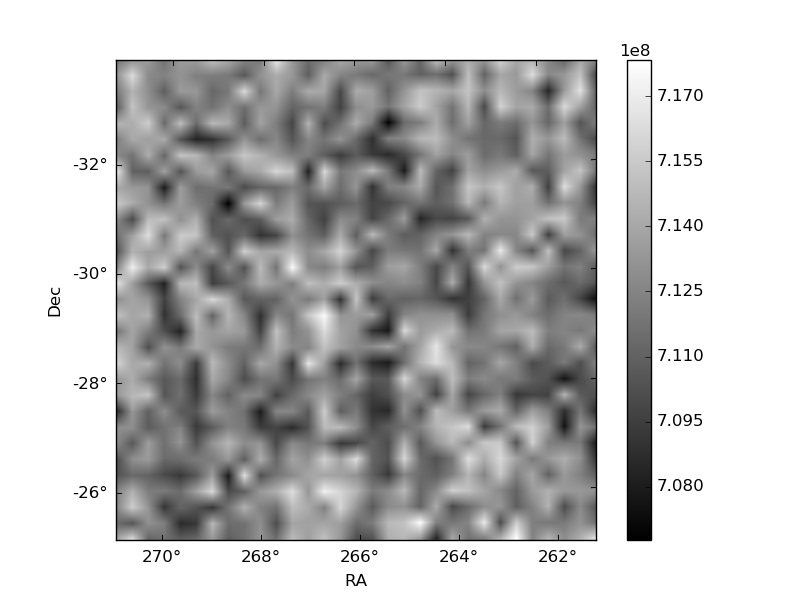
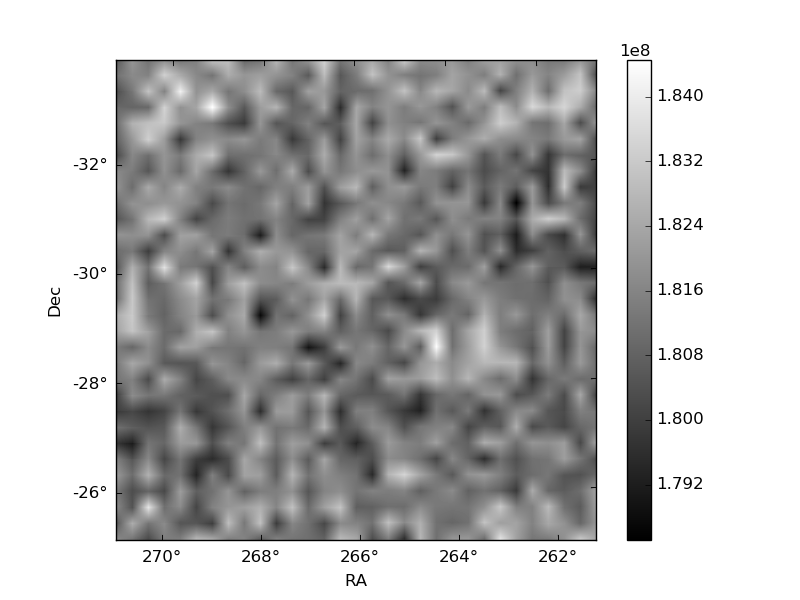
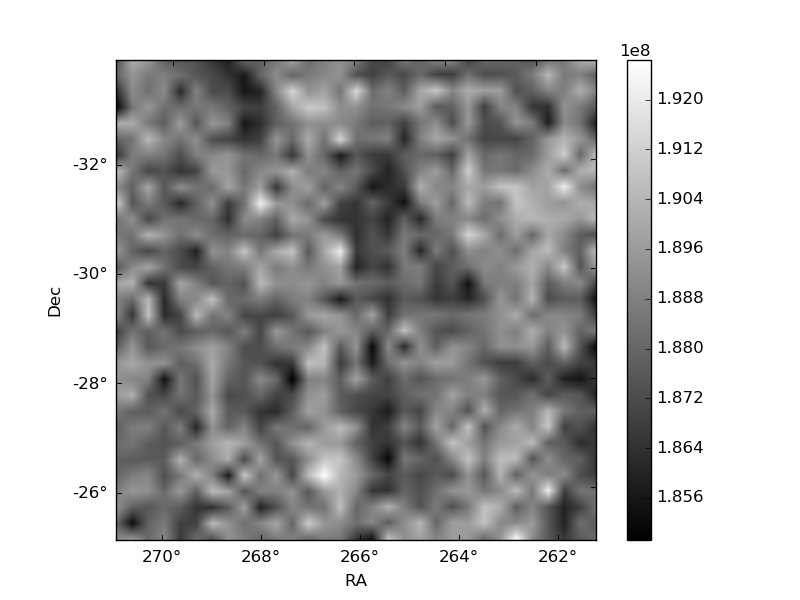
Histogram calculated using DETX and DETY for each event in the final _common_clean file
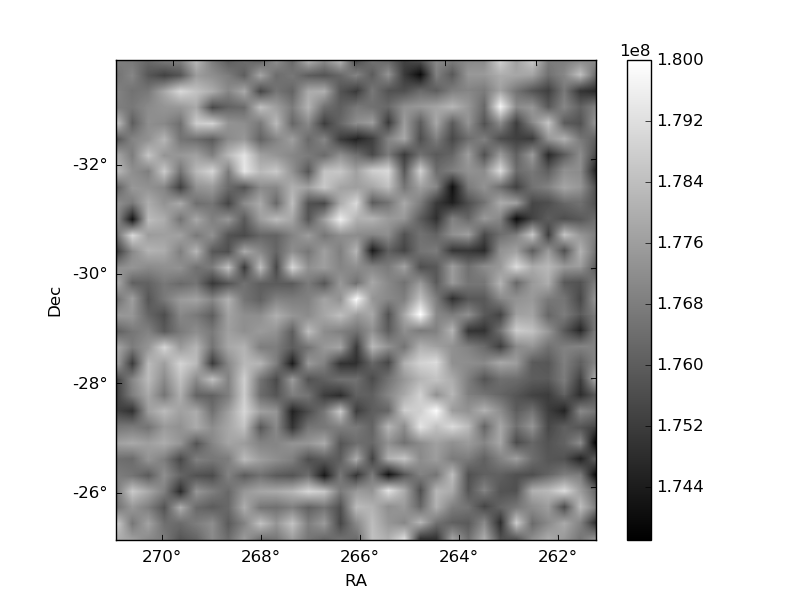
| Quadrant A | 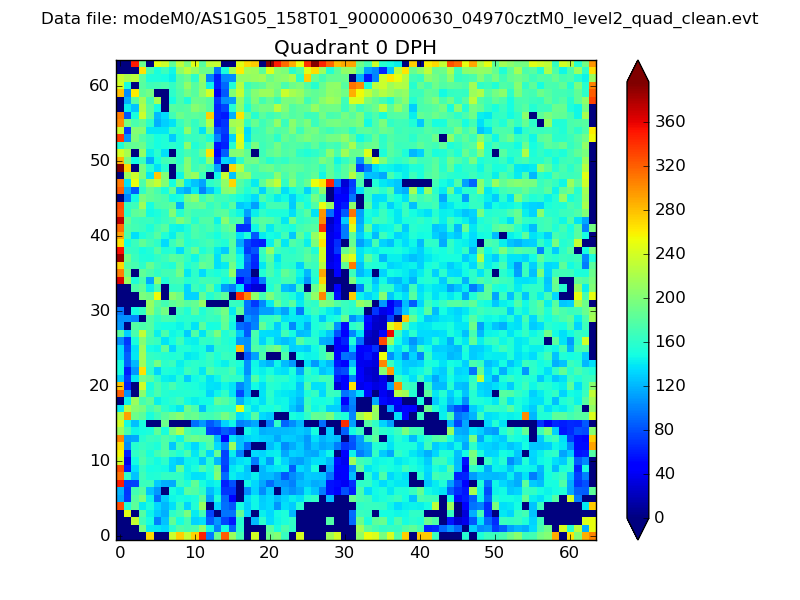 |
 |
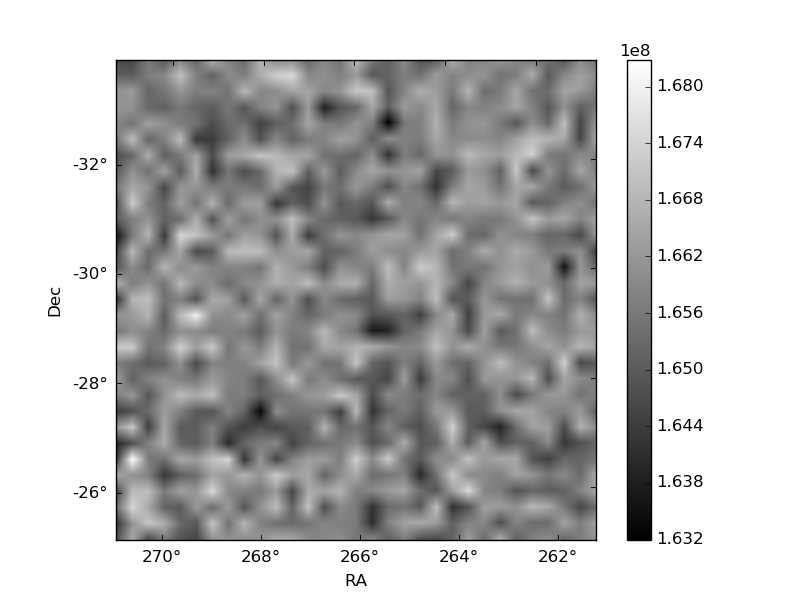
Quadrant B |
|---|---|---|---|
| Quadrant D | 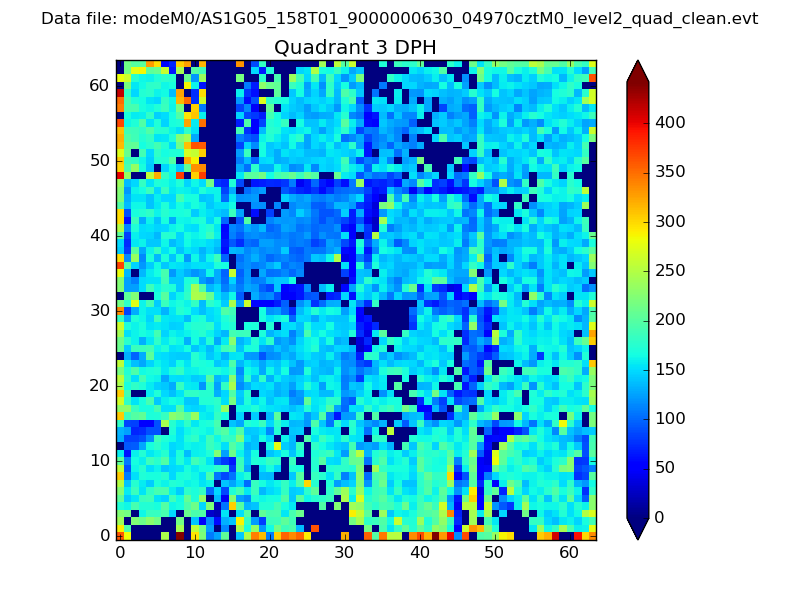 |
 |
Quadrant C |
| Plot type | Count rate plots | Images |
|---|---|---|
| Comparison with Poisson distribution Blue bars denote a histogram of data divided into 1 sec bins. Red curve is a Poisson curve with rate = median count rate of data. |
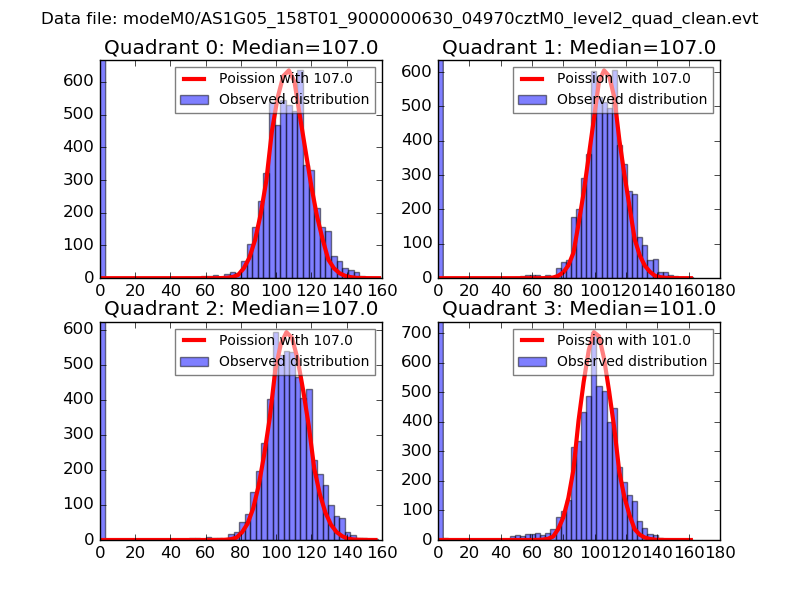 |
 |
| Quadrant-wise count rates Data is divided into 100 sec bins |
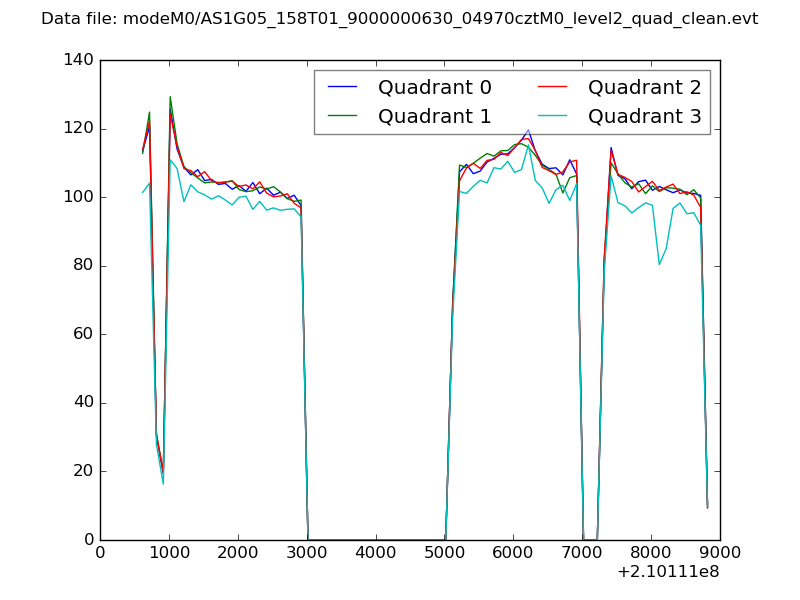 |
|
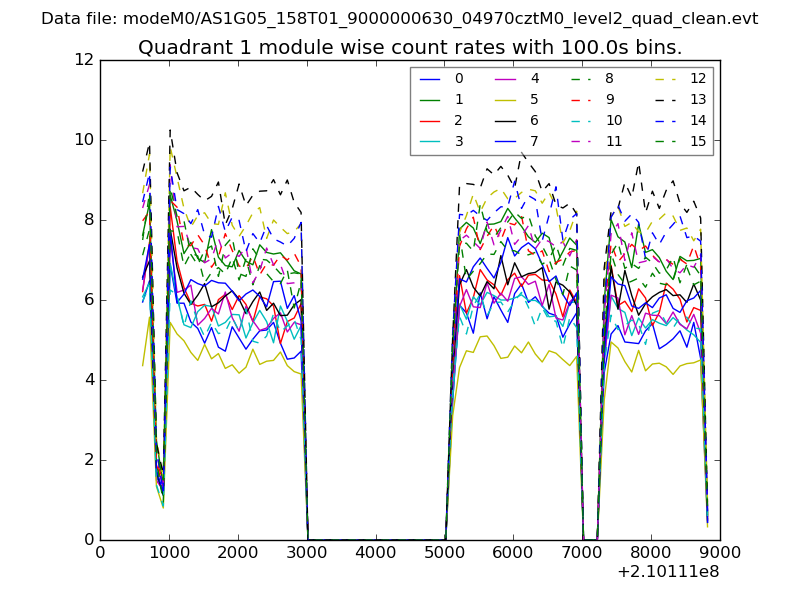
| Module-wise count rates for Quadrant A Data is divided into 100 sec bins |
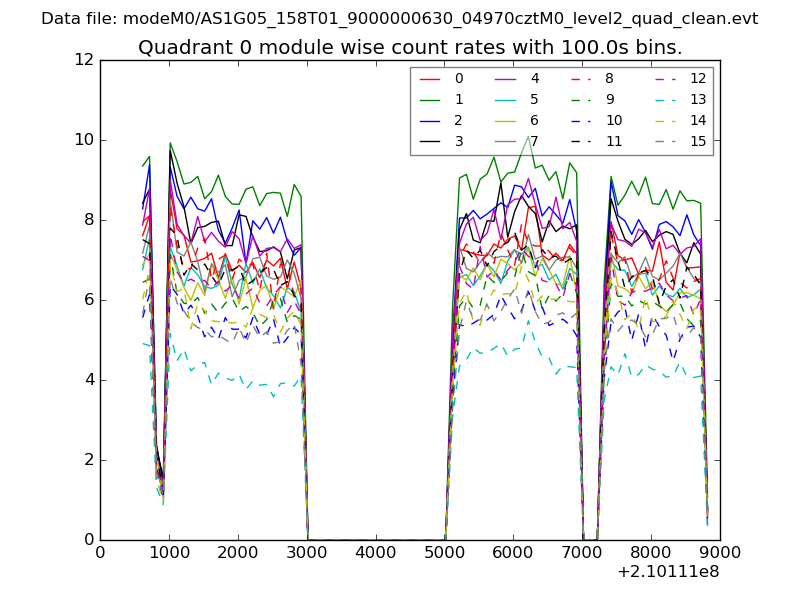 |
 |
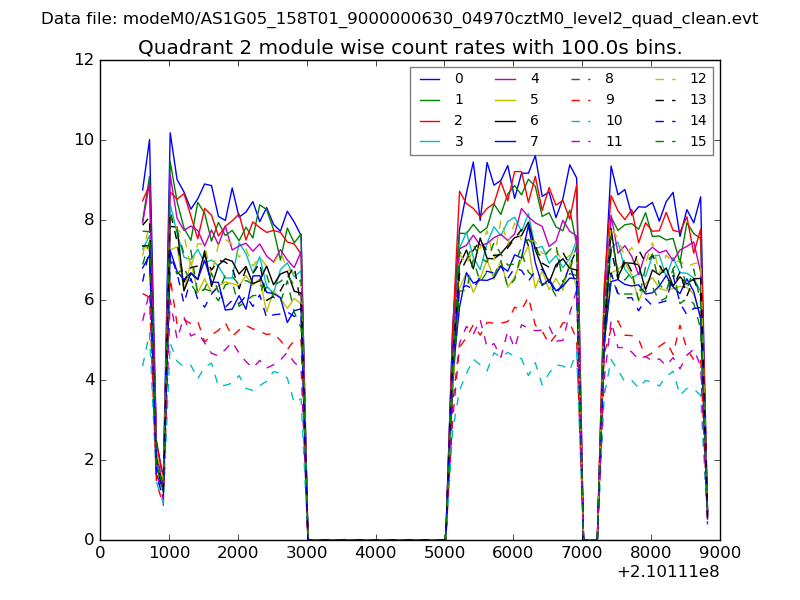
| Module-wise count rates for Quadrant B Data is divided into 100 sec bins |
 |
 |
| Module-wise count rates for Quadrant C Data is divided into 100 sec bins |
 |
 |
| Module-wise count rates for Quadrant D Data is divided into 100 sec bins |
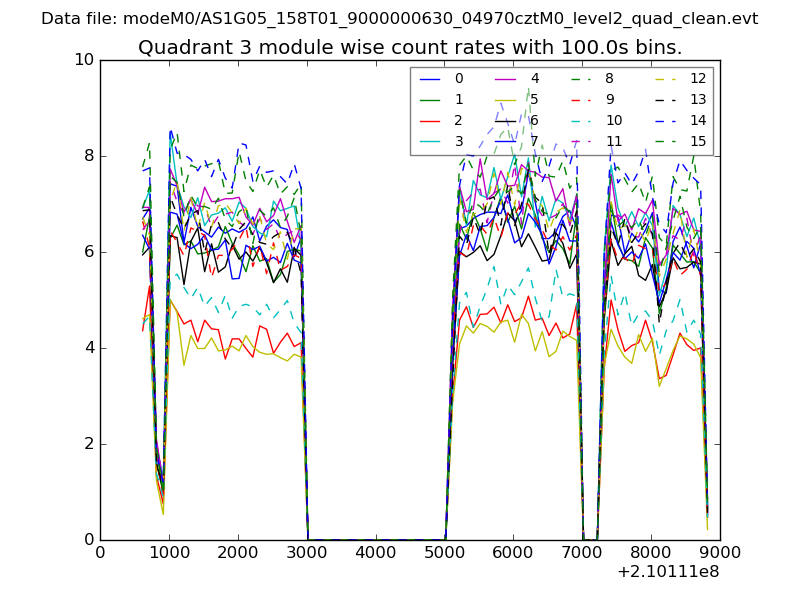 |
 |
| Parameter | Plot |
|---|---|
| CZT HV Monitor | 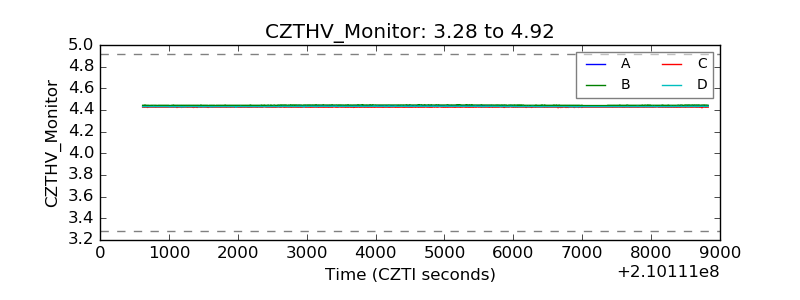 |
| D_VDD | 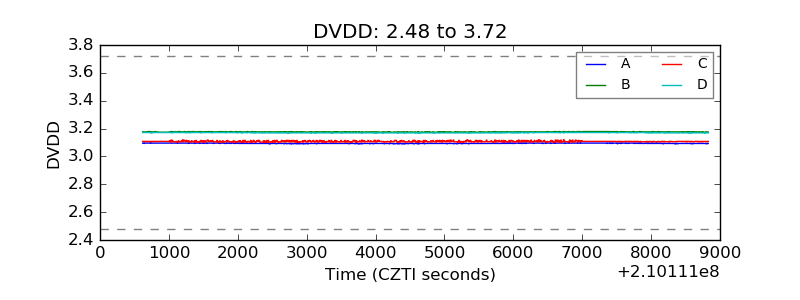 |
| Temperature 1 | 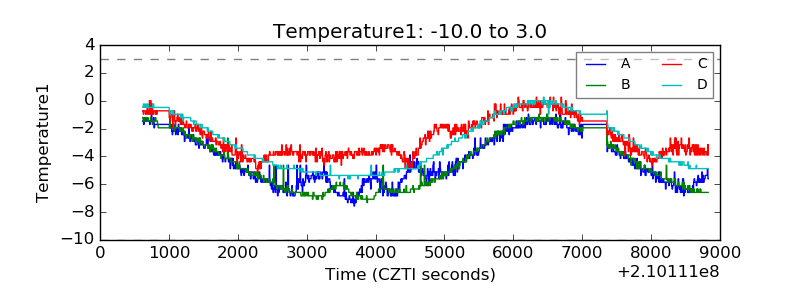 |
| Veto HV Monitor | 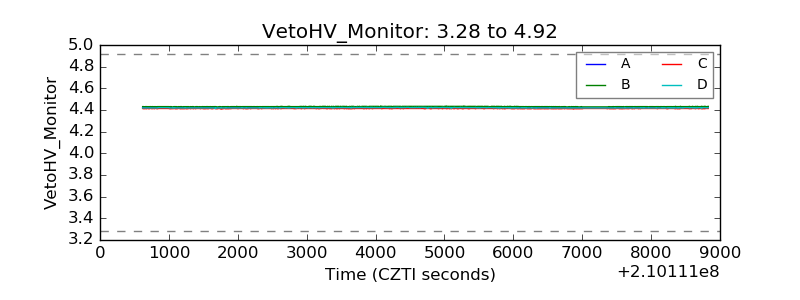 |
| Veto LLD | 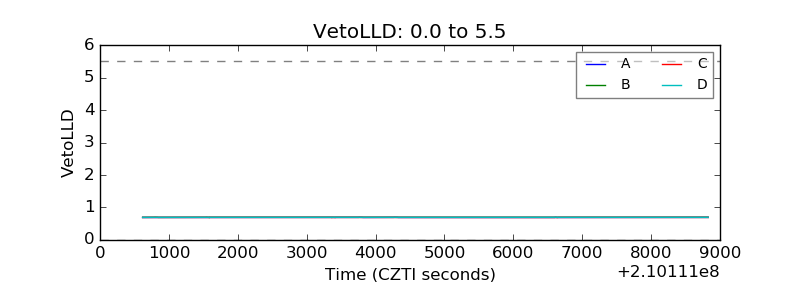 |
| Alpha Counter | 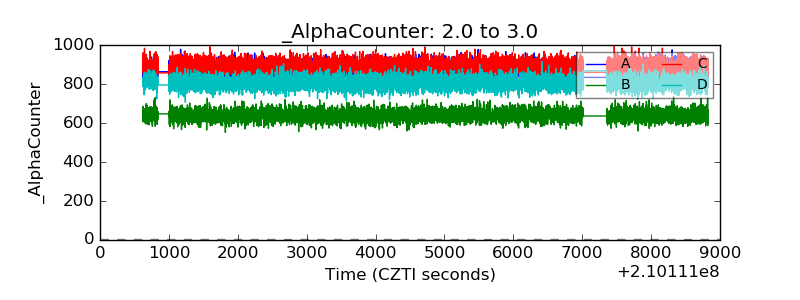 |
| _CPM_Rate | 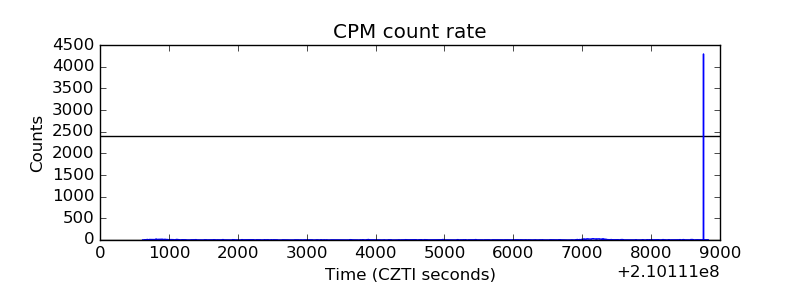 |
| CZT Counter | 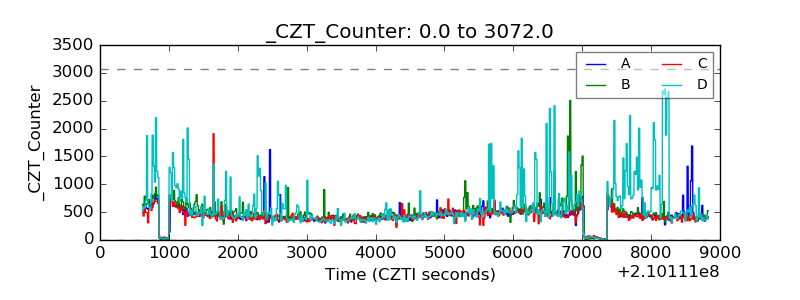 |
| +2.5 Volts monitor |  |
| +5 Volts monitor |  |
| _ROLL_ROT | 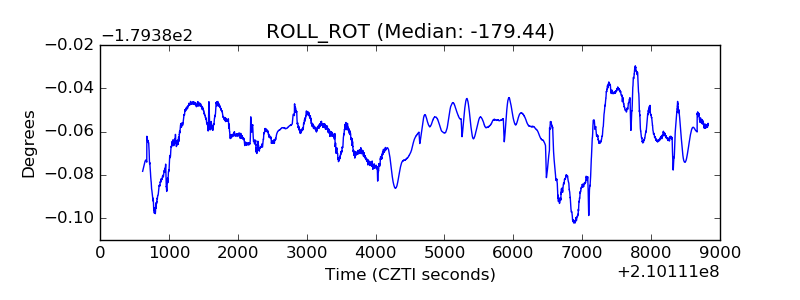 |
| _Roll_DEC | 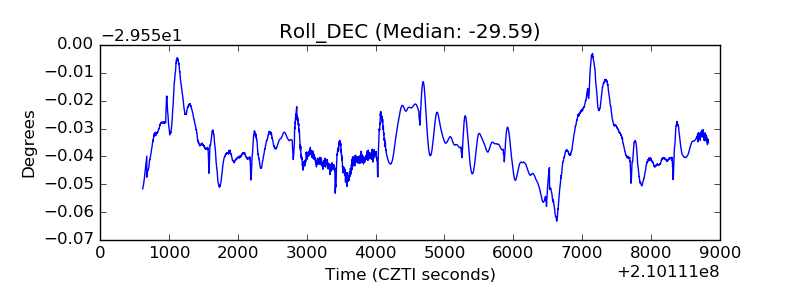 |
| _Roll_RA | 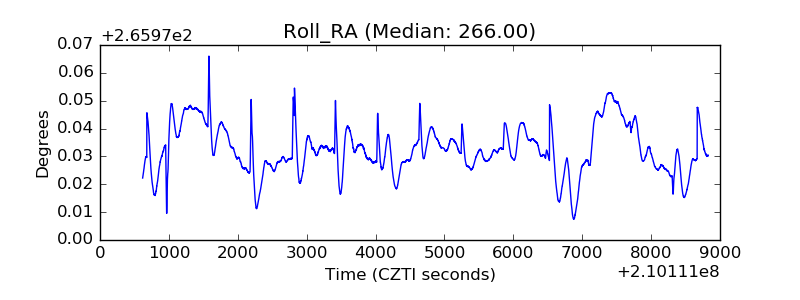 |
| Veto Counter | 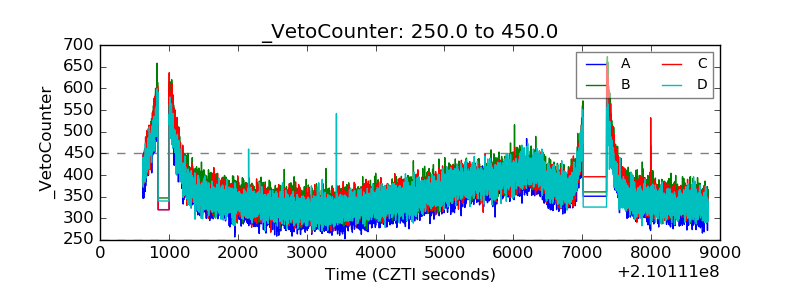 |