| Param | Original file | Final file |
|---|---|---|
| Filename | modeM0/AS1G05_158T01_9000000630_04972cztM0_level2.evt | modeM0/AS1G05_158T01_9000000630_04972cztM0_level2_quad_clean.evt |
| Size (bytes) | 330,552,000 | 49,291,200 |
| Size | 315.2 MB | 47.0 MB |
| Events in quadrant A | 2,225,333 | 291,471 |
| Events in quadrant B | 2,378,208 | 290,864 |
| Events in quadrant C | 2,096,617 | 292,590 |
| Events in quadrant D | 2,976,796 | 273,804 |
| Mode M9 | |||
|---|---|---|---|
| Quadrant | BADHDUFLAG | Total packets | Discarded packets |
| A | 0 | 3 | 0 |
| B | 0 | 3 | 0 |
| C | 0 | 3 | 0 |
| D | 0 | 3 | 0 |
| Mode M0 | |||
|---|---|---|---|
| Quadrant | BADHDUFLAG | Total packets | Discarded packets |
| A | 0 | 10180 | 2 |
| B | 0 | 10405 | 1 |
| C | 0 | 9928 | 1 |
| D | 0 | 12485 | 1 |
| Mode SS | |||
|---|---|---|---|
| Quadrant | BADHDUFLAG | Total packets | Discarded packets |
| A | 0 | 100 | 0 |
| B | 0 | 100 | 0 |
| C | 0 | 100 | 0 |
| D | 0 | 100 | 0 |
| Quadrant | Total seconds | Saturated seconds | Saturation percentage |
|---|---|---|---|
| A | 4894 | 22 | 0.449530% |
| B | 4894 | 62 | 1.266857% |
| C | 4894 | 4 | 0.081733% |
| D | 4894 | 161 | 3.289743% |
Noise dominated data is calculated using 1-second bins in cleaned event files. If a bin has >2000 counts, and if more than 50% of those come from <1% of pixels, then it is considered to be noise-dominated and hence unusable.
| Quadrant | # 1 sec bins | Bins with >0 counts | Bins with >2000 counts | High rate bins dominated by noise | Noise dominated (total time) | Noise dominated (detector-on time) | Marked lightcurve |
|---|---|---|---|---|---|---|---|
| A | 5234 | 4895 | 11 | 11 | 0.21% | 0.22% | 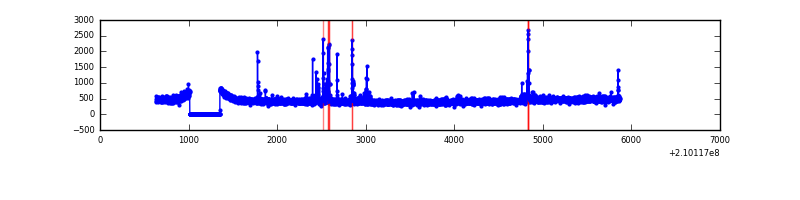 |
| B | 5234 | 4895 | 20 | 20 | 0.38% | 0.41% | 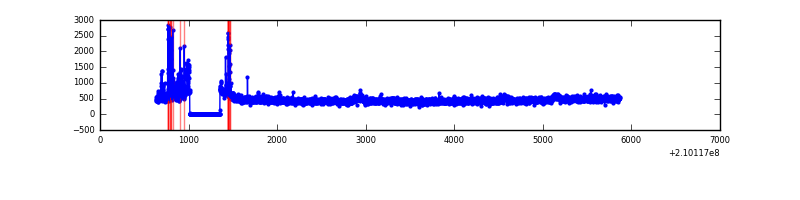 |
| C | 5234 | 4895 | 0 | 0 | 0.00% | 0.00% | 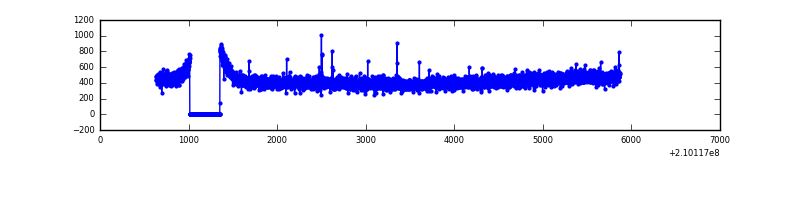 |
| D | 5234 | 4895 | 160 | 160 | 3.06% | 3.27% | 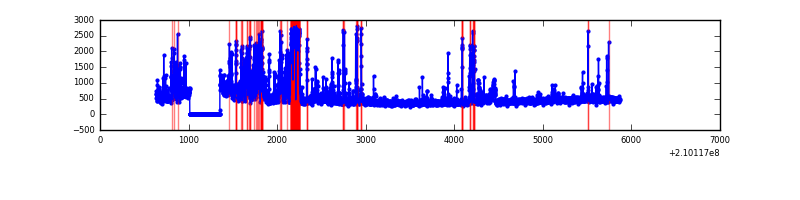 |
Top three noisy pixels from each quadrant. If the there are fewer than three noisy pixels in the level2.evt file, extra rows are filled as -1
| Pixel properties | Quadrant properties | ||||||
|---|---|---|---|---|---|---|---|
| Quadrant | DetID | PixID | Counts | Sigma | Mean | Median | Sigma |
| A | 0 | 50 | 100474 | 872.73 | 549 | 536 | 114.5 |
| A | 15 | 234 | 6855 | 55.18 | 549 | 536 | 114.5 |
| A | 12 | 194 | 5445 | 42.87 | 549 | 536 | 114.5 |
| B | 15 | 204 | 104194 | 955.85 | 555 | 543 | 108.4 |
| B | 14 | 167 | 75517 | 691.4 | 555 | 543 | 108.4 |
| B | 0 | 219 | 18439 | 165.03 | 555 | 543 | 108.4 |
| C | 9 | 54 | 7018 | 51.12 | 534 | 535 | 126.8 |
| C | 13 | 61 | 4347 | 30.06 | 534 | 535 | 126.8 |
| C | 1 | 16 | 2800 | 17.86 | 534 | 535 | 126.8 |
| D | 2 | 33 | 215143 | 1637.75 | 526 | 508 | 131.1 |
| D | 2 | 136 | 212854 | 1620.29 | 526 | 508 | 131.1 |
| D | 13 | 239 | 175857 | 1337.98 | 526 | 508 | 131.1 |
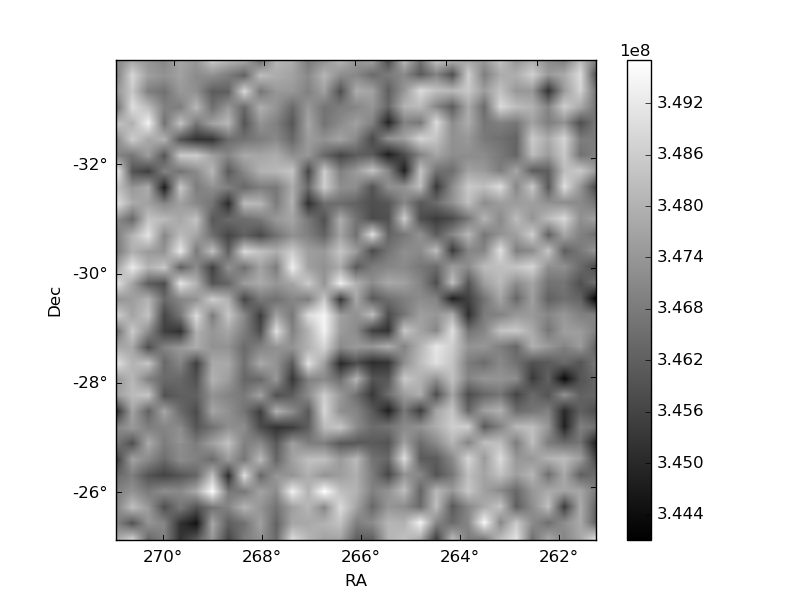
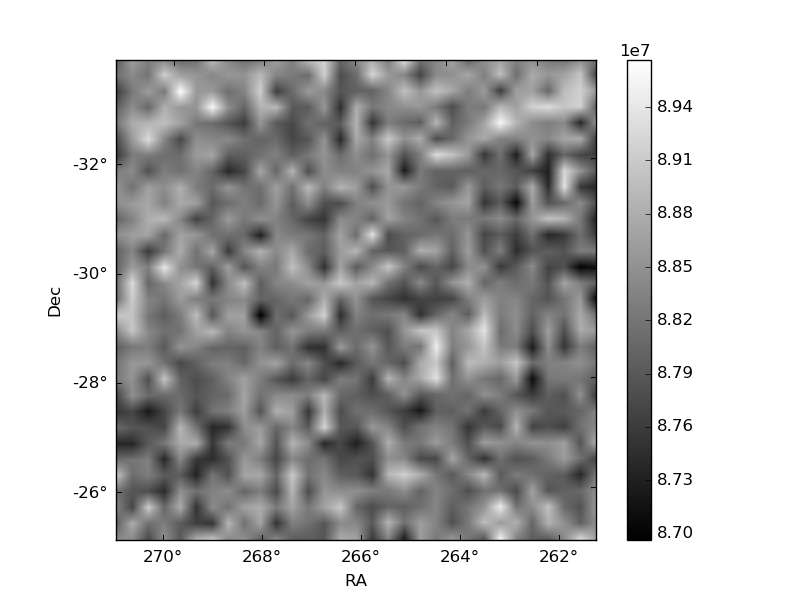
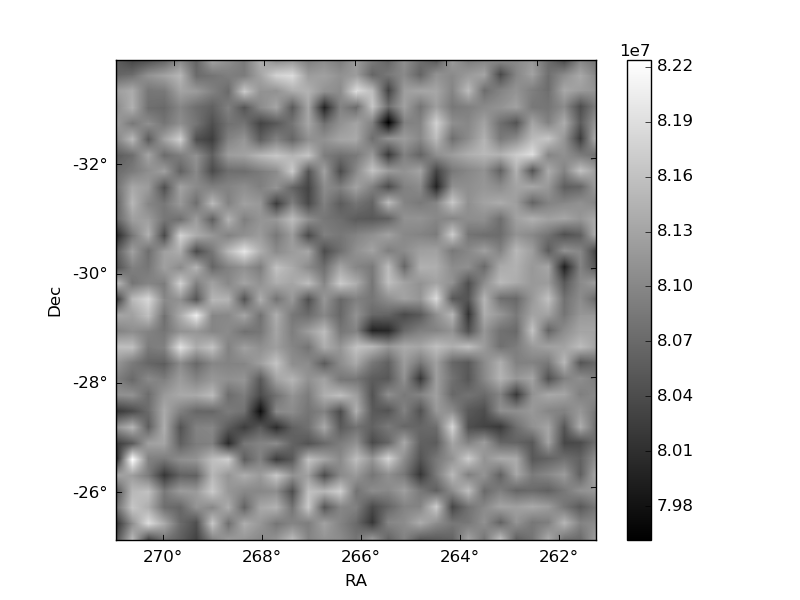
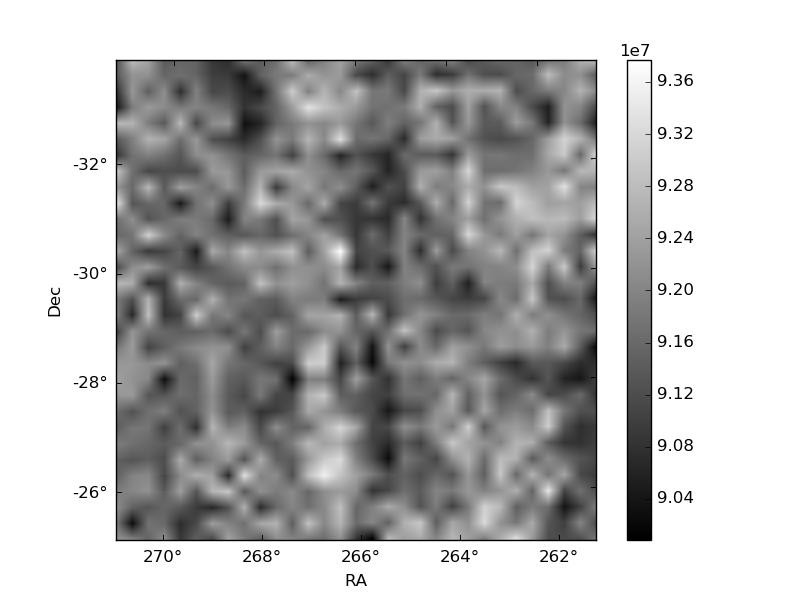
Histogram calculated using DETX and DETY for each event in the final _common_clean file
| Quadrant A | 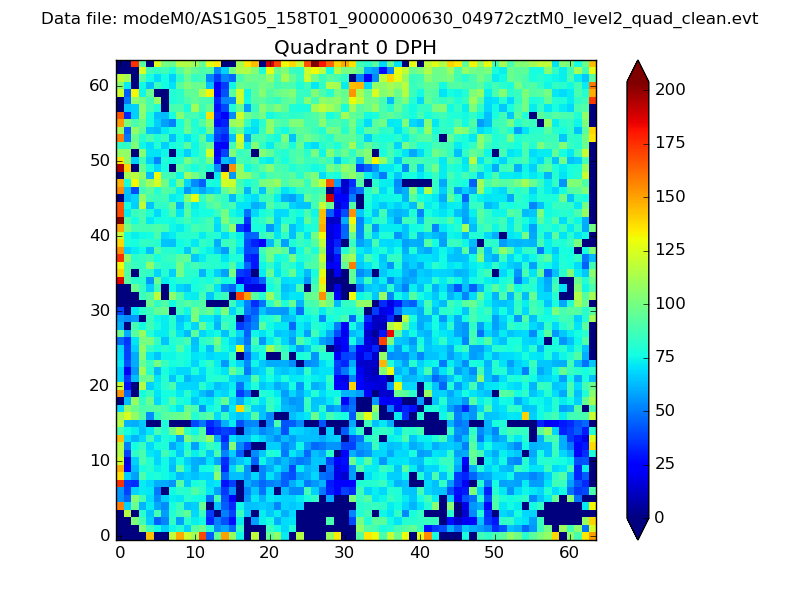 |
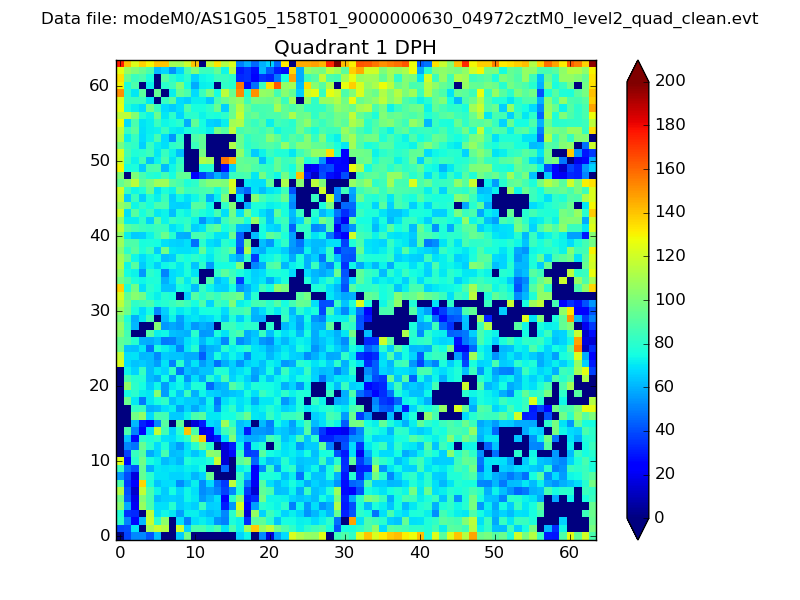 |
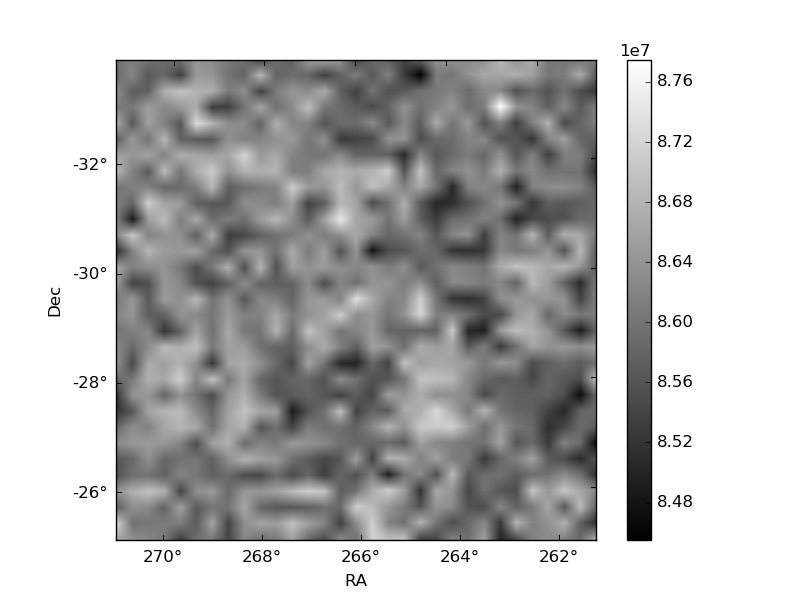
Quadrant B |
|---|---|---|---|
| Quadrant D | 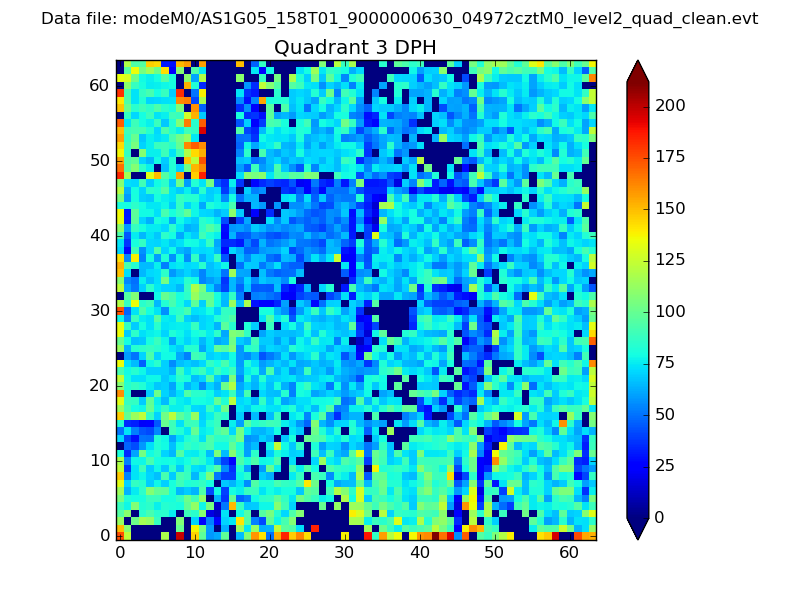 |
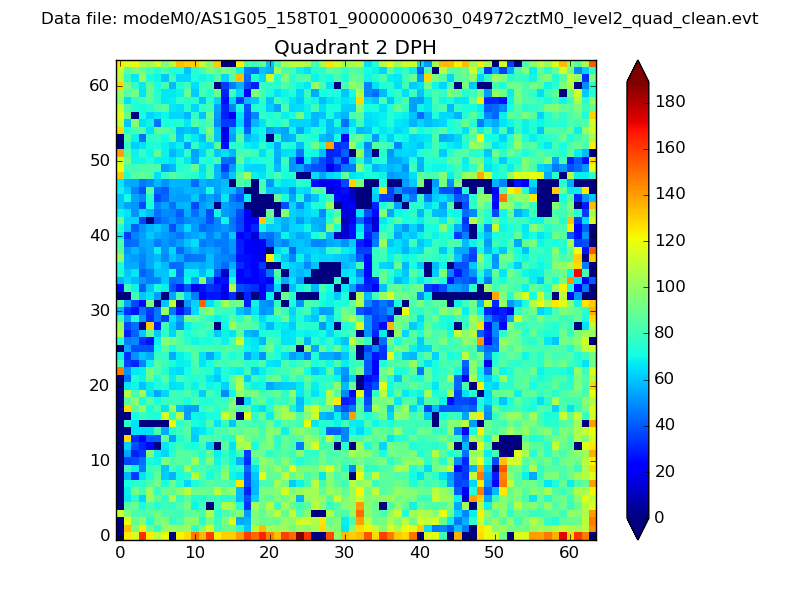 |
Quadrant C |
| Plot type | Count rate plots | Images |
|---|---|---|
| Comparison with Poisson distribution Blue bars denote a histogram of data divided into 1 sec bins. Red curve is a Poisson curve with rate = median count rate of data. |
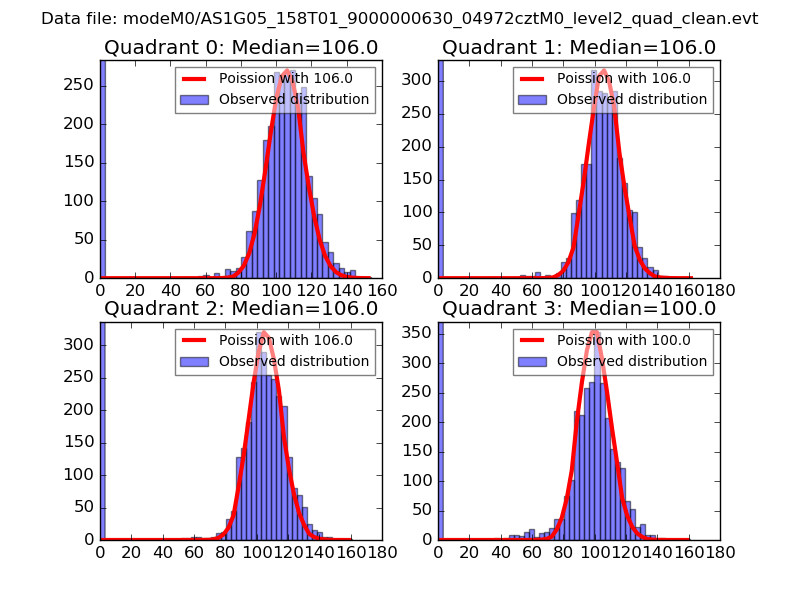 |
 |
| Quadrant-wise count rates Data is divided into 100 sec bins |
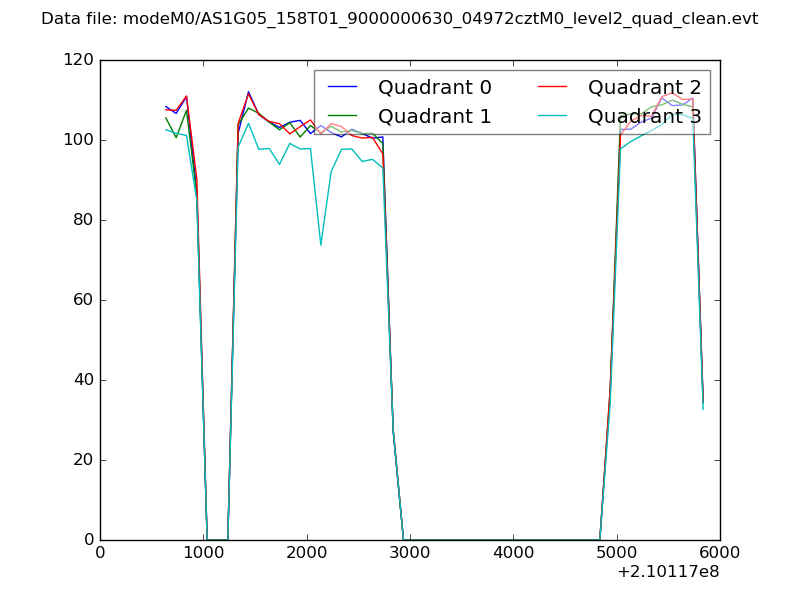 |
|
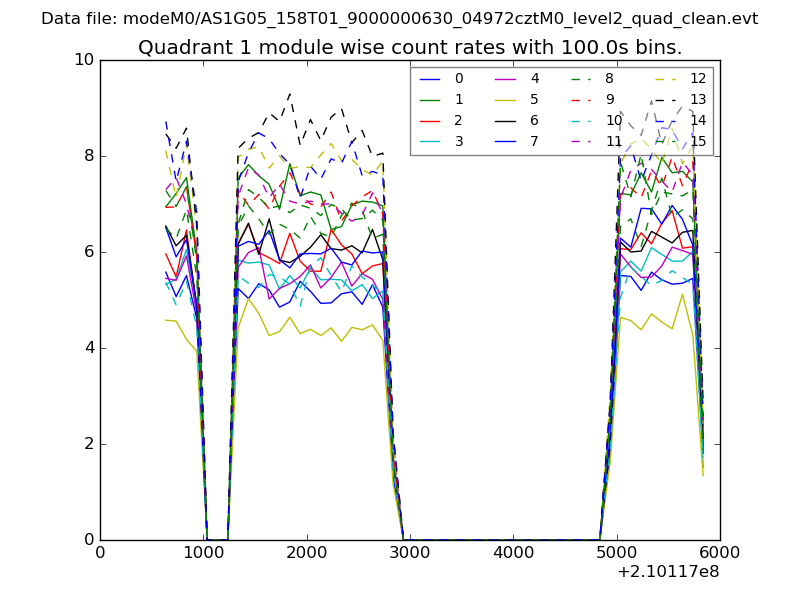
| Module-wise count rates for Quadrant A Data is divided into 100 sec bins |
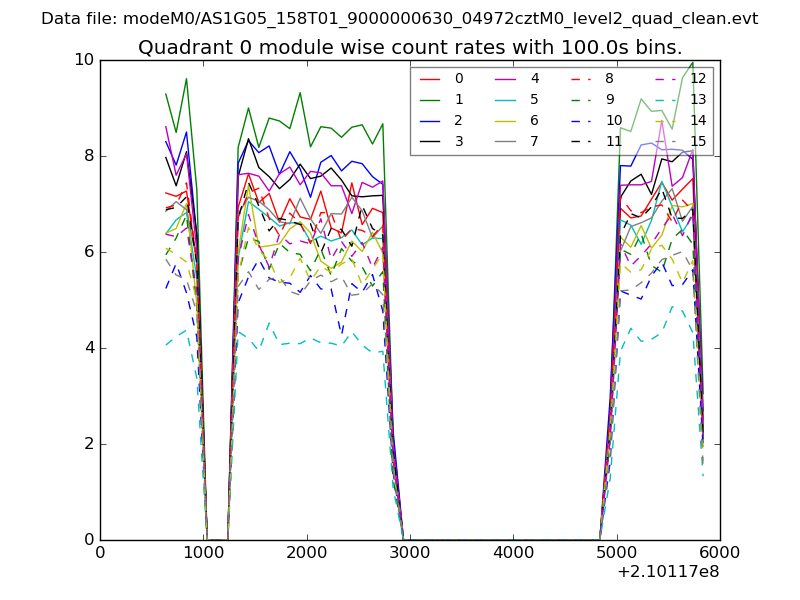 |
 |
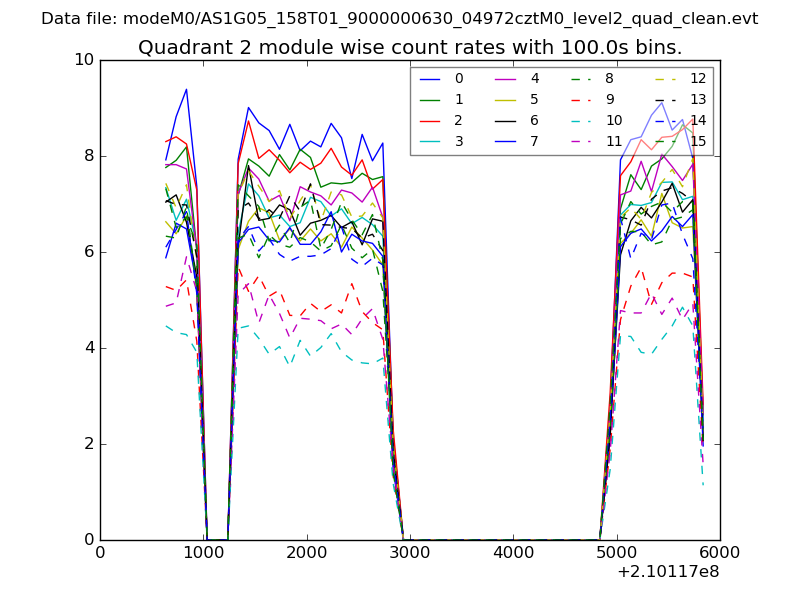
| Module-wise count rates for Quadrant B Data is divided into 100 sec bins |
 |
 |
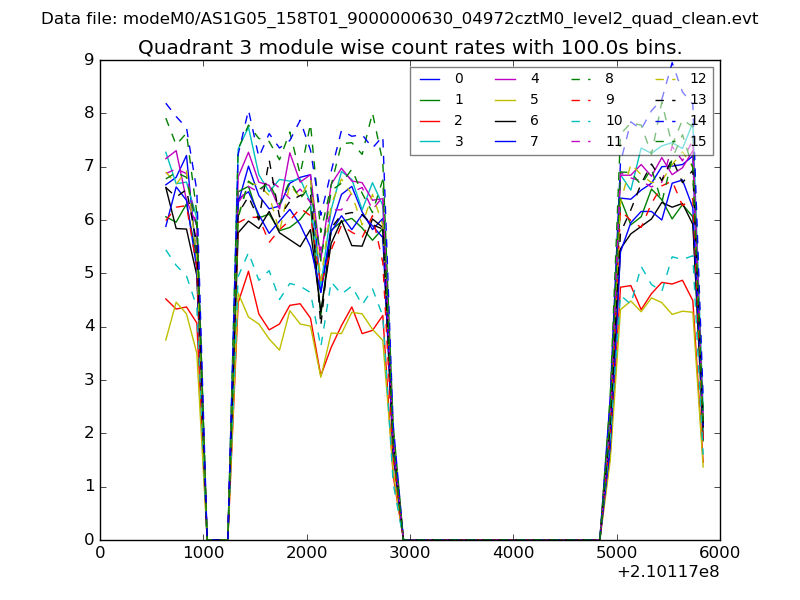
| Module-wise count rates for Quadrant C Data is divided into 100 sec bins |
 |
 |
| Module-wise count rates for Quadrant D Data is divided into 100 sec bins |
 |
 |
| Parameter | Plot |
|---|---|
| CZT HV Monitor | 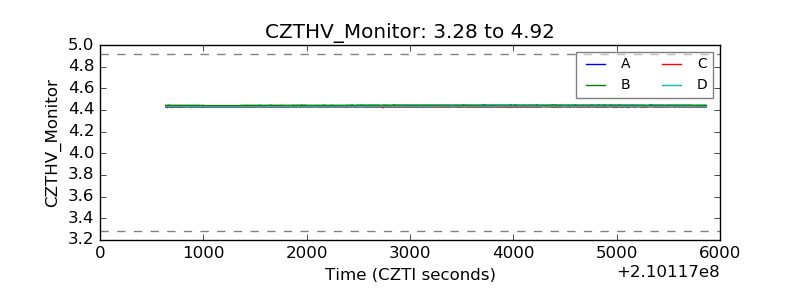 |
| D_VDD | 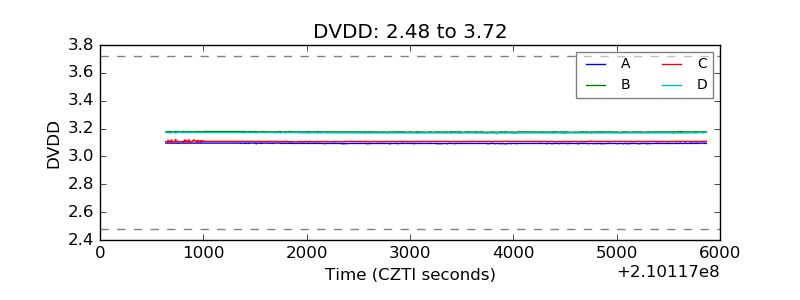 |
| Temperature 1 | 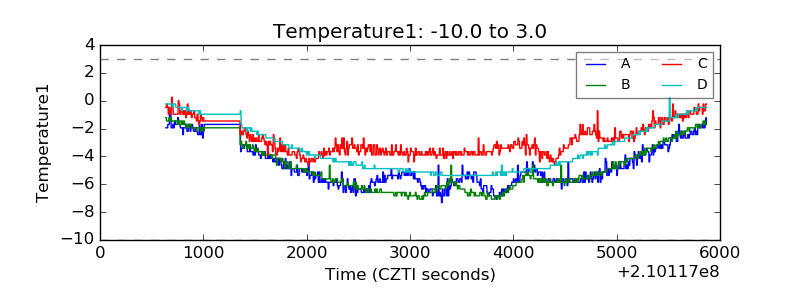 |
| Veto HV Monitor | 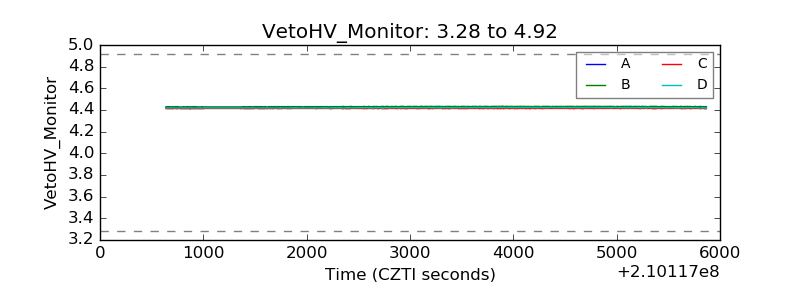 |
| Veto LLD | 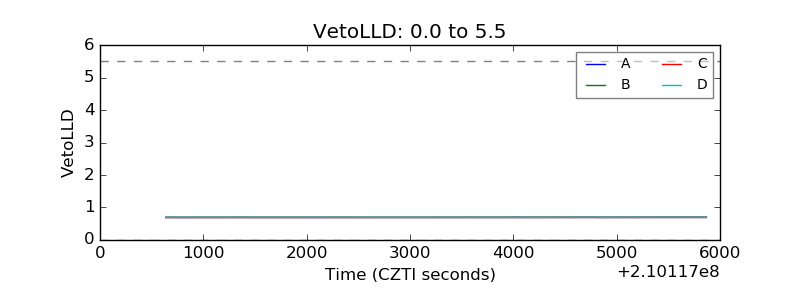 |
| Alpha Counter | 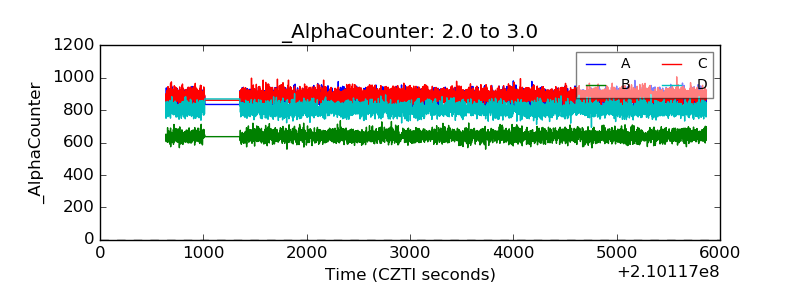 |
| _CPM_Rate | 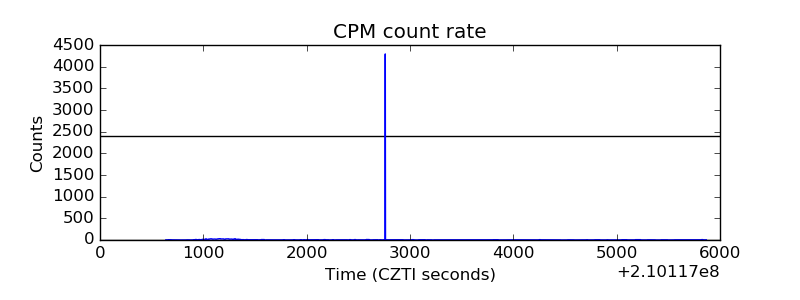 |
| CZT Counter | 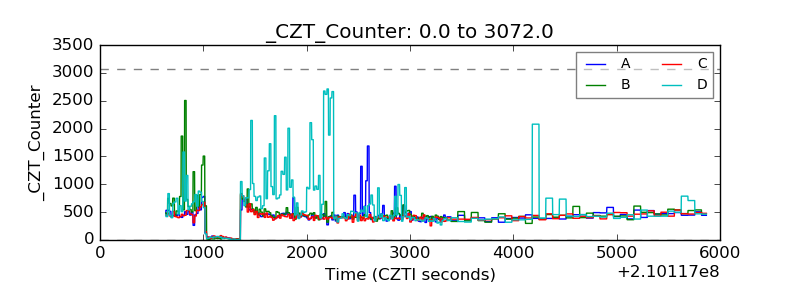 |
| +2.5 Volts monitor |  |
| +5 Volts monitor |  |
| _ROLL_ROT | 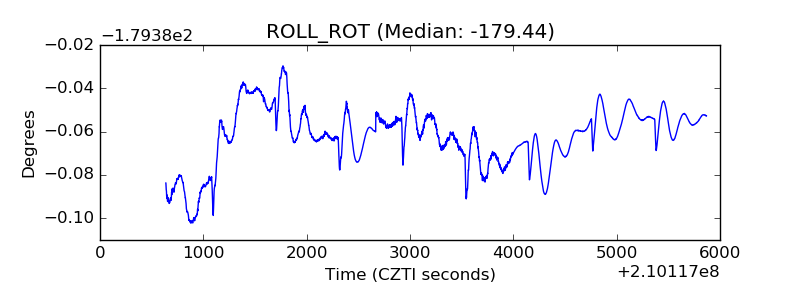 |
| _Roll_DEC | 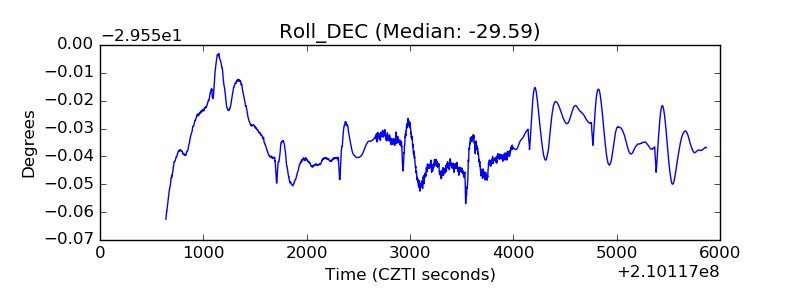 |
| _Roll_RA | 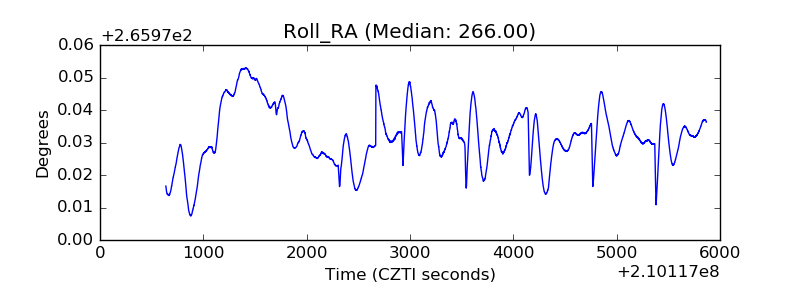 |
| Veto Counter | 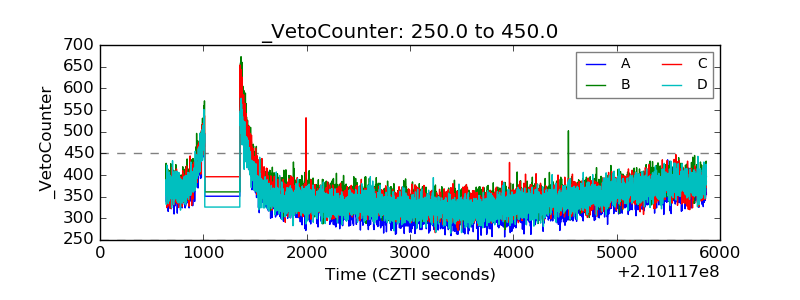 |