| Param | Original file | Final file |
|---|---|---|
| Filename | modeM0/AS1G05_158T01_9000000630_04973cztM0_level2.evt | modeM0/AS1G05_158T01_9000000630_04973cztM0_level2_quad_clean.evt |
| Size (bytes) | 2,483,619,840 | 364,754,880 |
| Size | 2.3 GB | 347.9 MB |
| Events in quadrant A | 16,305,135 | 2,198,218 |
| Events in quadrant B | 17,270,047 | 2,203,667 |
| Events in quadrant C | 15,384,800 | 2,213,555 |
| Events in quadrant D | 23,901,923 | 2,034,924 |
| Mode M9 | |||
|---|---|---|---|
| Quadrant | BADHDUFLAG | Total packets | Discarded packets |
| A | 0 | 31 | 0 |
| B | 0 | 31 | 0 |
| C | 0 | 31 | 0 |
| D | 0 | 31 | 0 |
| Mode M0 | |||
|---|---|---|---|
| Quadrant | BADHDUFLAG | Total packets | Discarded packets |
| A | 0 | 73161 | 7 |
| B | 0 | 74535 | 6 |
| C | 0 | 71014 | 6 |
| D | 0 | 96421 | 6 |
| Mode SS | |||
|---|---|---|---|
| Quadrant | BADHDUFLAG | Total packets | Discarded packets |
| A | 0 | 708 | 0 |
| B | 0 | 708 | 0 |
| C | 0 | 708 | 0 |
| D | 0 | 708 | 0 |
| Quadrant | Total seconds | Saturated seconds | Saturation percentage |
|---|---|---|---|
| A | 34886 | 251 | 0.719486% |
| B | 34886 | 228 | 0.653557% |
| C | 34886 | 62 | 0.177722% |
| D | 34886 | 2170 | 6.220260% |
Noise dominated data is calculated using 1-second bins in cleaned event files. If a bin has >2000 counts, and if more than 50% of those come from <1% of pixels, then it is considered to be noise-dominated and hence unusable.
| Quadrant | # 1 sec bins | Bins with >0 counts | Bins with >2000 counts | High rate bins dominated by noise | Noise dominated (total time) | Noise dominated (detector-on time) | Marked lightcurve |
|---|---|---|---|---|---|---|---|
| A | 37901 | 34889 | 92 | 92 | 0.24% | 0.26% | 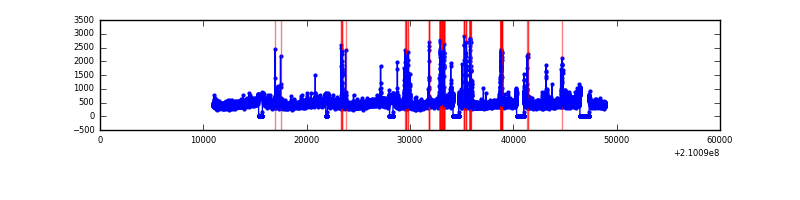 |
| B | 37901 | 34889 | 50 | 50 | 0.13% | 0.14% | 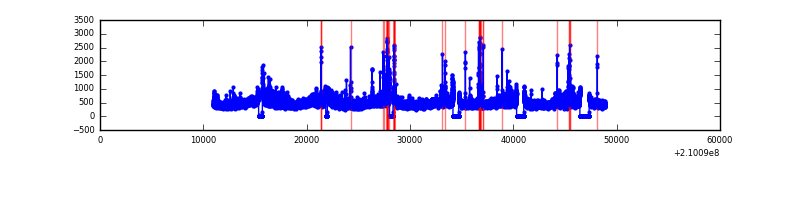 |
| C | 37901 | 34890 | 3 | 3 | 0.01% | 0.01% | 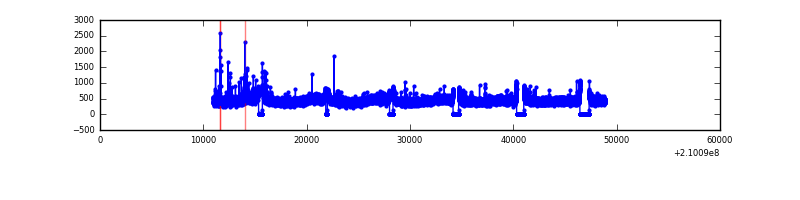 |
| D | 37901 | 34888 | 1804 | 1804 | 4.76% | 5.17% | 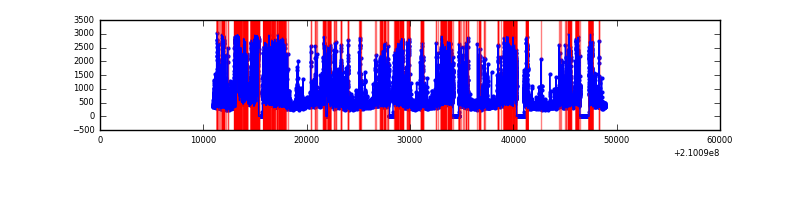 |
Top three noisy pixels from each quadrant. If the there are fewer than three noisy pixels in the level2.evt file, extra rows are filled as -1
| Pixel properties | Quadrant properties | ||||||
|---|---|---|---|---|---|---|---|
| Quadrant | DetID | PixID | Counts | Sigma | Mean | Median | Sigma |
| A | 0 | 50 | 601561 | 733.29 | 4008 | 3918 | 815.0 |
| A | 13 | 251 | 136180 | 162.28 | 4008 | 3918 | 815.0 |
| A | 14 | 111 | 122905 | 145.99 | 4008 | 3918 | 815.0 |
| B | 15 | 204 | 904143 | 1173.52 | 4060 | 3965 | 767.1 |
| B | 14 | 167 | 218142 | 279.21 | 4060 | 3965 | 767.1 |
| B | 0 | 219 | 133260 | 168.56 | 4060 | 3965 | 767.1 |
| C | 1 | 16 | 125500 | 134.63 | 3896 | 3910 | 903.1 |
| C | 13 | 61 | 32493 | 31.65 | 3896 | 3910 | 903.1 |
| C | 8 | 128 | 20222 | 18.06 | 3896 | 3910 | 903.1 |
| D | 12 | 227 | 2687047 | 2890.69 | 3783 | 3669 | 928.3 |
| D | 2 | 33 | 2436882 | 2621.2 | 3783 | 3669 | 928.3 |
| D | 2 | 136 | 1559169 | 1675.68 | 3783 | 3669 | 928.3 |
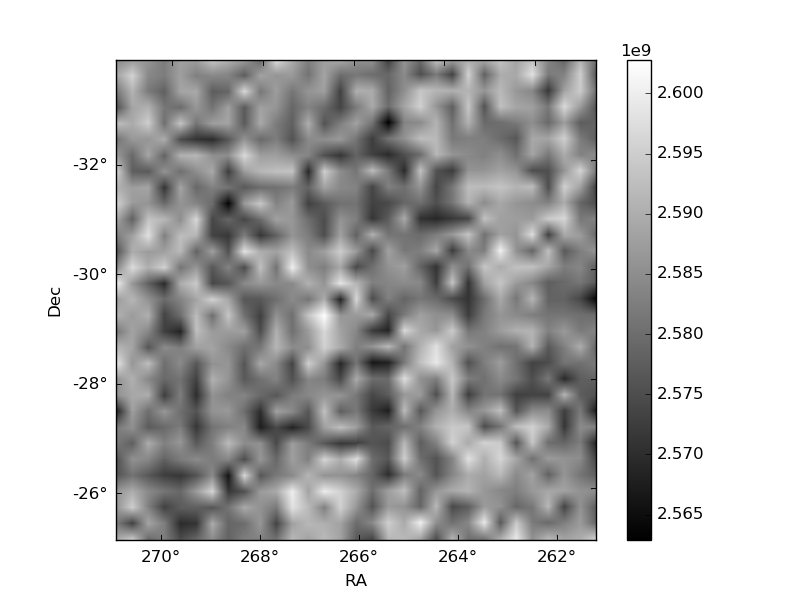
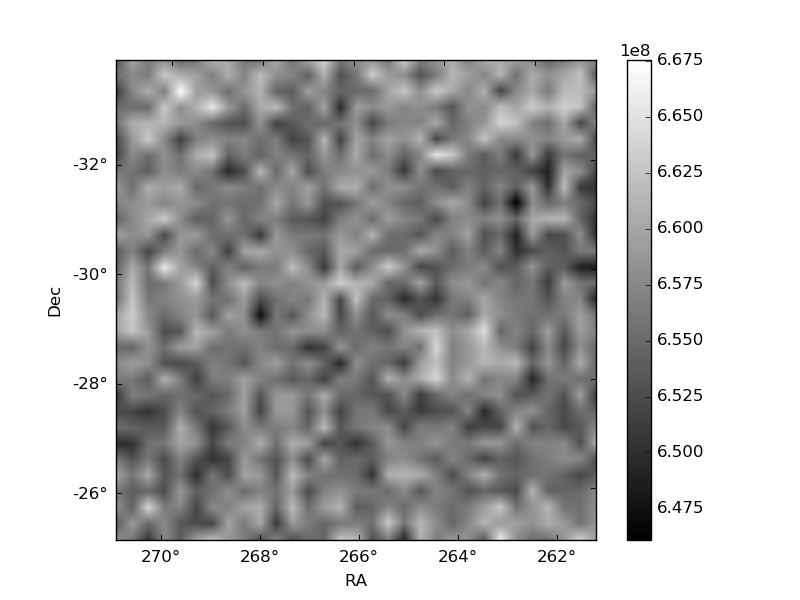
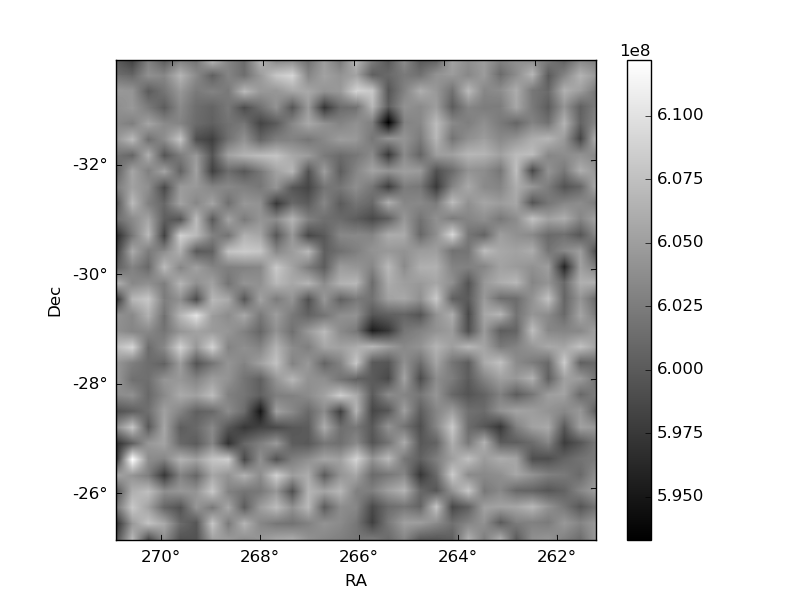
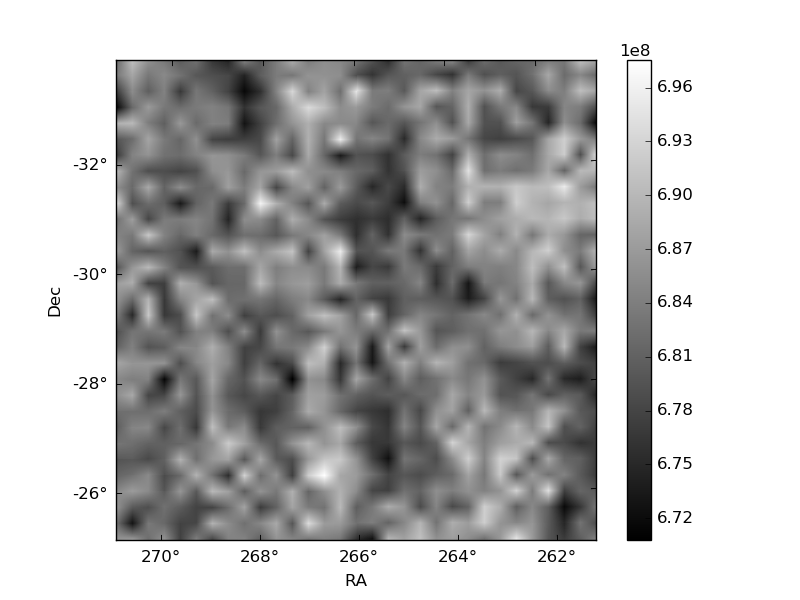
Histogram calculated using DETX and DETY for each event in the final _common_clean file
| Quadrant A | 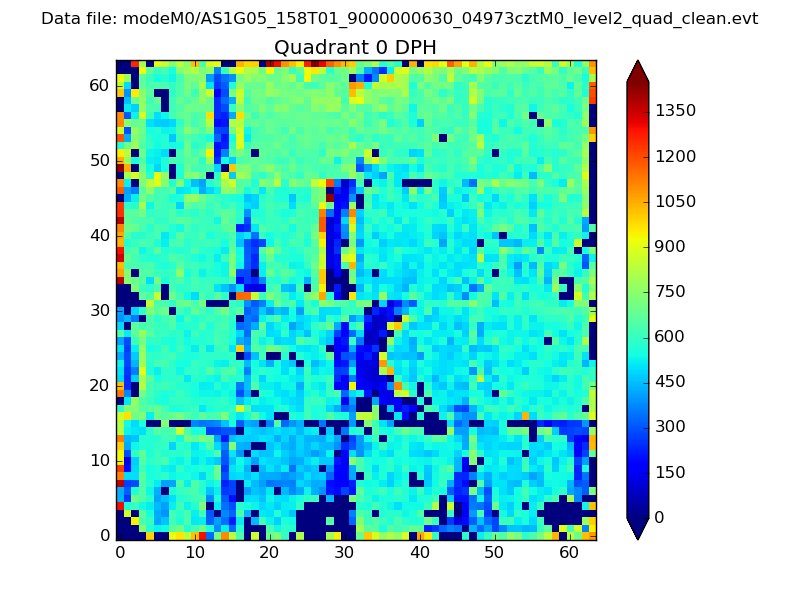 |
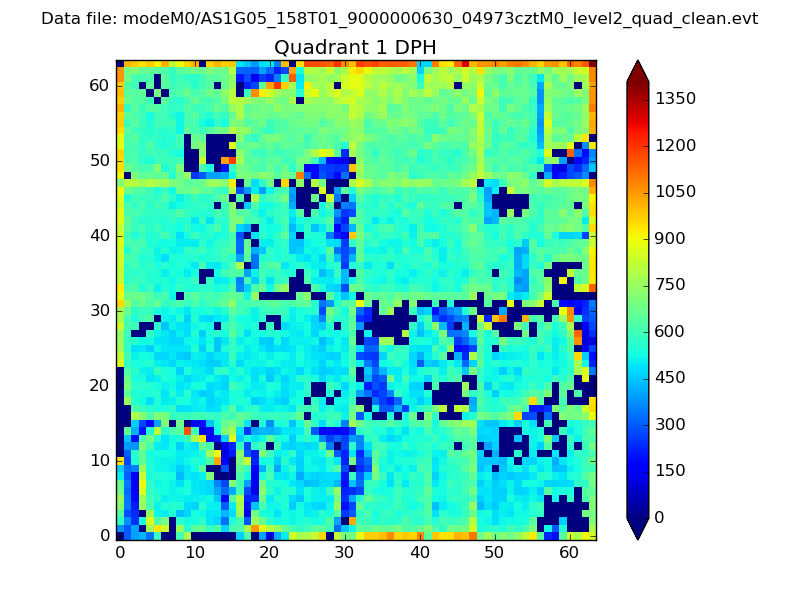 |
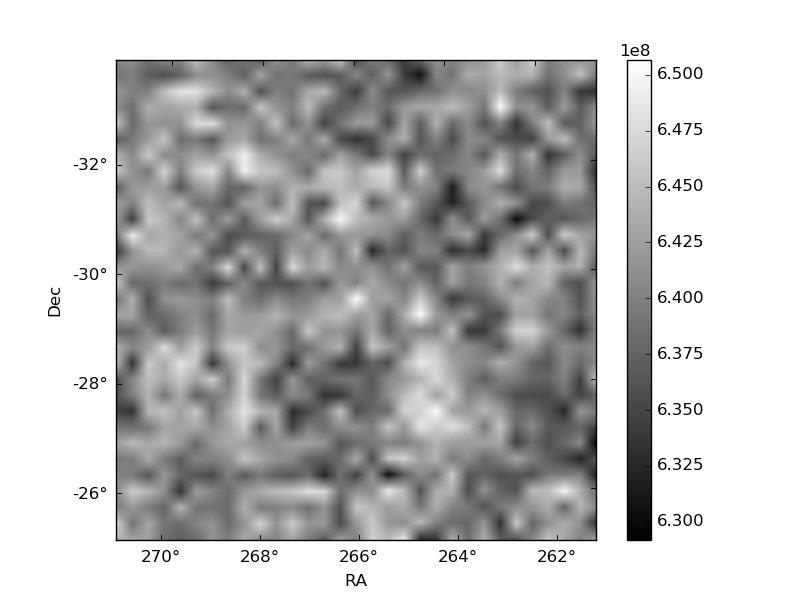
Quadrant B |
|---|---|---|---|
| Quadrant D | 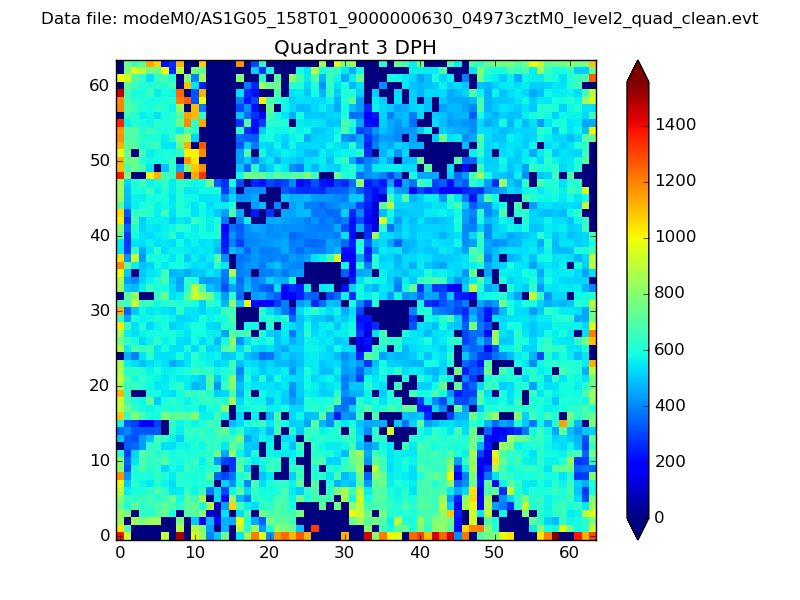 |
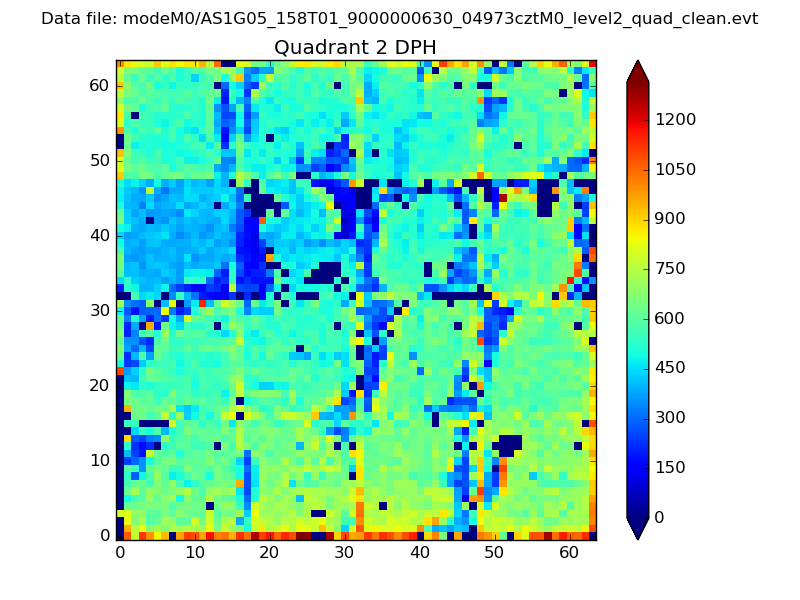 |
Quadrant C |
| Plot type | Count rate plots | Images |
|---|---|---|
| Comparison with Poisson distribution Blue bars denote a histogram of data divided into 1 sec bins. Red curve is a Poisson curve with rate = median count rate of data. |
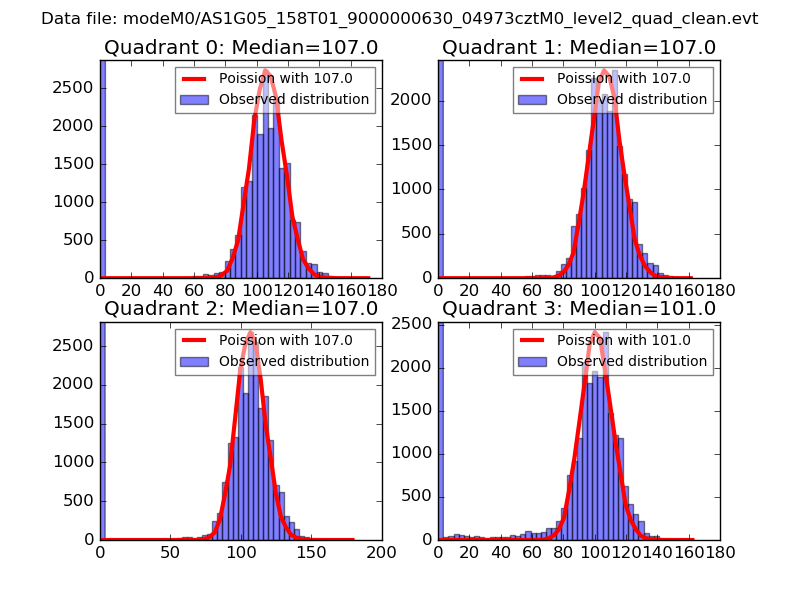 |
 |
| Quadrant-wise count rates Data is divided into 100 sec bins |
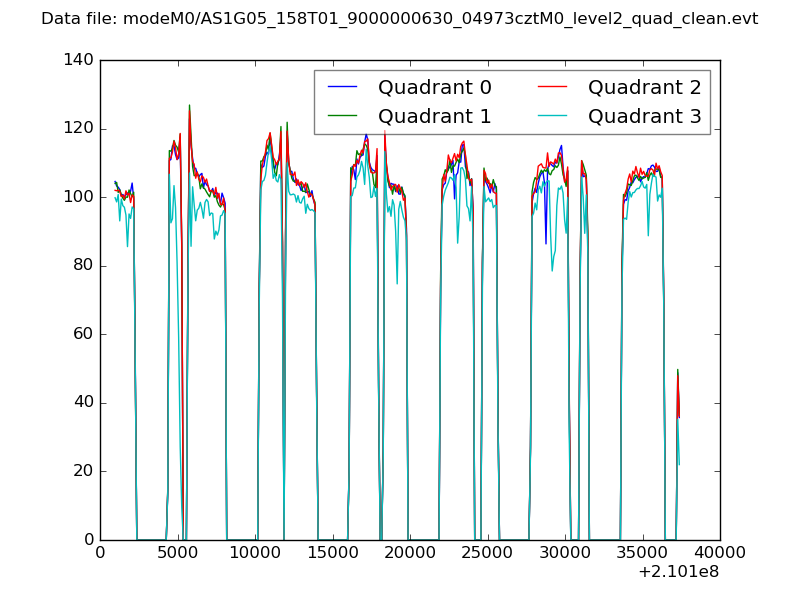 |
|
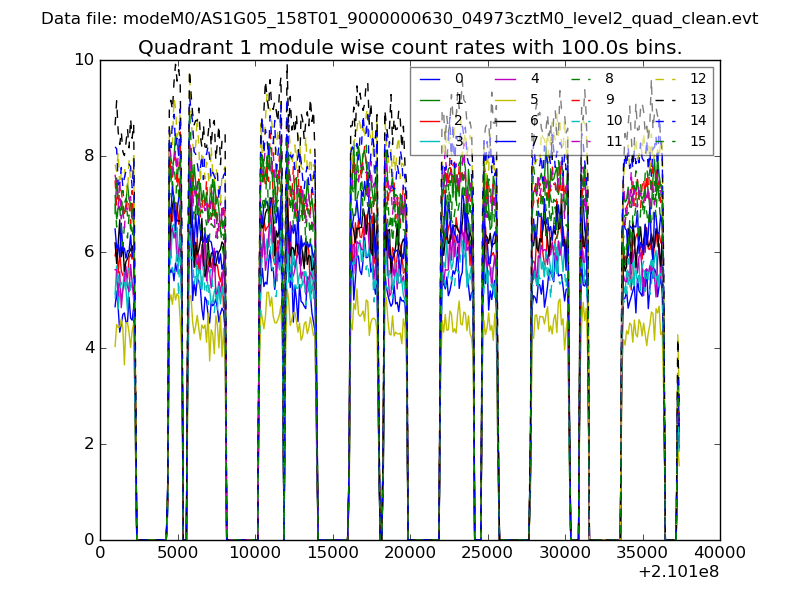
| Module-wise count rates for Quadrant A Data is divided into 100 sec bins |
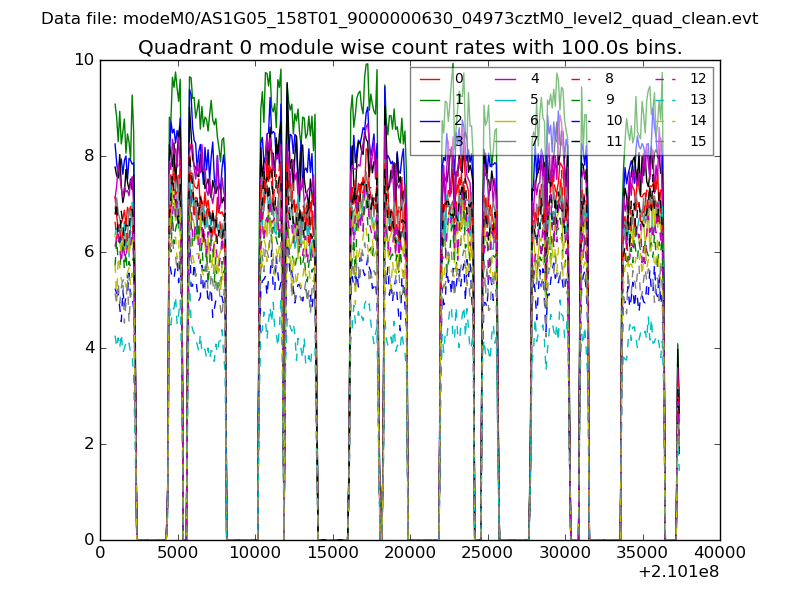 |
 |
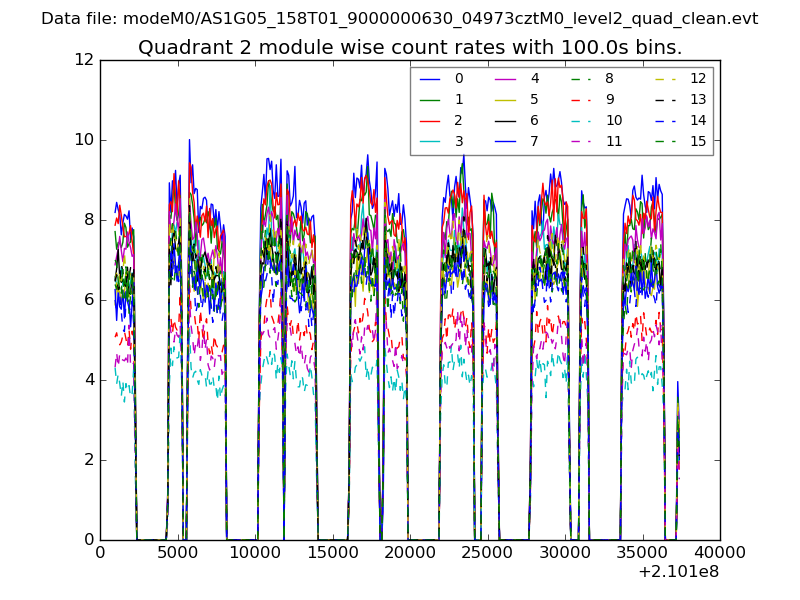
| Module-wise count rates for Quadrant B Data is divided into 100 sec bins |
 |
 |
| Module-wise count rates for Quadrant C Data is divided into 100 sec bins |
 |
 |
| Module-wise count rates for Quadrant D Data is divided into 100 sec bins |
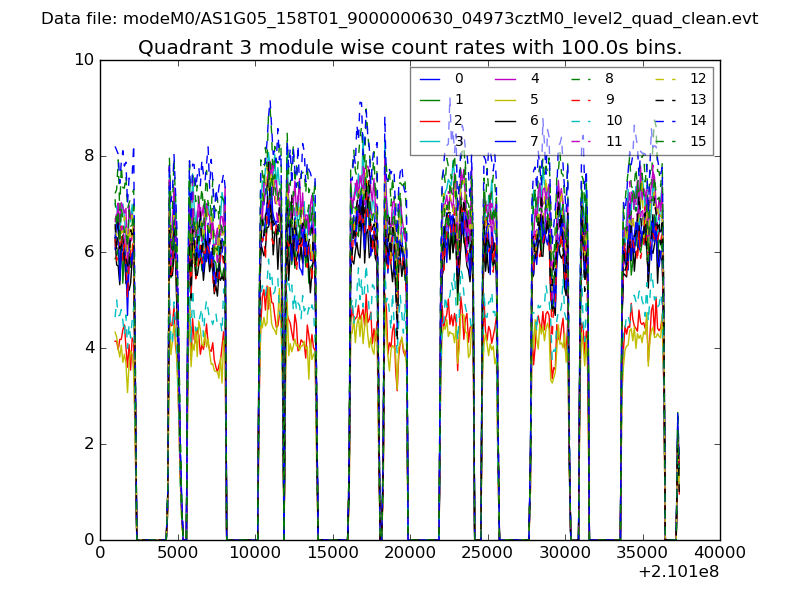 |
 |
| Parameter | Plot |
|---|---|
| CZT HV Monitor | 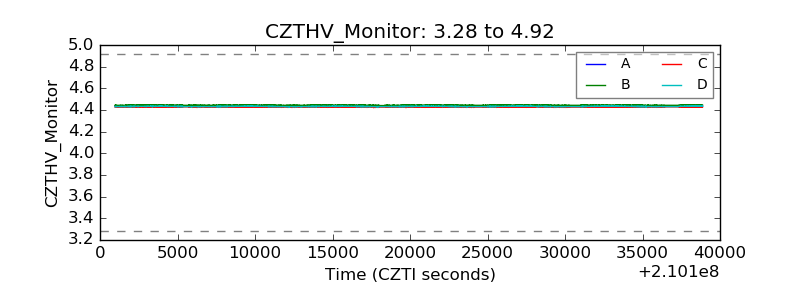 |
| D_VDD | 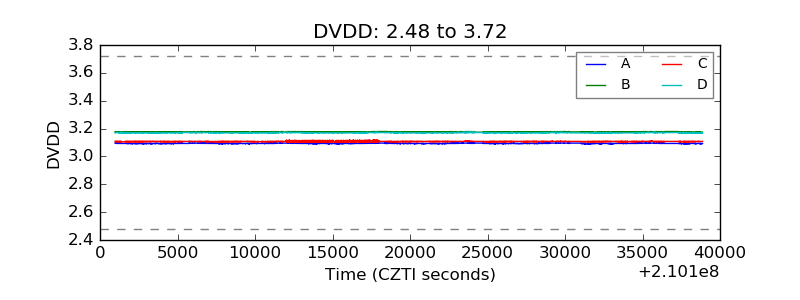 |
| Temperature 1 | 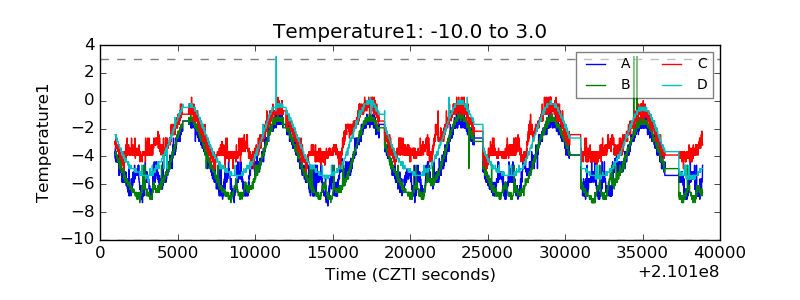 |
| Veto HV Monitor | 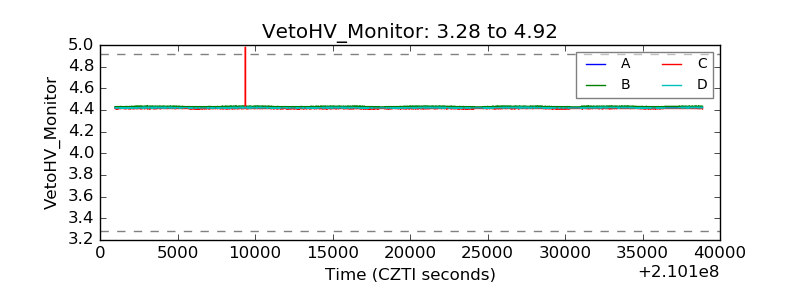 |
| Veto LLD | 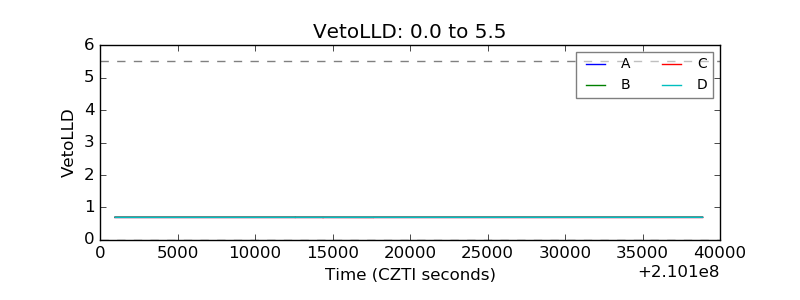 |
| Alpha Counter | 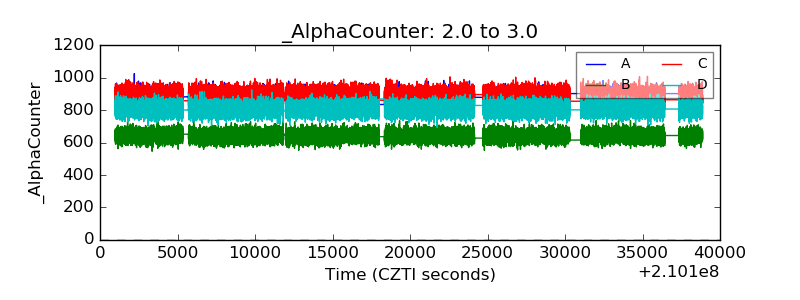 |
| _CPM_Rate | 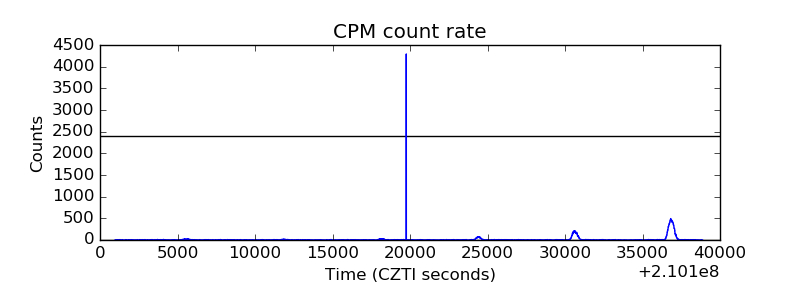 |
| CZT Counter | 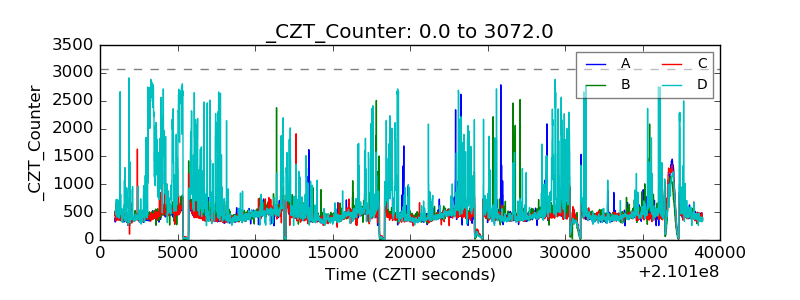 |
| +2.5 Volts monitor |  |
| +5 Volts monitor | 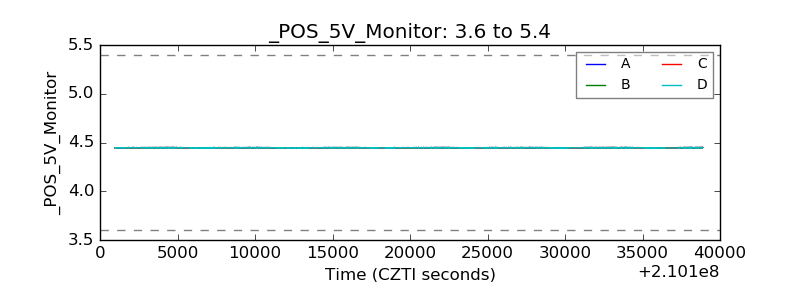 |
| _ROLL_ROT | 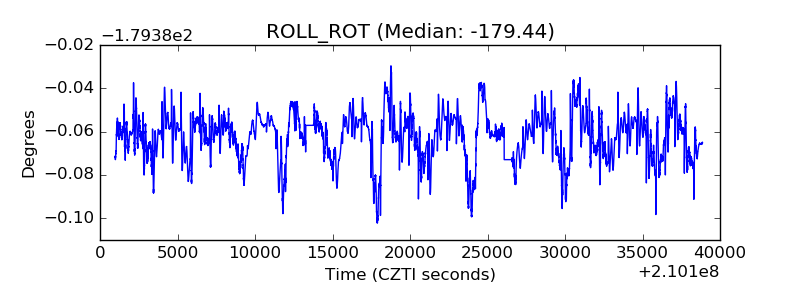 |
| _Roll_DEC | 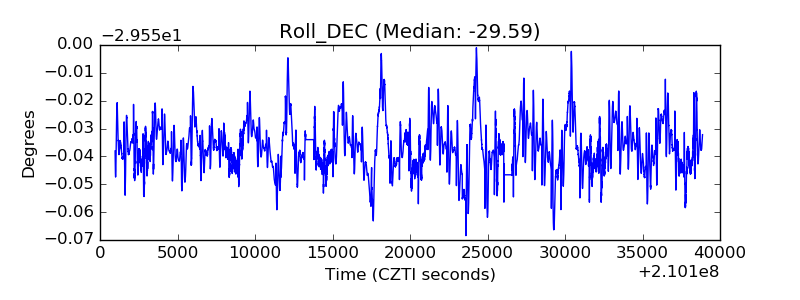 |
| _Roll_RA | 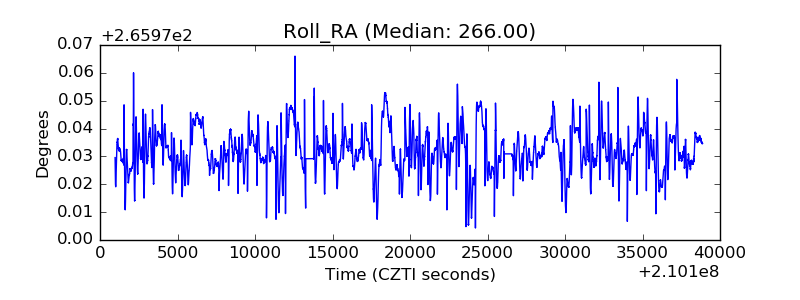 |
| Veto Counter | 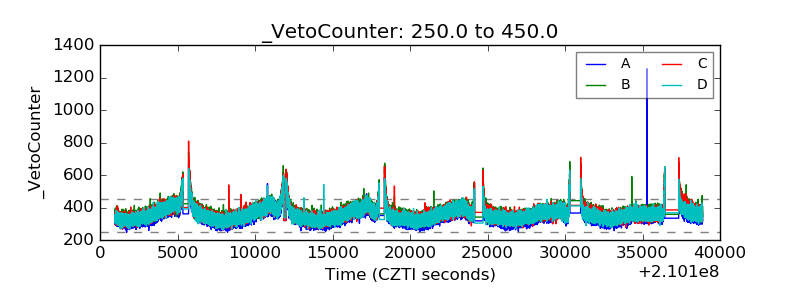 |