| Param | Original file | Final file |
|---|---|---|
| Filename | modeM0/AS1G05_158T01_9000000630_04976cztM0_level2.evt | modeM0/AS1G05_158T01_9000000630_04976cztM0_level2_quad_clean.evt |
| Size (bytes) | 446,823,360 | 62,619,840 |
| Size | 426.1 MB | 59.7 MB |
| Events in quadrant A | 3,117,939 | 363,298 |
| Events in quadrant B | 3,162,862 | 366,882 |
| Events in quadrant C | 3,066,620 | 368,661 |
| Events in quadrant D | 3,742,896 | 343,706 |
| Mode M9 | |||
|---|---|---|---|
| Quadrant | BADHDUFLAG | Total packets | Discarded packets |
| A | 0 | 18 | 0 |
| B | 0 | 18 | 0 |
| C | 0 | 18 | 0 |
| D | 0 | 19 | 0 |
| Mode M0 | |||
|---|---|---|---|
| Quadrant | BADHDUFLAG | Total packets | Discarded packets |
| A | 0 | 13482 | 3 |
| B | 0 | 13485 | 2 |
| C | 0 | 13477 | 2 |
| D | 0 | 15544 | 2 |
| Mode SS | |||
|---|---|---|---|
| Quadrant | BADHDUFLAG | Total packets | Discarded packets |
| A | 0 | 130 | 0 |
| B | 0 | 130 | 0 |
| C | 0 | 130 | 0 |
| D | 0 | 130 | 0 |
| Quadrant | Total seconds | Saturated seconds | Saturation percentage |
|---|---|---|---|
| A | 6504 | 62 | 0.953260% |
| B | 6504 | 74 | 1.137761% |
| C | 6504 | 56 | 0.861009% |
| D | 6504 | 231 | 3.551661% |
Noise dominated data is calculated using 1-second bins in cleaned event files. If a bin has >2000 counts, and if more than 50% of those come from <1% of pixels, then it is considered to be noise-dominated and hence unusable.
| Quadrant | # 1 sec bins | Bins with >0 counts | Bins with >2000 counts | High rate bins dominated by noise | Noise dominated (total time) | Noise dominated (detector-on time) | Marked lightcurve |
|---|---|---|---|---|---|---|---|
| A | 7659 | 6504 | 3 | 3 | 0.04% | 0.05% | 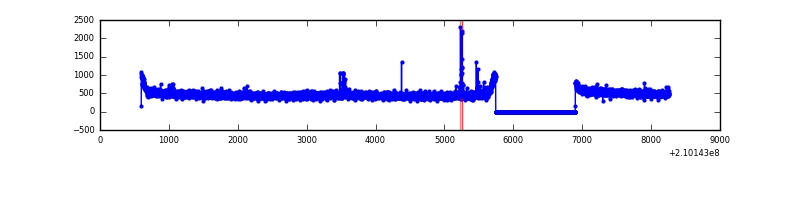 |
| B | 7659 | 6504 | 0 | 0 | 0.00% | 0.00% | 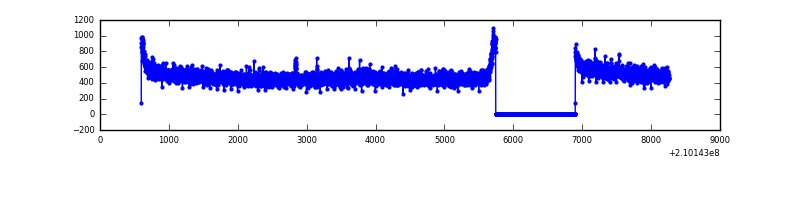 |
| C | 7659 | 6504 | 0 | 0 | 0.00% | 0.00% | 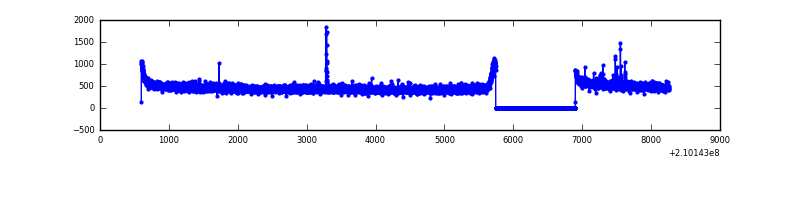 |
| D | 7659 | 6504 | 179 | 179 | 2.34% | 2.75% | 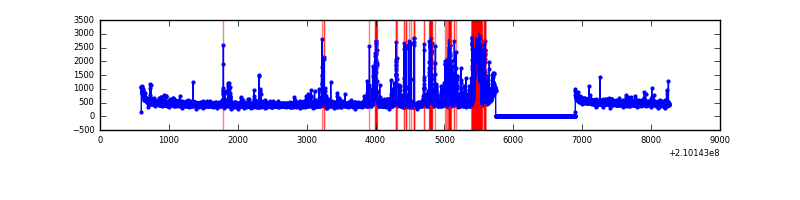 |
Top three noisy pixels from each quadrant. If the there are fewer than three noisy pixels in the level2.evt file, extra rows are filled as -1
| Pixel properties | Quadrant properties | ||||||
|---|---|---|---|---|---|---|---|
| Quadrant | DetID | PixID | Counts | Sigma | Mean | Median | Sigma |
| A | 0 | 50 | 35796 | 215.97 | 799 | 781 | 162.1 |
| A | 12 | 194 | 8022 | 44.66 | 799 | 781 | 162.1 |
| A | 0 | 226 | 7910 | 43.97 | 799 | 781 | 162.1 |
| B | 15 | 204 | 17157 | 106.96 | 806 | 786 | 153.1 |
| B | 0 | 183 | 16744 | 104.26 | 806 | 786 | 153.1 |
| B | 12 | 111 | 13667 | 84.16 | 806 | 786 | 153.1 |
| C | 12 | 4 | 16680 | 88.85 | 777 | 784 | 178.9 |
| C | 9 | 54 | 12603 | 66.06 | 777 | 784 | 178.9 |
| C | 13 | 61 | 6329 | 30.99 | 777 | 784 | 178.9 |
| D | 2 | 33 | 558347 | 2980.53 | 766 | 744 | 187.1 |
| D | 13 | 235 | 108552 | 576.26 | 766 | 744 | 187.1 |
| D | 13 | 105 | 59440 | 313.74 | 766 | 744 | 187.1 |
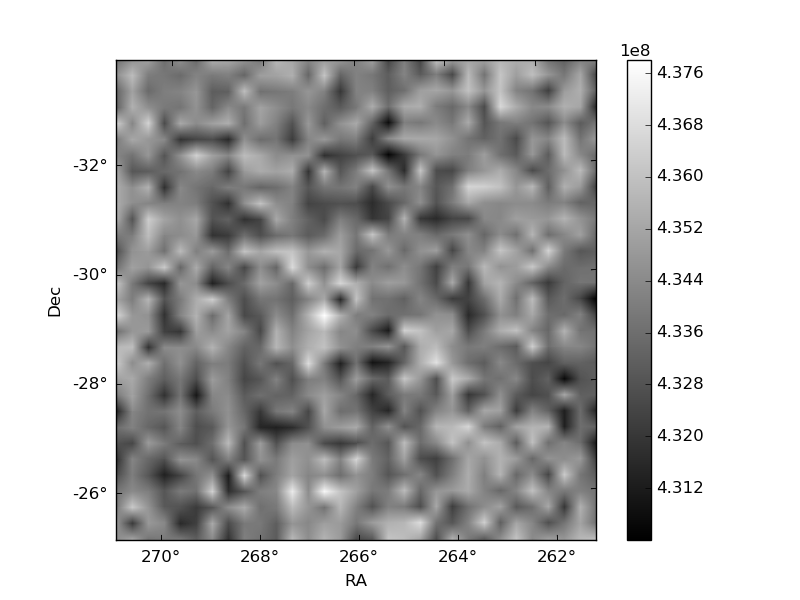
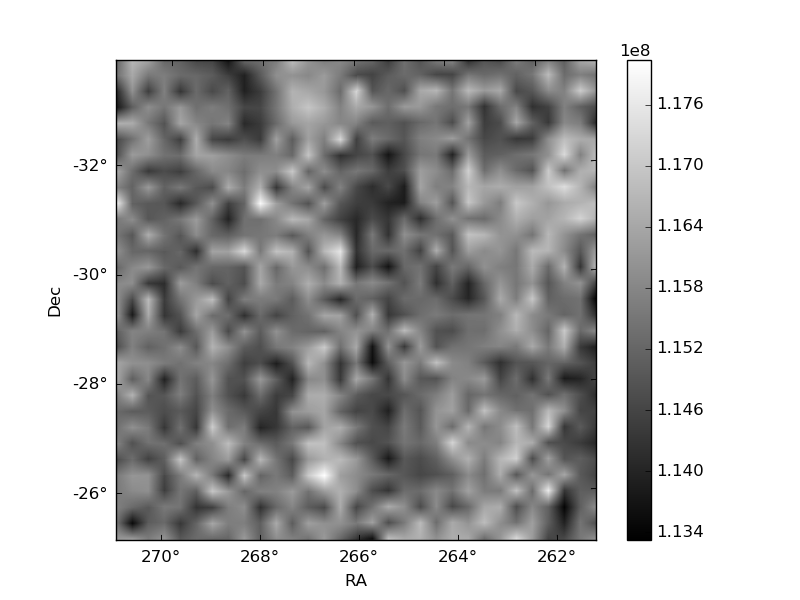
Histogram calculated using DETX and DETY for each event in the final _common_clean file
| Quadrant A | 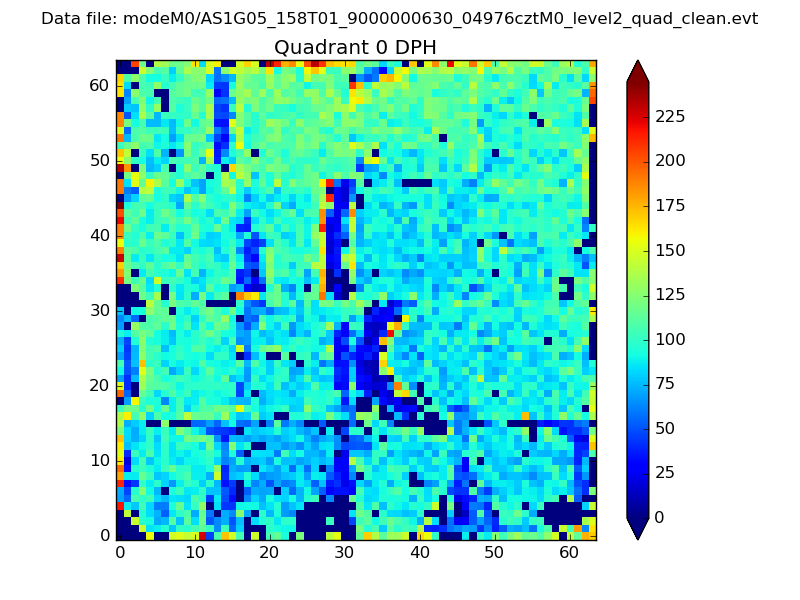 |
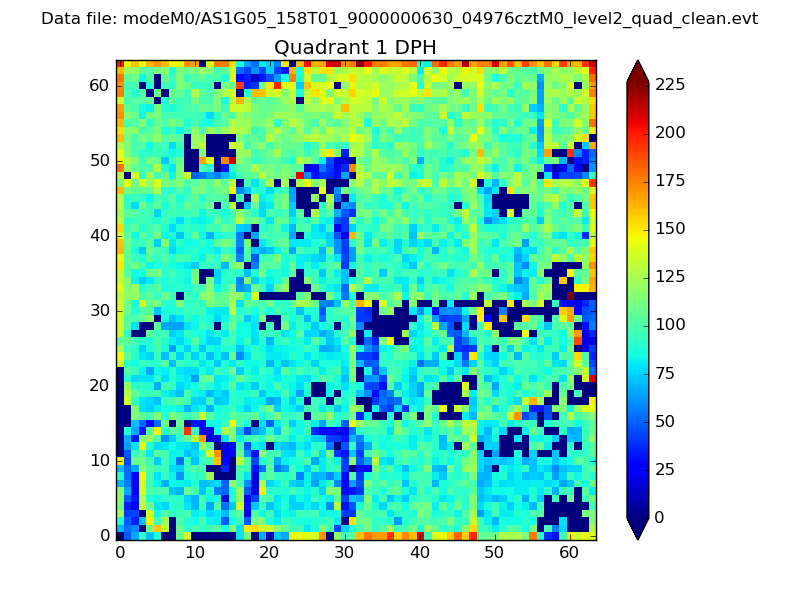 |
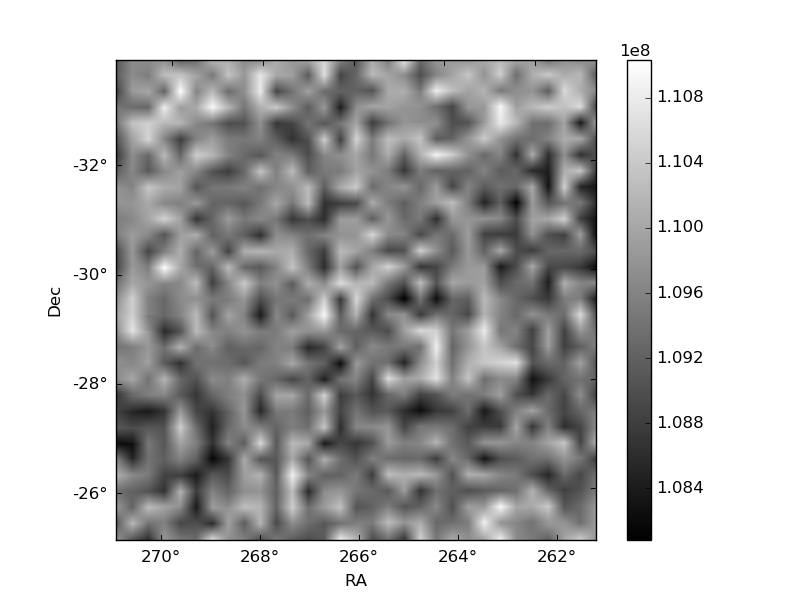
Quadrant B |
|---|---|---|---|
| Quadrant D | 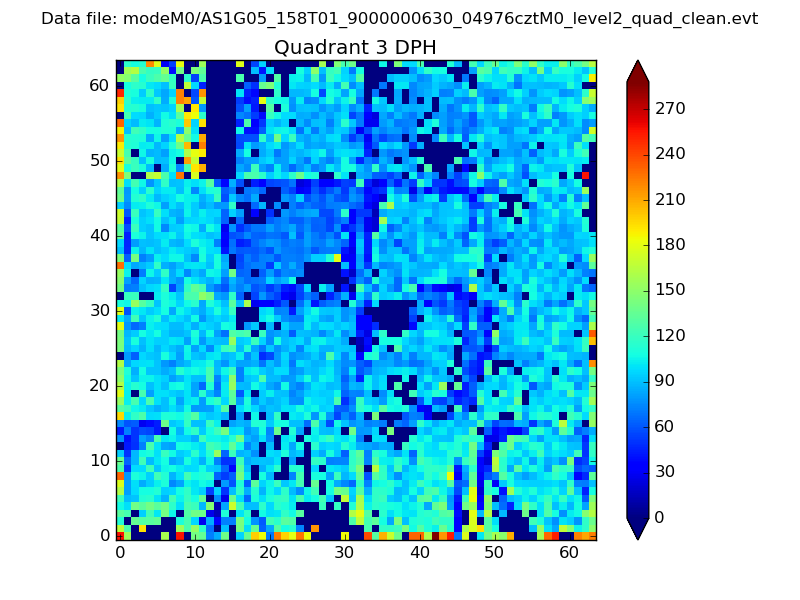 |
 |
Quadrant C |
| Plot type | Count rate plots | Images |
|---|---|---|
| Comparison with Poisson distribution Blue bars denote a histogram of data divided into 1 sec bins. Red curve is a Poisson curve with rate = median count rate of data. |
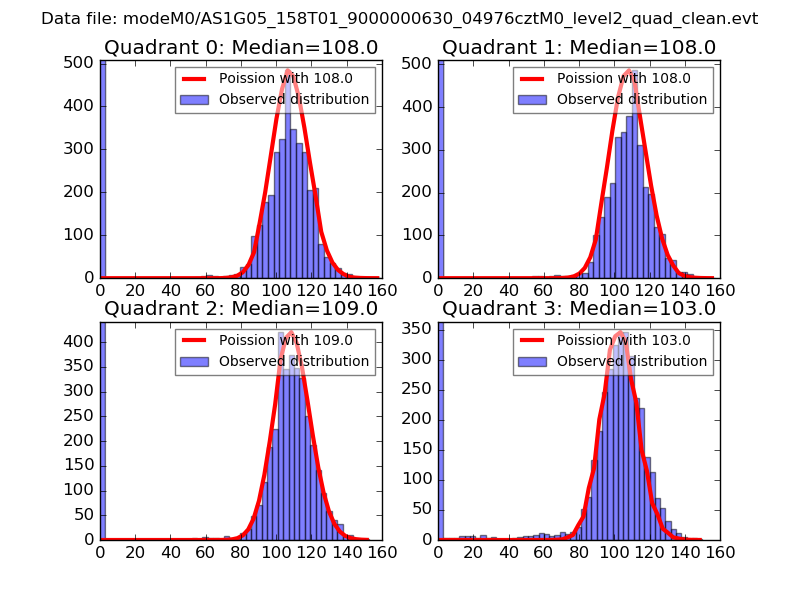 |
 |
| Quadrant-wise count rates Data is divided into 100 sec bins |
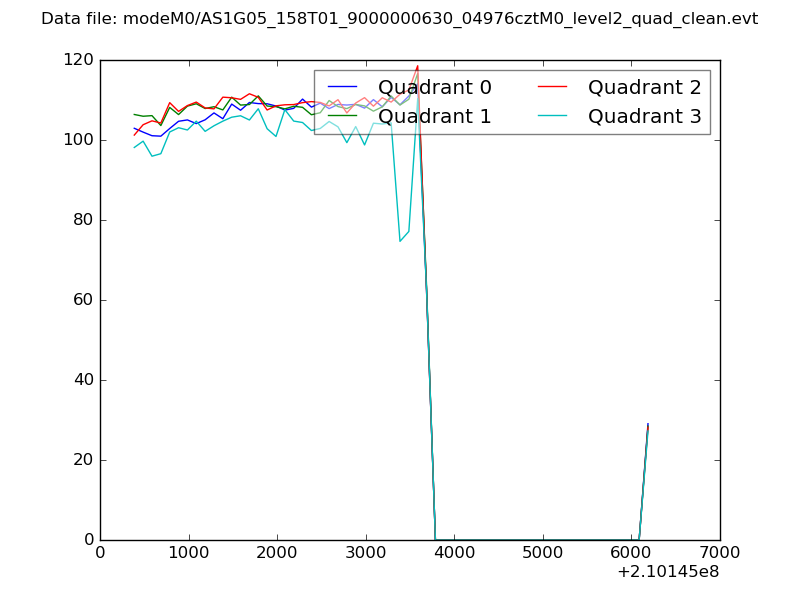 |
|
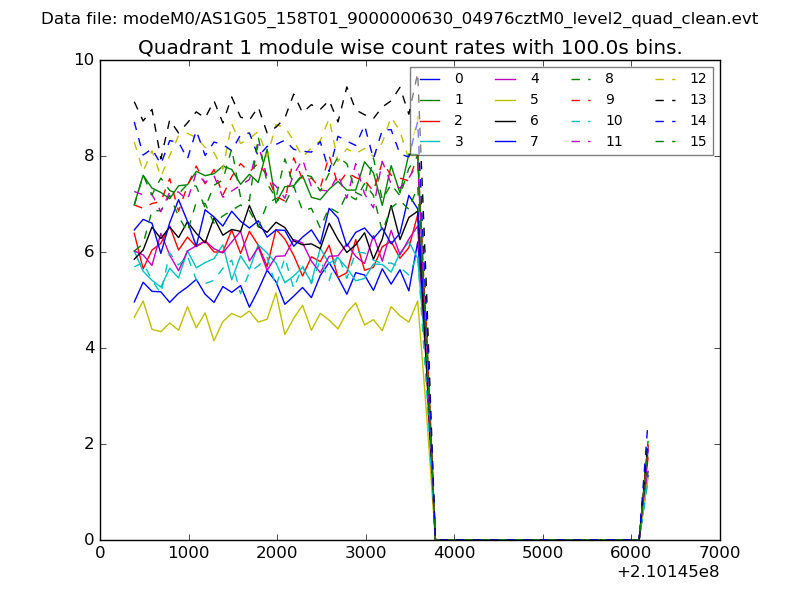
| Module-wise count rates for Quadrant A Data is divided into 100 sec bins |
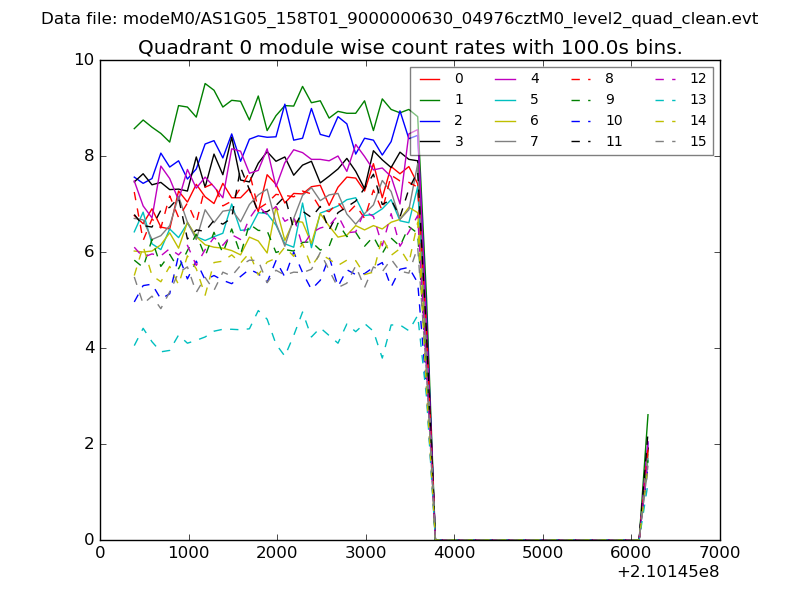 |
 |
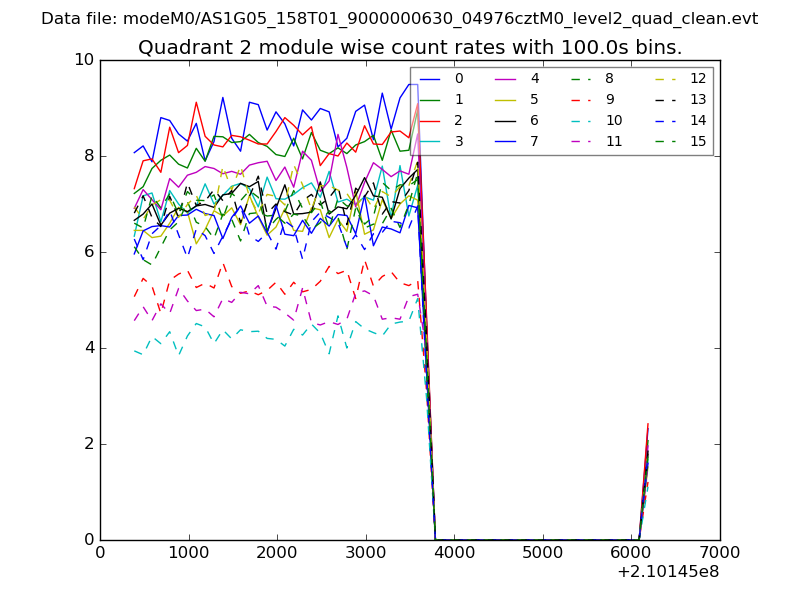
| Module-wise count rates for Quadrant B Data is divided into 100 sec bins |
 |
 |
| Module-wise count rates for Quadrant C Data is divided into 100 sec bins |
 |
 |
| Module-wise count rates for Quadrant D Data is divided into 100 sec bins |
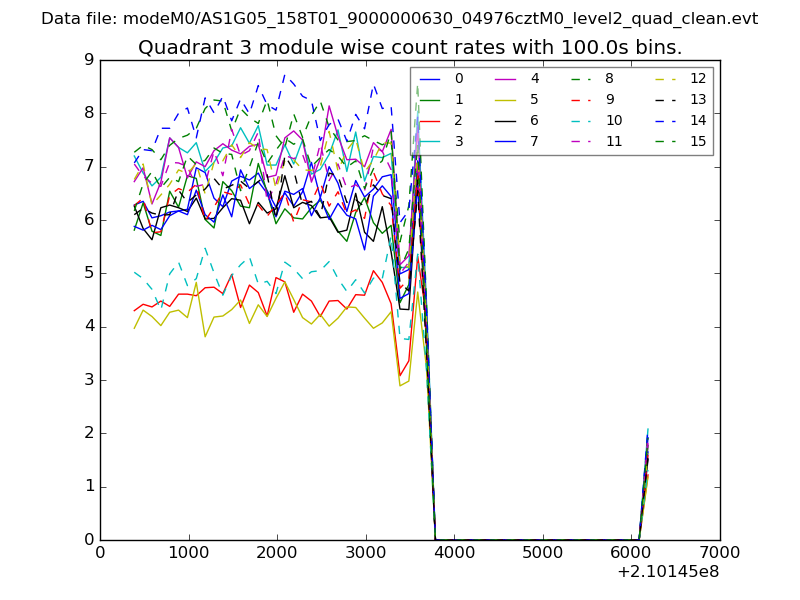 |
 |
| Parameter | Plot |
|---|---|
| CZT HV Monitor | 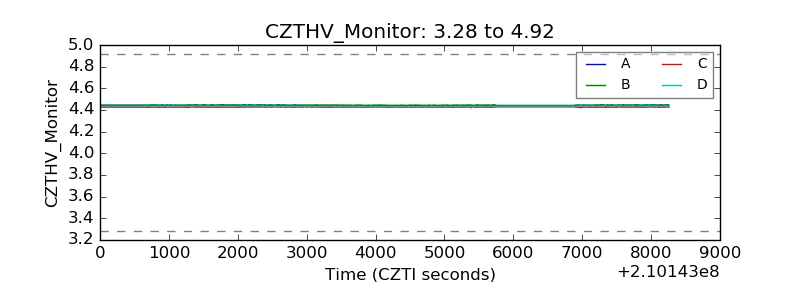 |
| D_VDD | 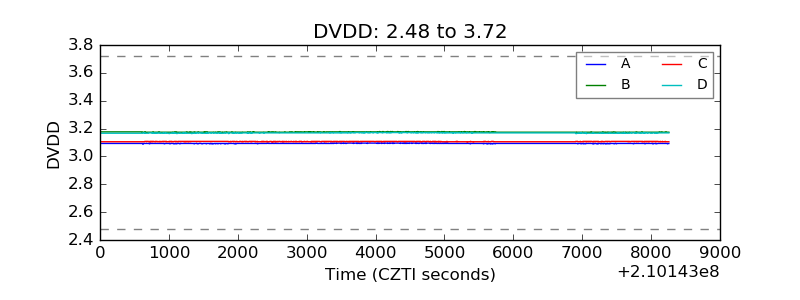 |
| Temperature 1 | 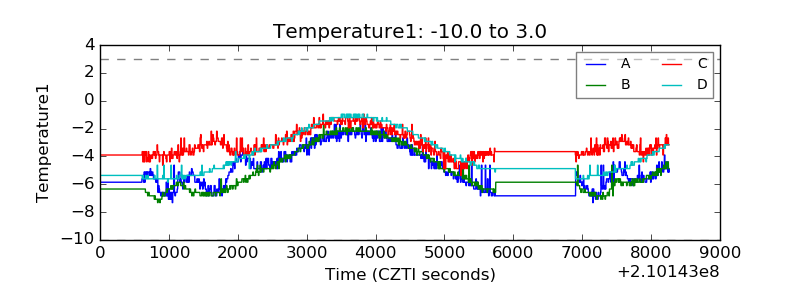 |
| Veto HV Monitor | 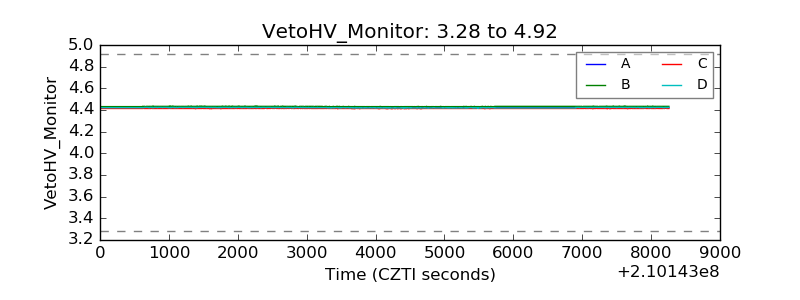 |
| Veto LLD | 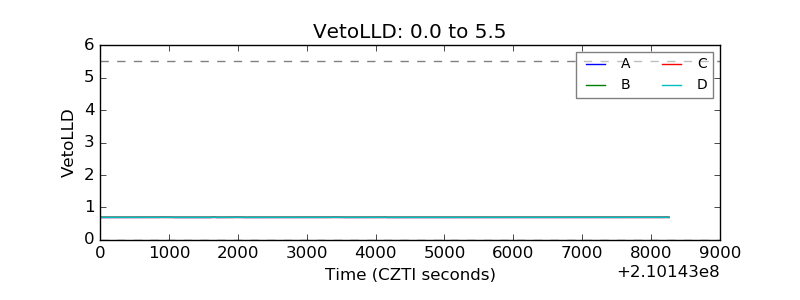 |
| Alpha Counter |  |
| _CPM_Rate |  |
| CZT Counter |  |
| +2.5 Volts monitor |  |
| +5 Volts monitor |  |
| _ROLL_ROT | 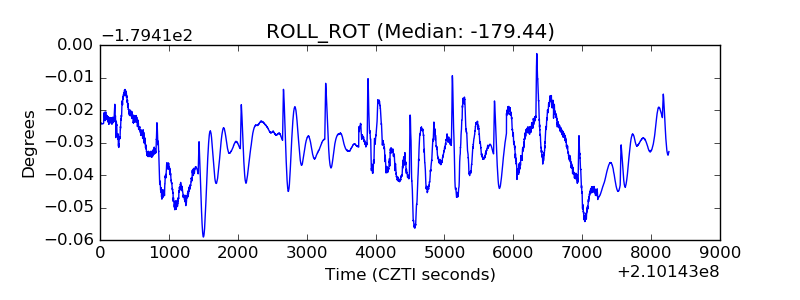 |
| _Roll_DEC | 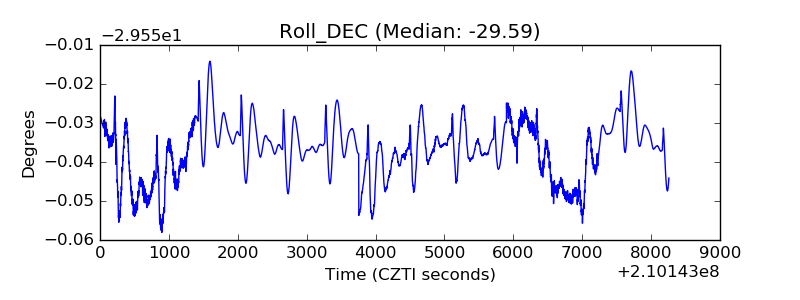 |
| _Roll_RA | 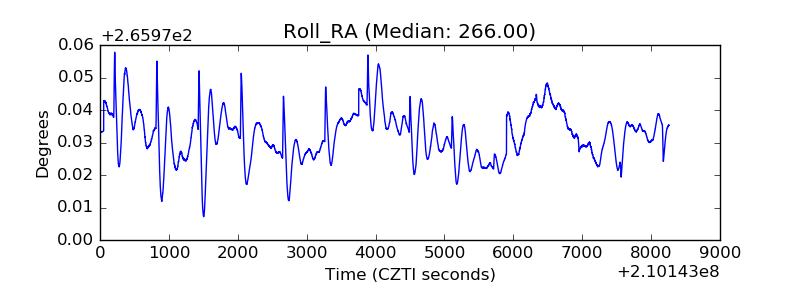 |
| Veto Counter | 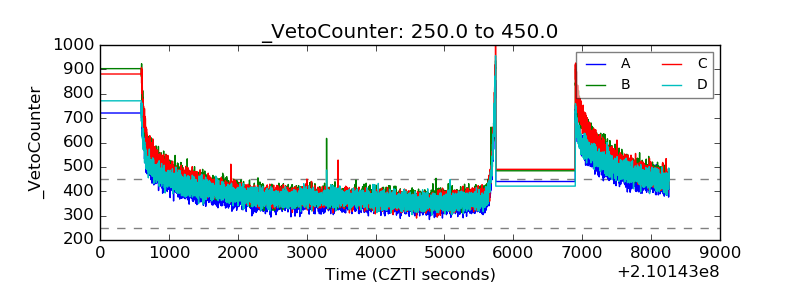 |