| Param | Original file | Final file |
|---|---|---|
| Filename | modeM0/AS1G05_158T01_9000000630_04977cztM0_level2.evt | modeM0/AS1G05_158T01_9000000630_04977cztM0_level2_quad_clean.evt |
| Size (bytes) | 470,482,560 | 74,039,040 |
| Size | 448.7 MB | 70.6 MB |
| Events in quadrant A | 3,628,622 | 444,549 |
| Events in quadrant B | 3,350,664 | 461,237 |
| Events in quadrant C | 3,086,384 | 460,143 |
| Events in quadrant D | 3,754,049 | 435,161 |
| Mode M9 | |||
|---|---|---|---|
| Quadrant | BADHDUFLAG | Total packets | Discarded packets |
| A | 0 | 20 | 0 |
| B | 0 | 20 | 0 |
| C | 0 | 20 | 0 |
| D | 0 | 21 | 0 |
| Mode M0 | |||
|---|---|---|---|
| Quadrant | BADHDUFLAG | Total packets | Discarded packets |
| A | 0 | 14766 | 3 |
| B | 0 | 13774 | 2 |
| C | 0 | 13285 | 2 |
| D | 0 | 15173 | 2 |
| Mode SS | |||
|---|---|---|---|
| Quadrant | BADHDUFLAG | Total packets | Discarded packets |
| A | 0 | 128 | 0 |
| B | 0 | 128 | 0 |
| C | 0 | 128 | 0 |
| D | 0 | 128 | 0 |
| Quadrant | Total seconds | Saturated seconds | Saturation percentage |
|---|---|---|---|
| A | 6315 | 268 | 4.243864% |
| B | 6315 | 79 | 1.250990% |
| C | 6315 | 69 | 1.092637% |
| D | 6315 | 155 | 2.454473% |
Noise dominated data is calculated using 1-second bins in cleaned event files. If a bin has >2000 counts, and if more than 50% of those come from <1% of pixels, then it is considered to be noise-dominated and hence unusable.
| Quadrant | # 1 sec bins | Bins with >0 counts | Bins with >2000 counts | High rate bins dominated by noise | Noise dominated (total time) | Noise dominated (detector-on time) | Marked lightcurve |
|---|---|---|---|---|---|---|---|
| A | 7540 | 6315 | 143 | 143 | 1.90% | 2.26% | 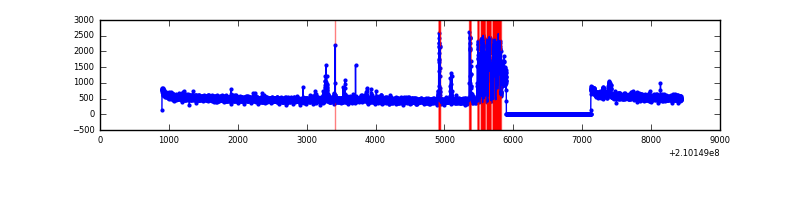 |
| B | 7540 | 6315 | 0 | 0 | 0.00% | 0.00% | 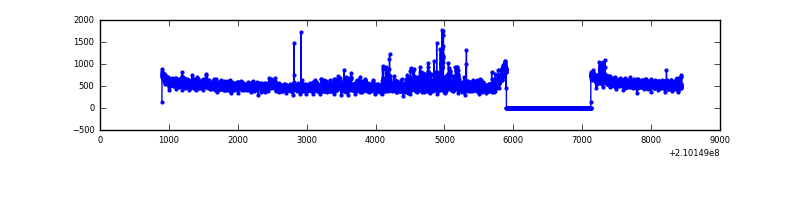 |
| C | 7540 | 6315 | 1 | 1 | 0.01% | 0.02% | 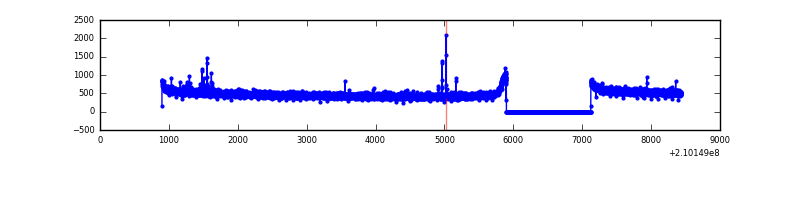 |
| D | 7539 | 6314 | 95 | 95 | 1.26% | 1.50% | 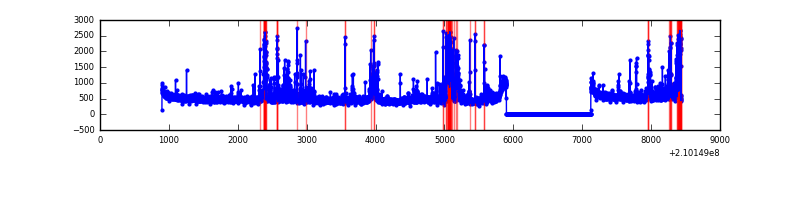 |
Top three noisy pixels from each quadrant. If the there are fewer than three noisy pixels in the level2.evt file, extra rows are filled as -1
| Pixel properties | Quadrant properties | ||||||
|---|---|---|---|---|---|---|---|
| Quadrant | DetID | PixID | Counts | Sigma | Mean | Median | Sigma |
| A | 0 | 50 | 528114 | 3277.43 | 798 | 785 | 160.9 |
| A | 15 | 234 | 23655 | 142.14 | 798 | 785 | 160.9 |
| A | 0 | 226 | 7955 | 44.56 | 798 | 785 | 160.9 |
| B | 15 | 204 | 116538 | 757.02 | 813 | 795 | 152.9 |
| B | 0 | 219 | 78471 | 508.04 | 813 | 795 | 152.9 |
| B | 0 | 183 | 16249 | 101.08 | 813 | 795 | 152.9 |
| C | 12 | 4 | 15137 | 79.68 | 784 | 789 | 180.1 |
| C | 9 | 54 | 10872 | 56.0 | 784 | 789 | 180.1 |
| C | 13 | 61 | 6304 | 30.63 | 784 | 789 | 180.1 |
| D | 12 | 233 | 162598 | 856.01 | 780 | 758 | 189.1 |
| D | 1 | 7 | 150864 | 793.95 | 780 | 758 | 189.1 |
| D | 2 | 136 | 86056 | 451.16 | 780 | 758 | 189.1 |
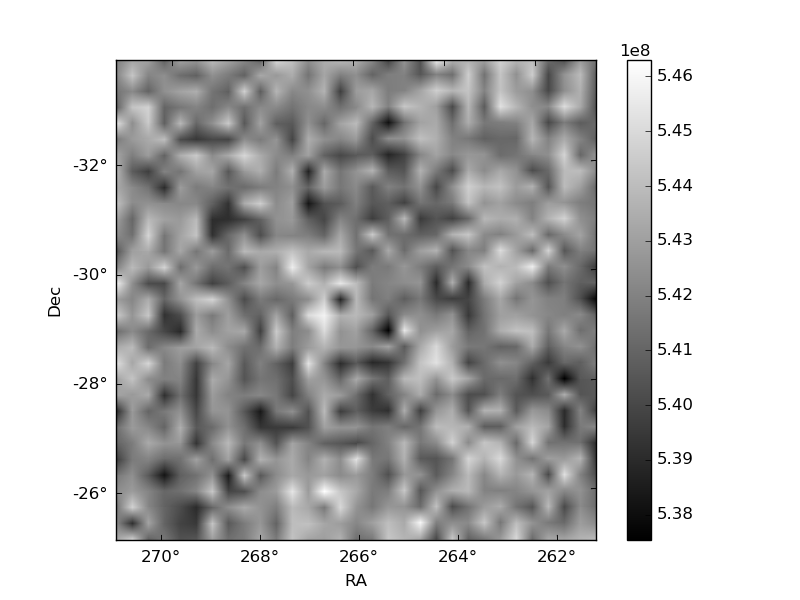
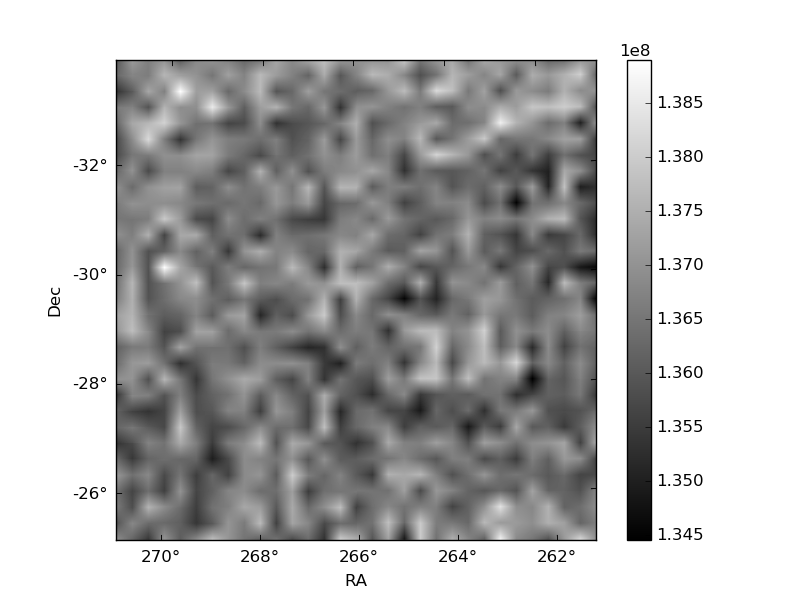
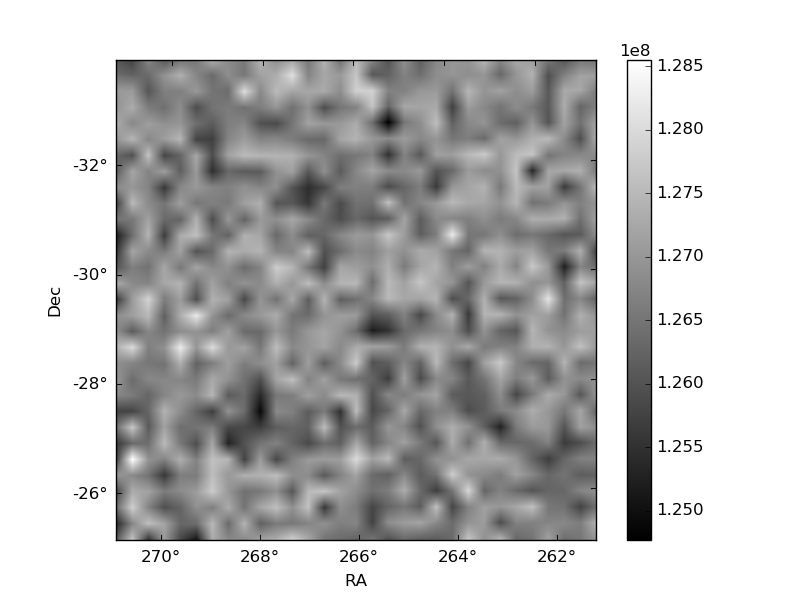
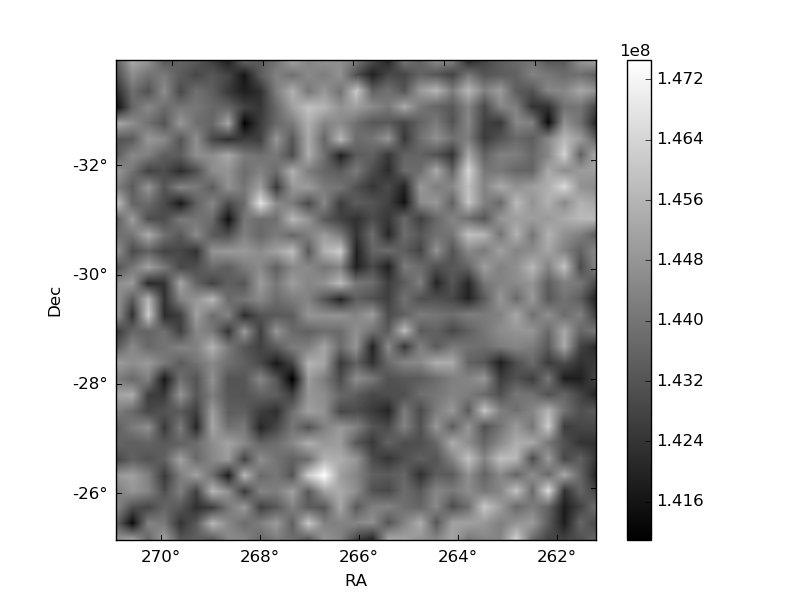
Histogram calculated using DETX and DETY for each event in the final _common_clean file
| Quadrant A | 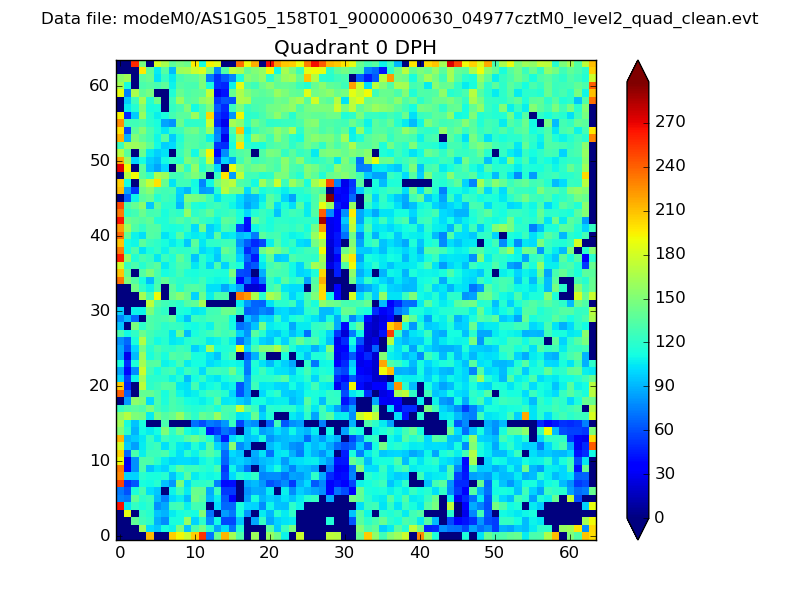 |
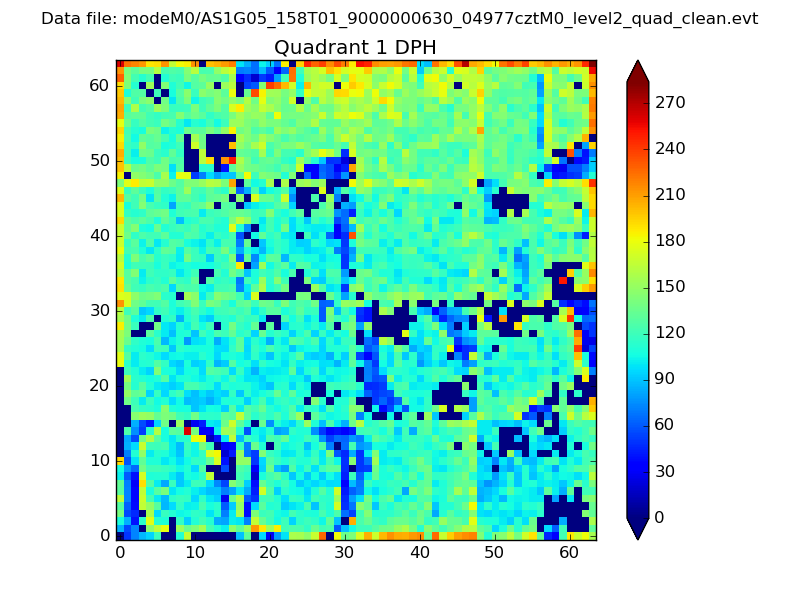 |
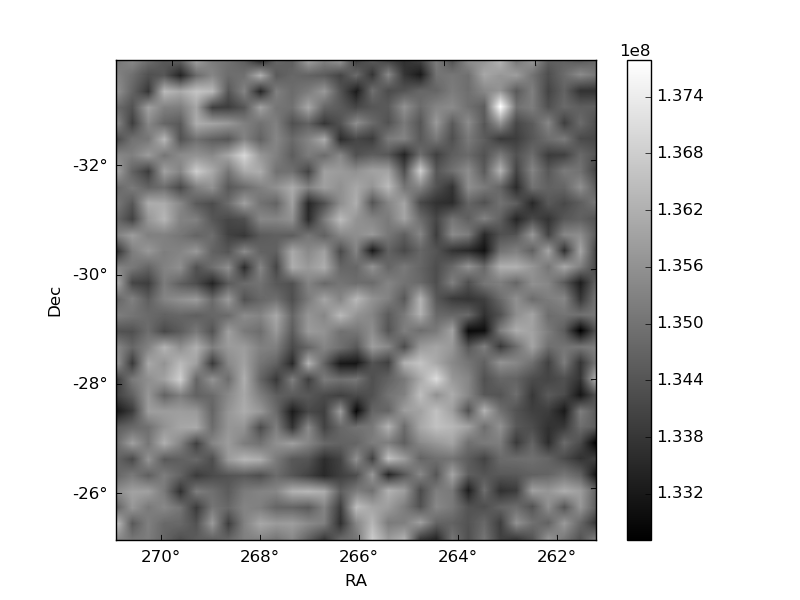
Quadrant B |
|---|---|---|---|
| Quadrant D | 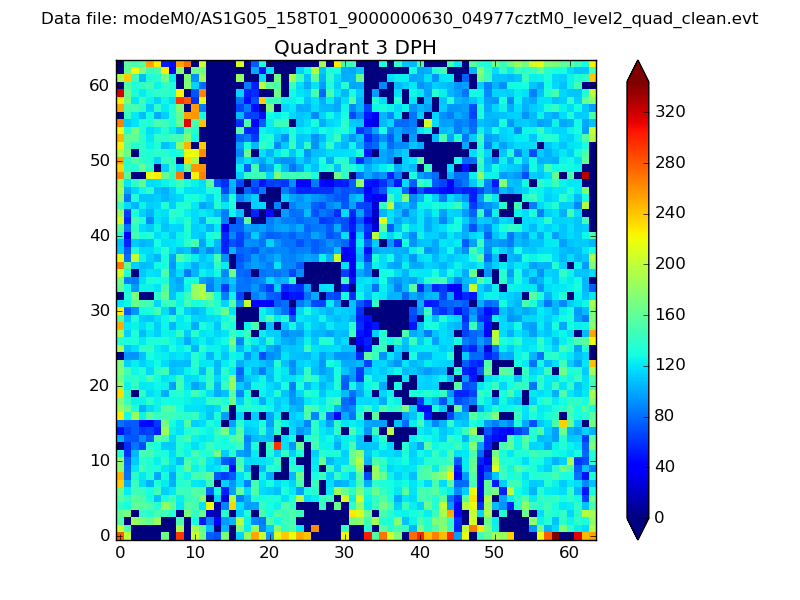 |
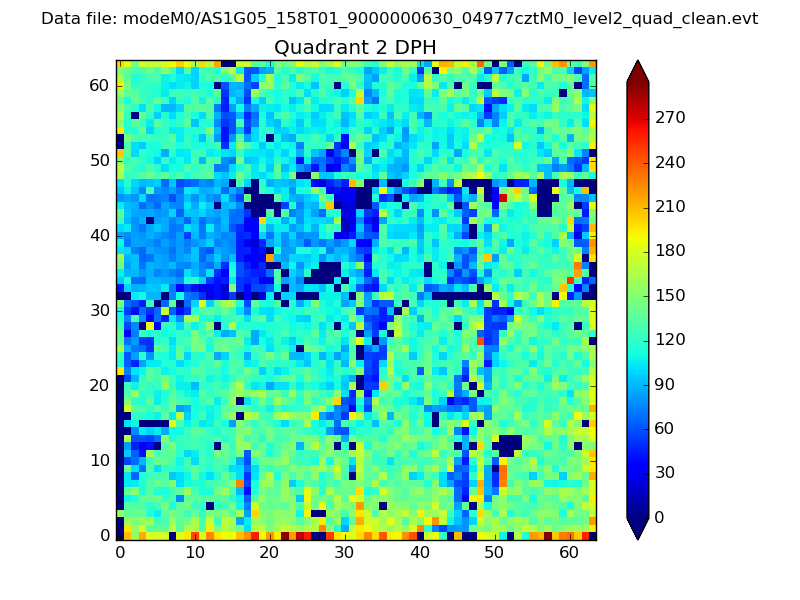 |
Quadrant C |
| Plot type | Count rate plots | Images |
|---|---|---|
| Comparison with Poisson distribution Blue bars denote a histogram of data divided into 1 sec bins. Red curve is a Poisson curve with rate = median count rate of data. |
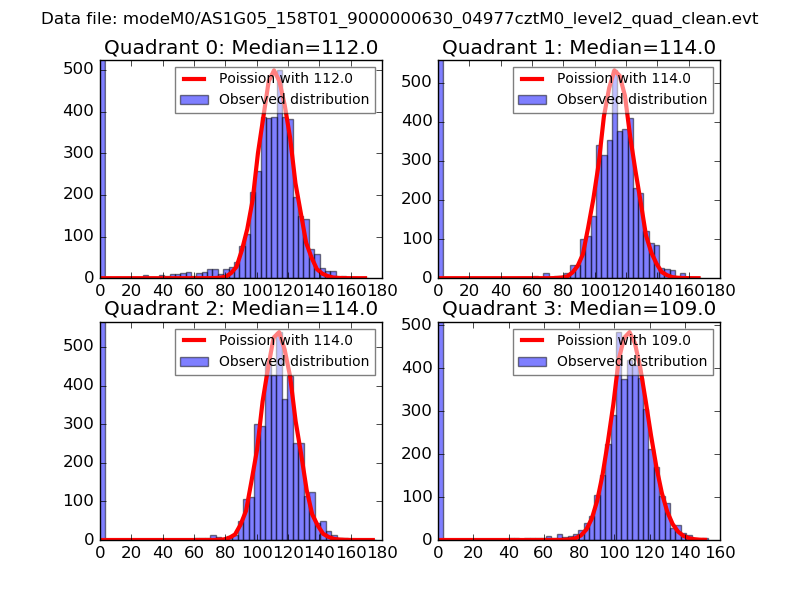 |
 |
| Quadrant-wise count rates Data is divided into 100 sec bins |
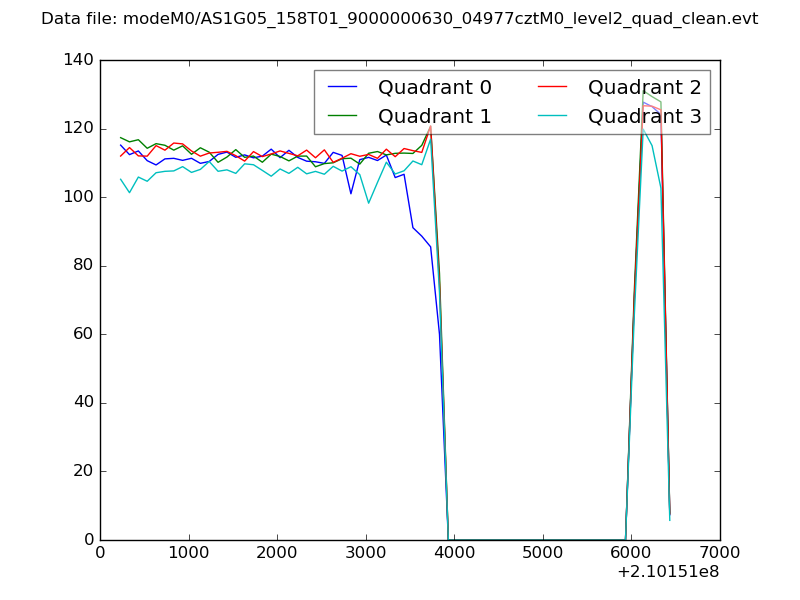 |
|
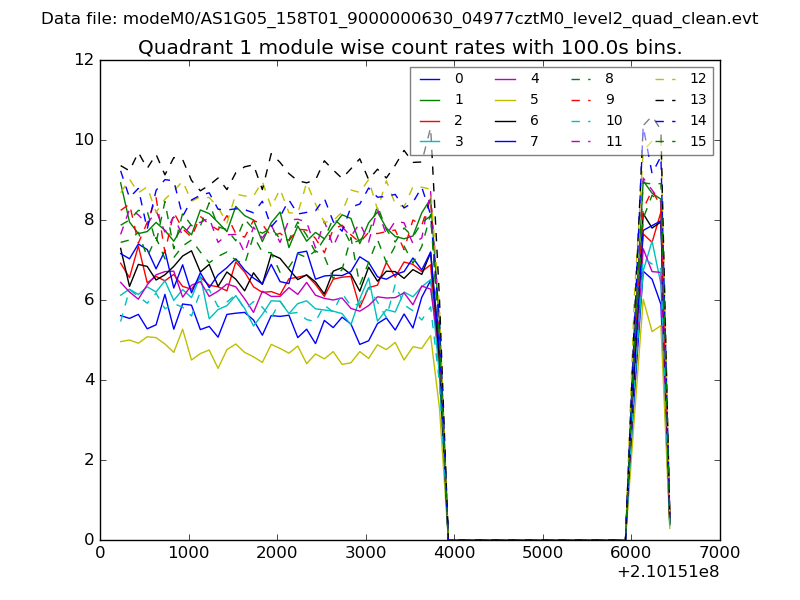
| Module-wise count rates for Quadrant A Data is divided into 100 sec bins |
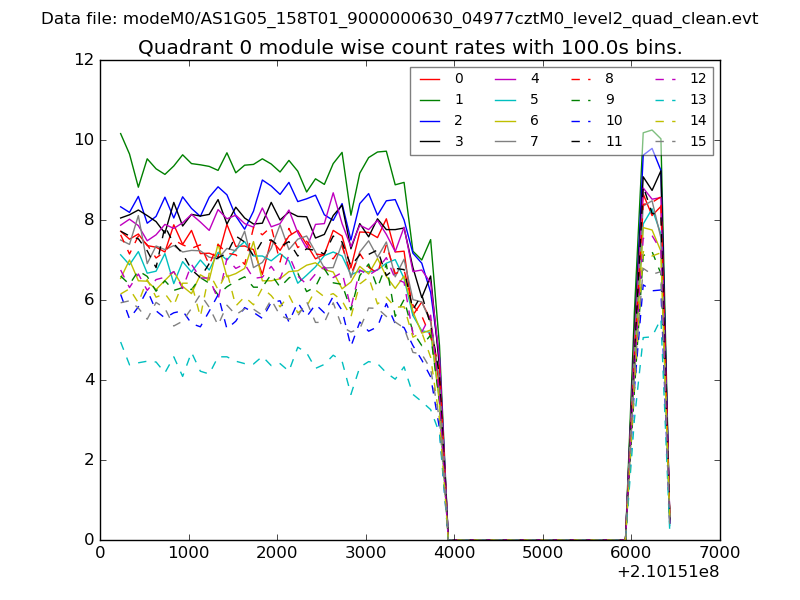 |
 |
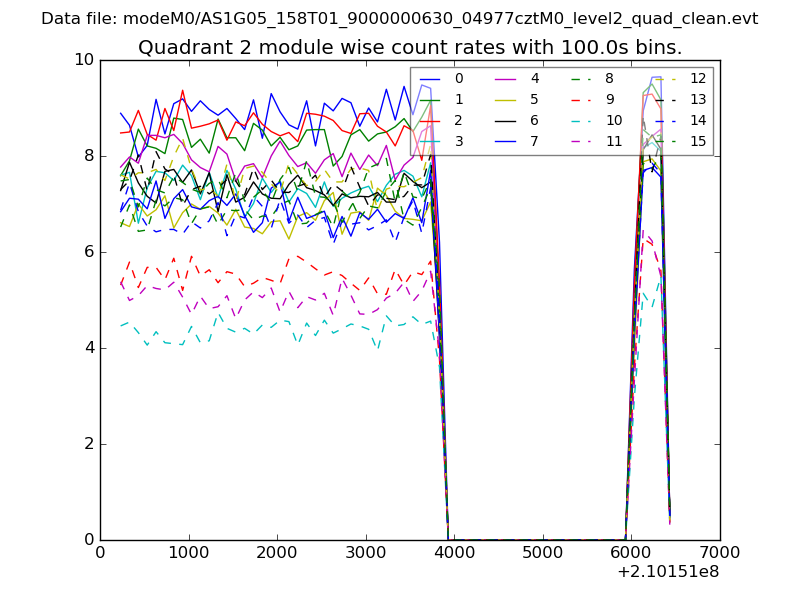
| Module-wise count rates for Quadrant B Data is divided into 100 sec bins |
 |
 |
| Module-wise count rates for Quadrant C Data is divided into 100 sec bins |
 |
 |
| Module-wise count rates for Quadrant D Data is divided into 100 sec bins |
 |
 |
| Parameter | Plot |
|---|---|
| CZT HV Monitor | 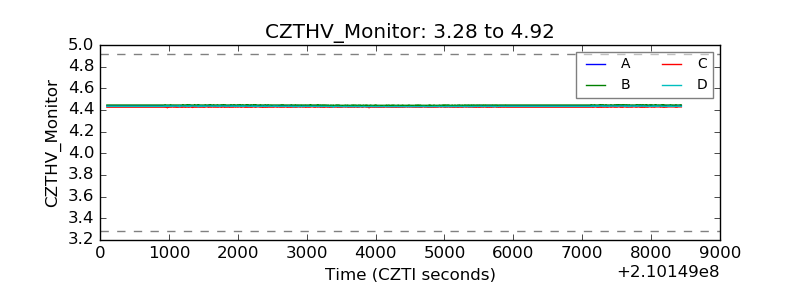 |
| D_VDD | 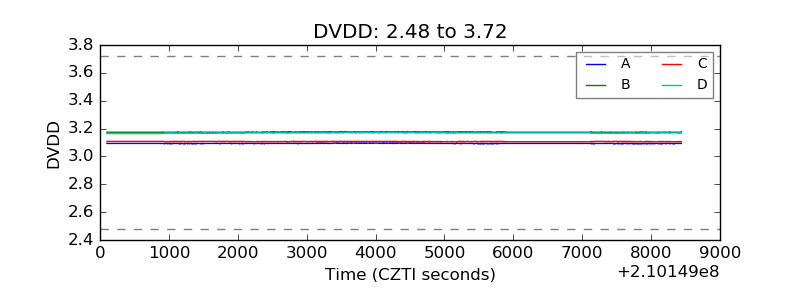 |
| Temperature 1 | 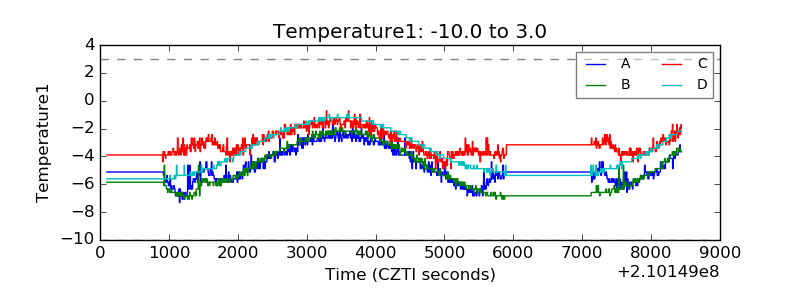 |
| Veto HV Monitor | 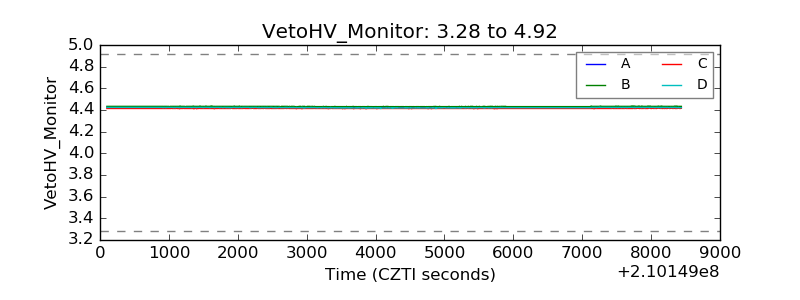 |
| Veto LLD | 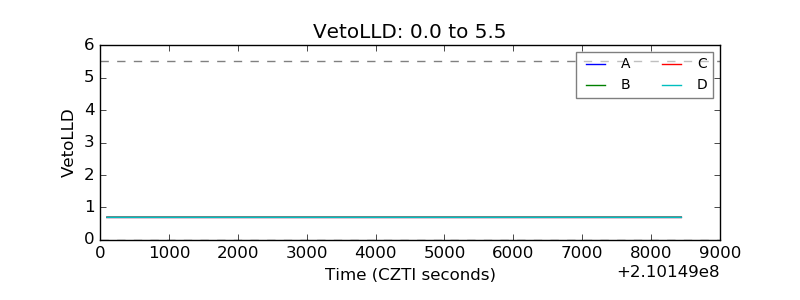 |
| Alpha Counter | 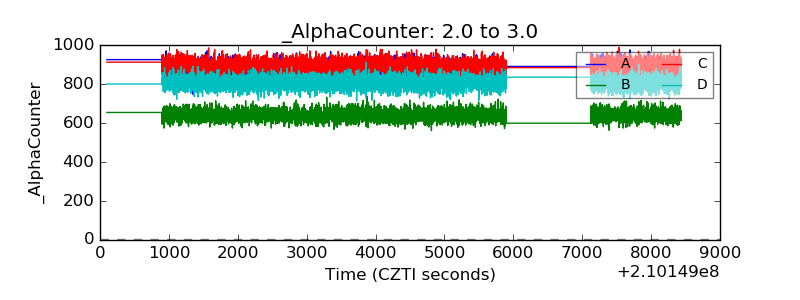 |
| _CPM_Rate | 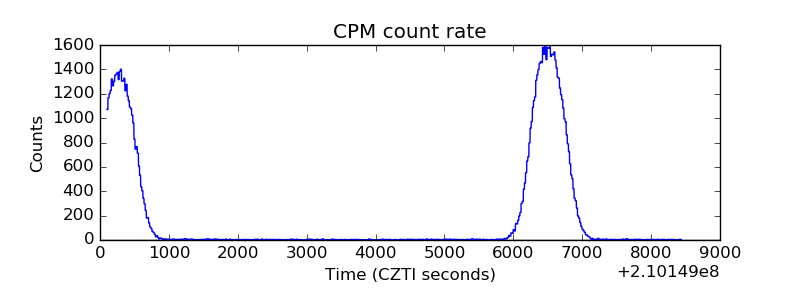 |
| CZT Counter | 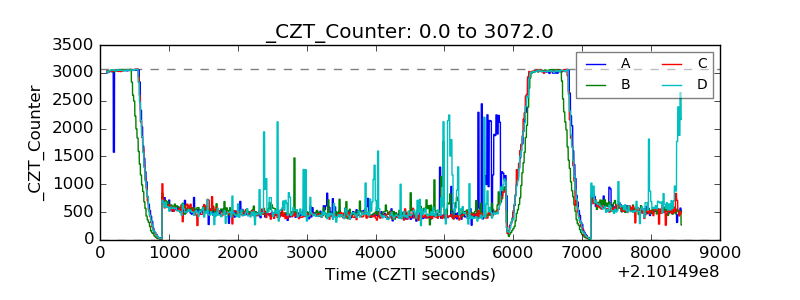 |
| +2.5 Volts monitor |  |
| +5 Volts monitor |  |
| _ROLL_ROT | 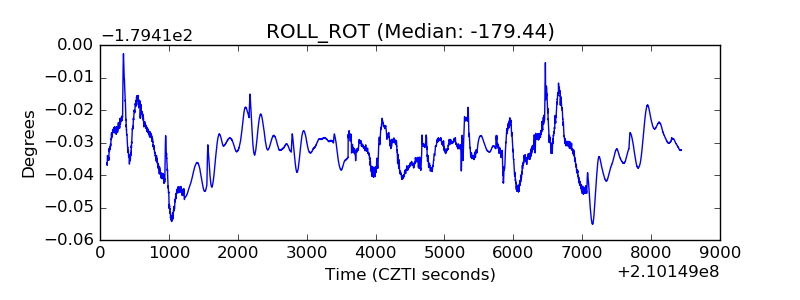 |
| _Roll_DEC | 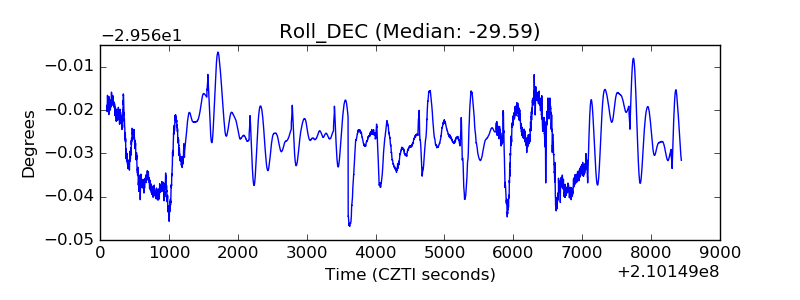 |
| _Roll_RA | 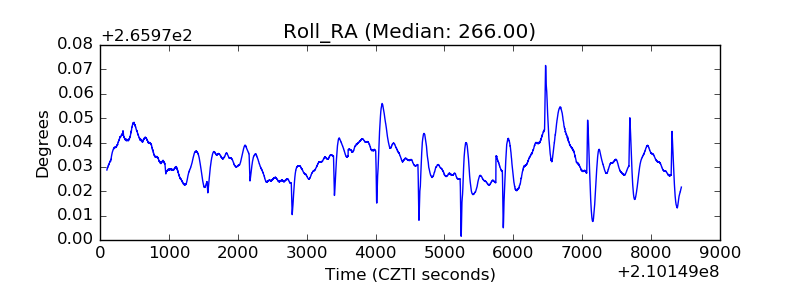 |
| Veto Counter | 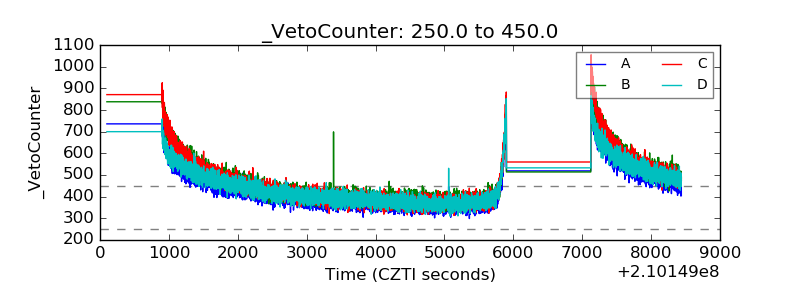 |