| Param | Original file | Final file |
|---|---|---|
| Filename | modeM0/AS1G05_158T01_9000000630_04980cztM0_level2.evt | modeM0/AS1G05_158T01_9000000630_04980cztM0_level2_quad_clean.evt |
| Size (bytes) | 538,378,560 | 88,796,160 |
| Size | 513.4 MB | 84.7 MB |
| Events in quadrant A | 3,028,907 | 594,650 |
| Events in quadrant B | 3,962,235 | 583,821 |
| Events in quadrant C | 3,008,499 | 590,818 |
| Events in quadrant D | 5,881,544 | 483,722 |
| Mode M9 | |||
|---|---|---|---|
| Quadrant | BADHDUFLAG | Total packets | Discarded packets |
| A | 0 | 12 | 0 |
| B | 0 | 12 | 0 |
| C | 0 | 12 | 0 |
| D | 0 | 12 | 0 |
| Mode M0 | |||
|---|---|---|---|
| Quadrant | BADHDUFLAG | Total packets | Discarded packets |
| A | 0 | 13044 | 2 |
| B | 0 | 15789 | 1 |
| C | 0 | 13154 | 1 |
| D | 0 | 21760 | 1 |
| Mode SS | |||
|---|---|---|---|
| Quadrant | BADHDUFLAG | Total packets | Discarded packets |
| A | 0 | 126 | 0 |
| B | 0 | 126 | 0 |
| C | 0 | 126 | 0 |
| D | 0 | 126 | 0 |
| Quadrant | Total seconds | Saturated seconds | Saturation percentage |
|---|---|---|---|
| A | 6242 | 147 | 2.355014% |
| B | 6242 | 314 | 5.030439% |
| C | 6242 | 113 | 1.810317% |
| D | 6242 | 1211 | 19.400833% |
Noise dominated data is calculated using 1-second bins in cleaned event files. If a bin has >2000 counts, and if more than 50% of those come from <1% of pixels, then it is considered to be noise-dominated and hence unusable.
| Quadrant | # 1 sec bins | Bins with >0 counts | Bins with >2000 counts | High rate bins dominated by noise | Noise dominated (total time) | Noise dominated (detector-on time) | Marked lightcurve |
|---|---|---|---|---|---|---|---|
| A | 7412 | 6242 | 0 | 0 | 0.00% | 0.00% | 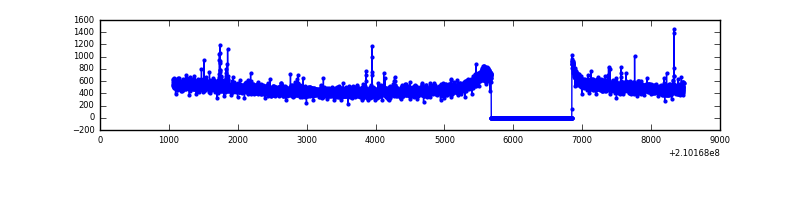 |
| B | 7412 | 6242 | 150 | 150 | 2.02% | 2.40% | 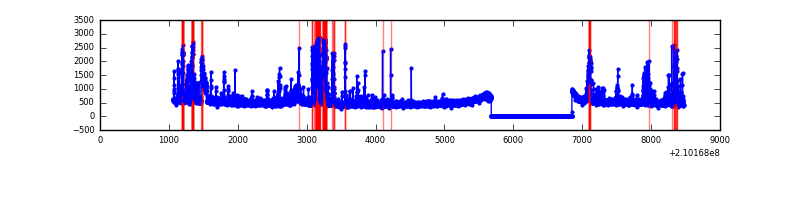 |
| C | 7412 | 6242 | 9 | 9 | 0.12% | 0.14% | 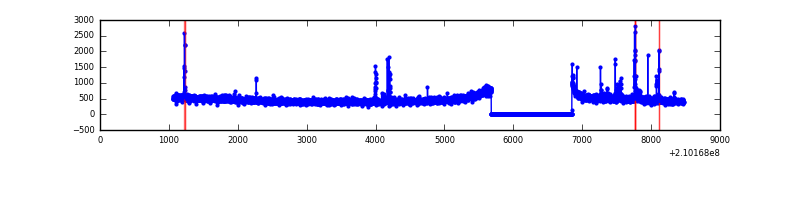 |
| D | 7411 | 6241 | 1041 | 1041 | 14.05% | 16.68% | 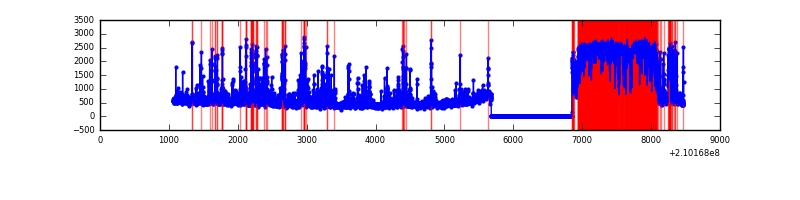 |
Top three noisy pixels from each quadrant. If the there are fewer than three noisy pixels in the level2.evt file, extra rows are filled as -1
| Pixel properties | Quadrant properties | ||||||
|---|---|---|---|---|---|---|---|
| Quadrant | DetID | PixID | Counts | Sigma | Mean | Median | Sigma |
| A | 0 | 50 | 17882 | 108.31 | 778 | 763 | 158.1 |
| A | 12 | 194 | 8028 | 45.96 | 778 | 763 | 158.1 |
| A | 0 | 226 | 7830 | 44.71 | 778 | 763 | 158.1 |
| B | 14 | 167 | 547020 | 3727.63 | 770 | 753 | 146.5 |
| B | 0 | 219 | 260530 | 1772.67 | 770 | 753 | 146.5 |
| B | 4 | 239 | 69764 | 470.92 | 770 | 753 | 146.5 |
| C | 1 | 16 | 94656 | 545.25 | 745 | 749 | 172.2 |
| C | 9 | 54 | 6956 | 36.04 | 745 | 749 | 172.2 |
| C | 13 | 61 | 6245 | 31.91 | 745 | 749 | 172.2 |
| D | 4 | 95 | 2622984 | 15945.32 | 668 | 649 | 164.5 |
| D | 13 | 235 | 206781 | 1253.4 | 668 | 649 | 164.5 |
| D | 2 | 136 | 131771 | 797.3 | 668 | 649 | 164.5 |
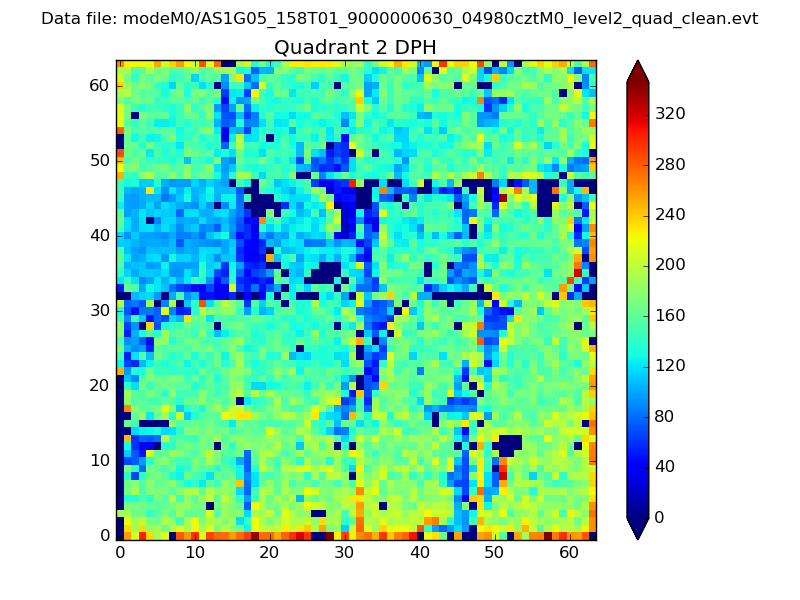
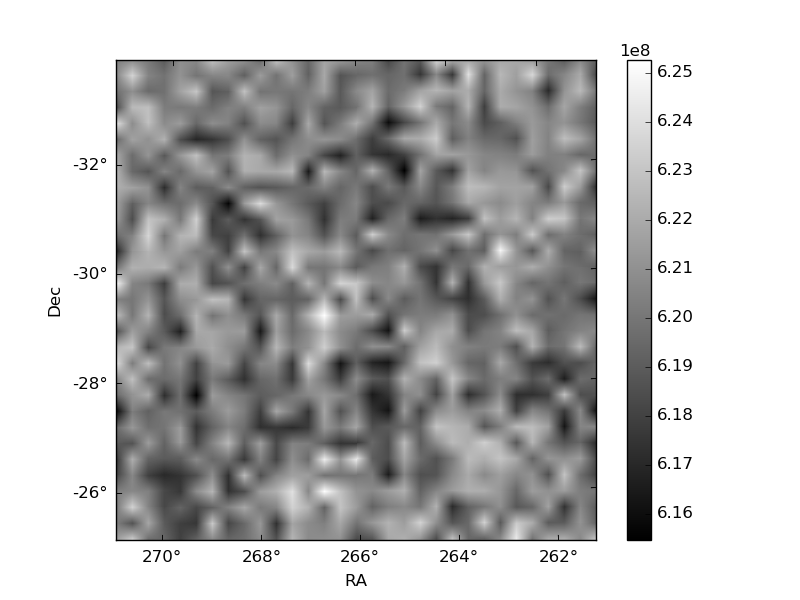
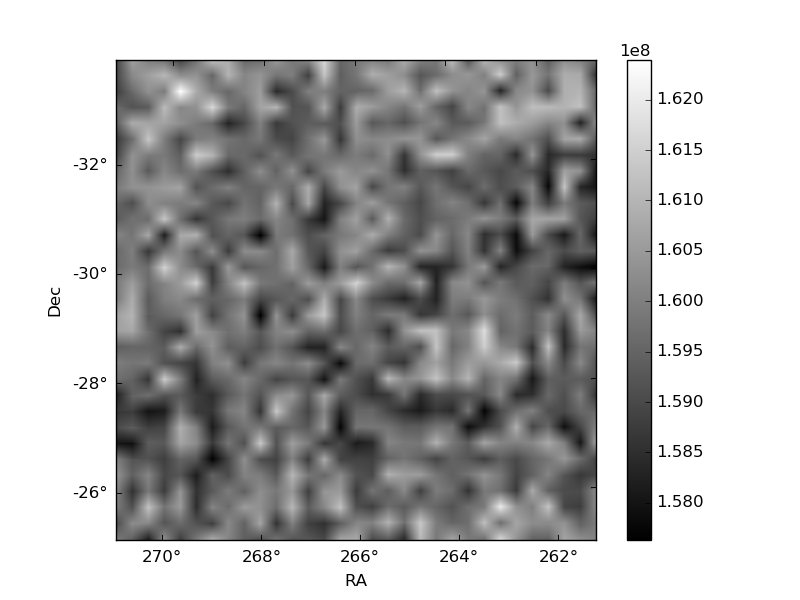
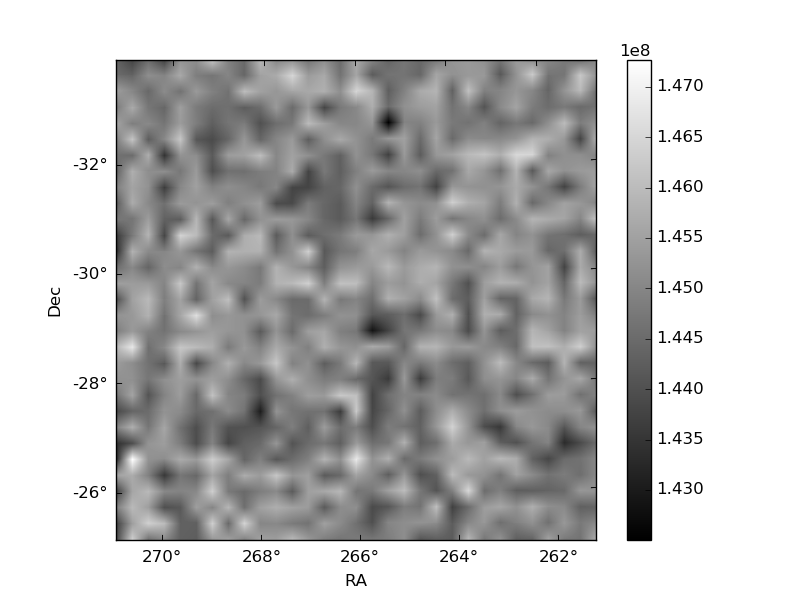
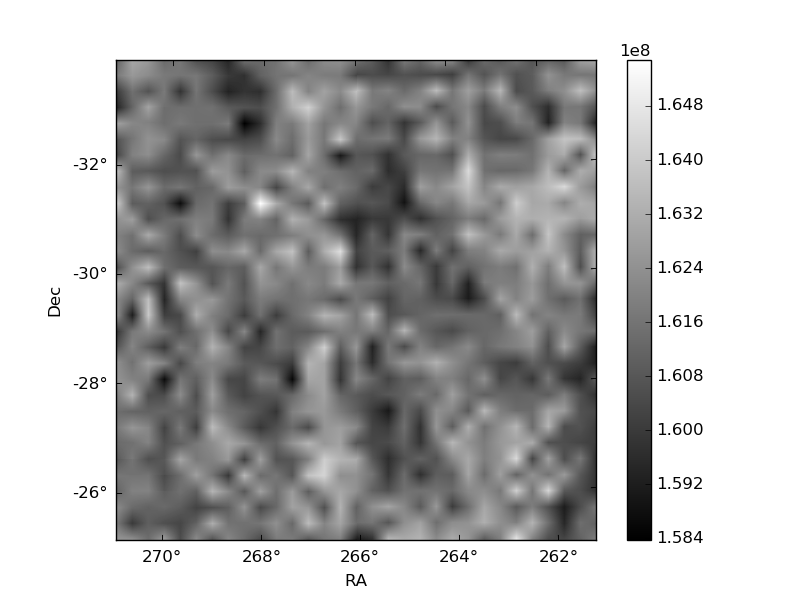
Histogram calculated using DETX and DETY for each event in the final _common_clean file
| Quadrant A | 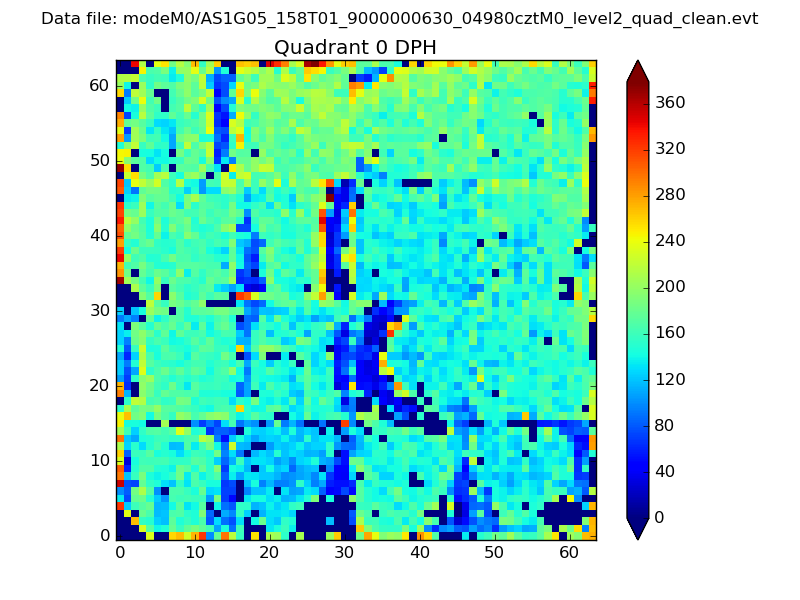 |
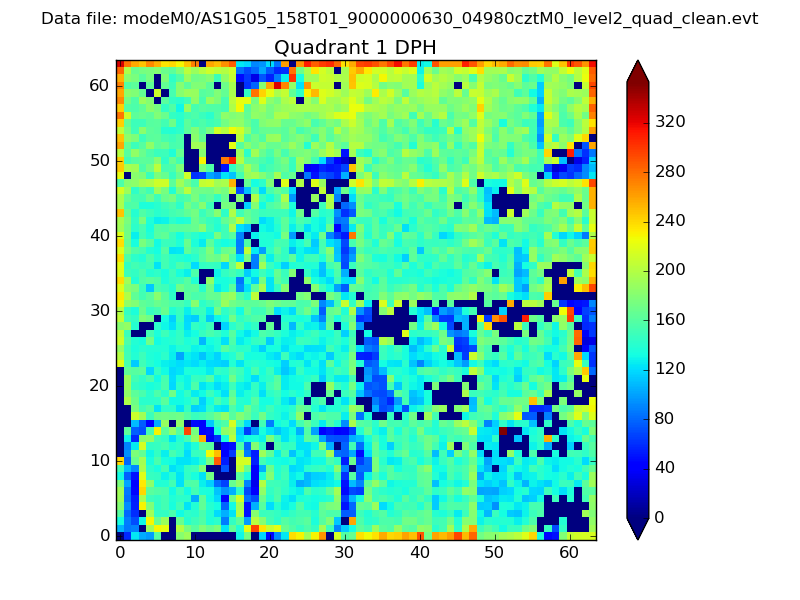 |
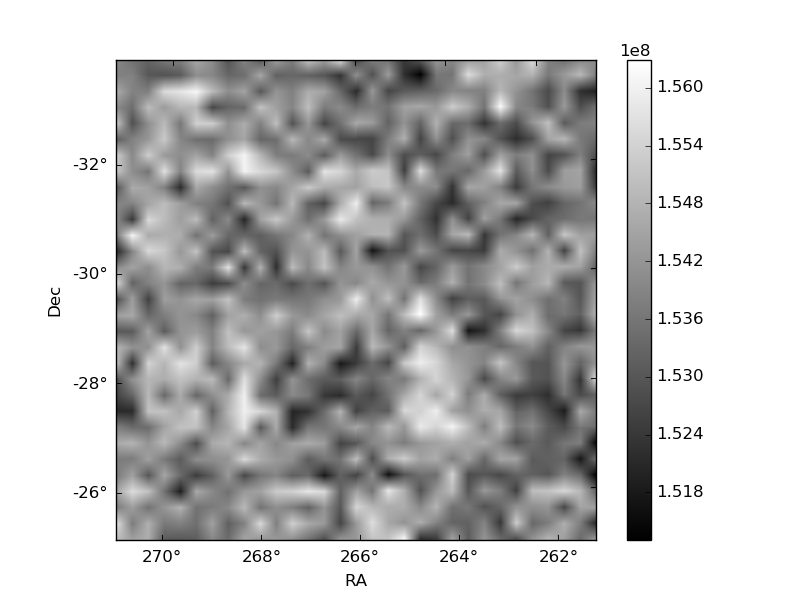
Quadrant B |
|---|---|---|---|
| Quadrant D | 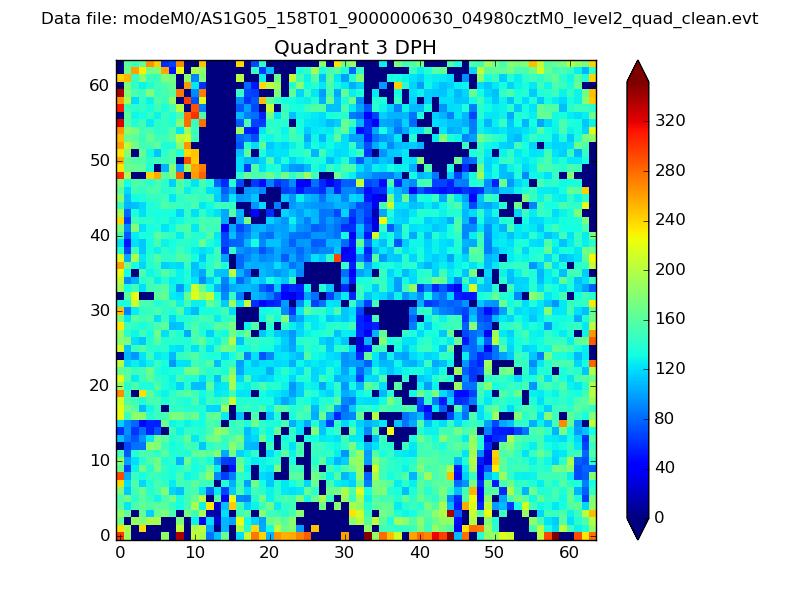 |
 |
Quadrant C |
| Plot type | Count rate plots | Images |
|---|---|---|
| Comparison with Poisson distribution Blue bars denote a histogram of data divided into 1 sec bins. Red curve is a Poisson curve with rate = median count rate of data. |
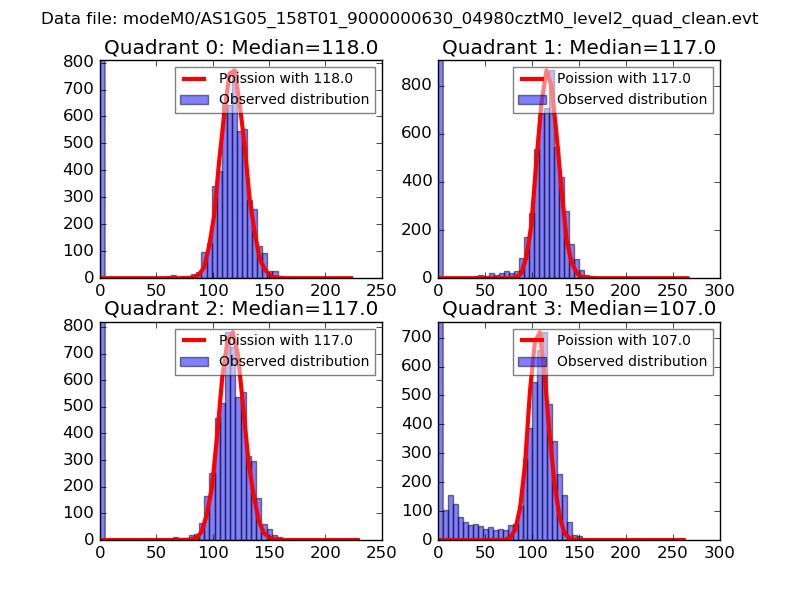 |
 |
| Quadrant-wise count rates Data is divided into 100 sec bins |
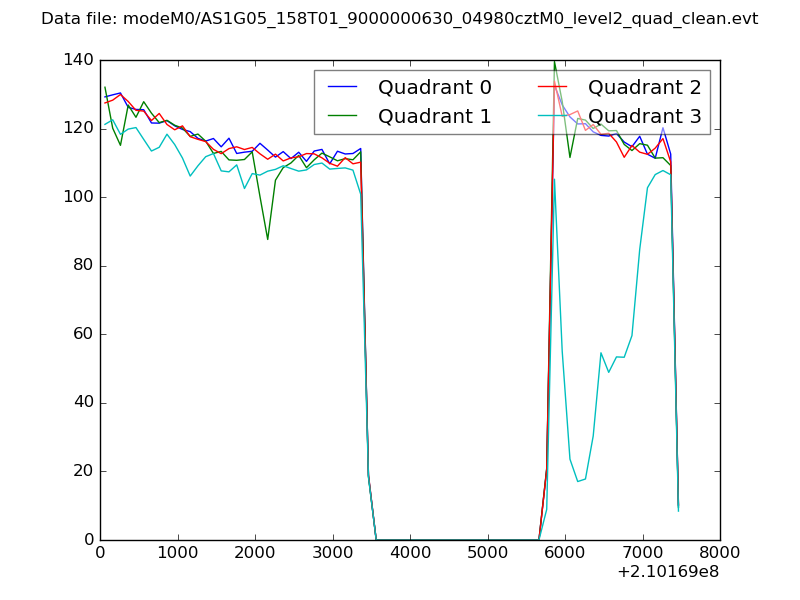 |
|
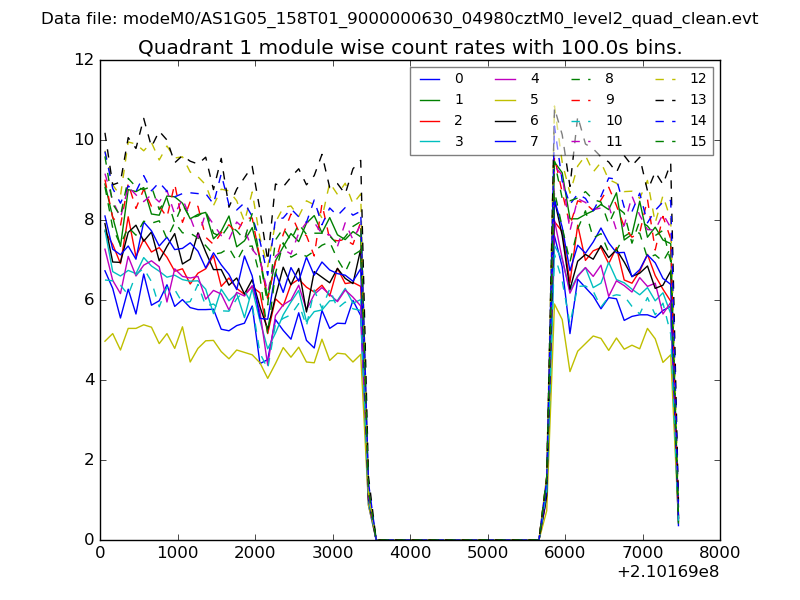
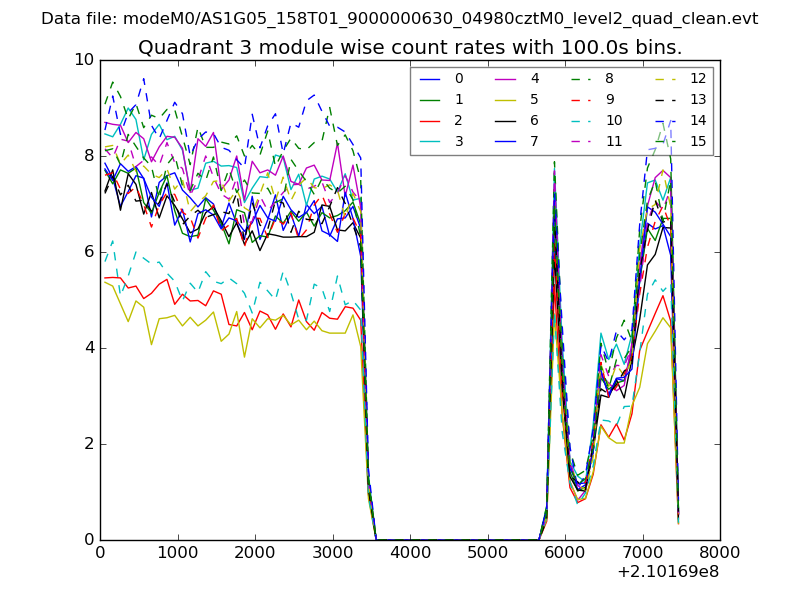
| Module-wise count rates for Quadrant A Data is divided into 100 sec bins |
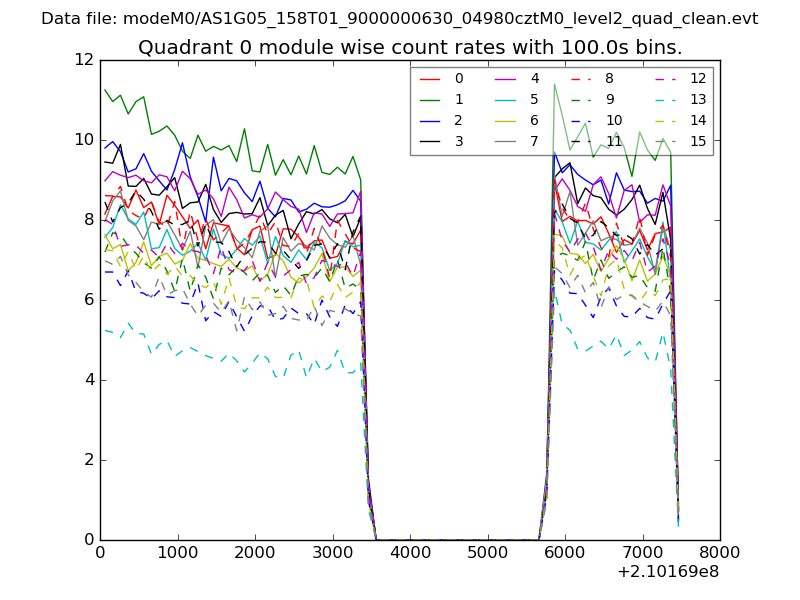 |
 |
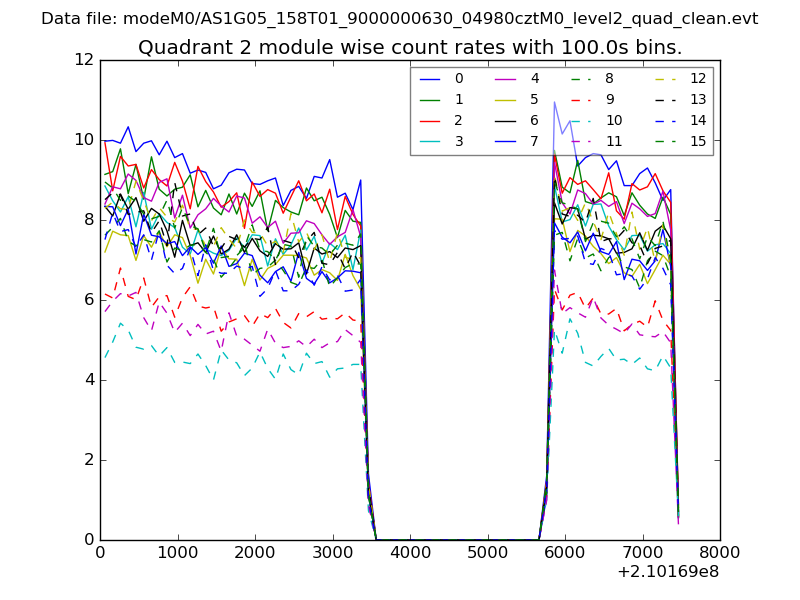
| Module-wise count rates for Quadrant B Data is divided into 100 sec bins |
 |
 |
| Module-wise count rates for Quadrant C Data is divided into 100 sec bins |
 |
 |
| Module-wise count rates for Quadrant D Data is divided into 100 sec bins |
 |
 |
| Parameter | Plot |
|---|---|
| CZT HV Monitor | 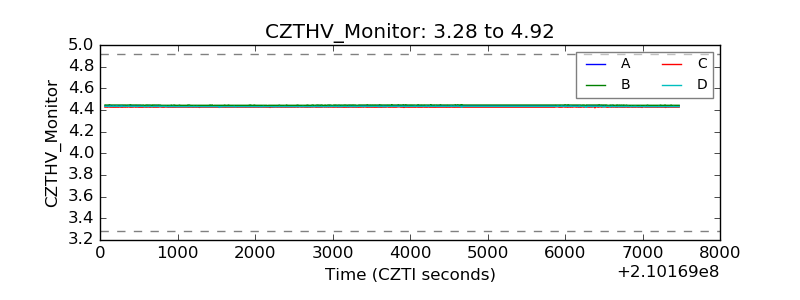 |
| D_VDD | 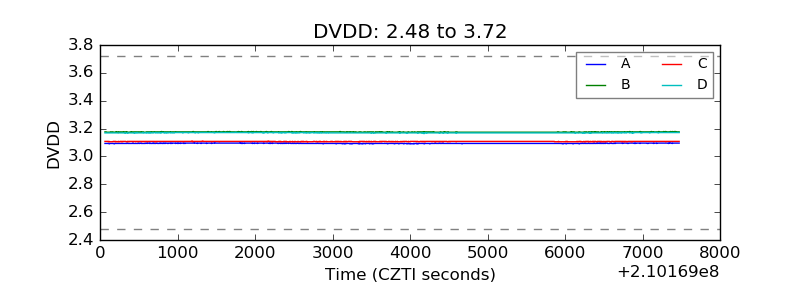 |
| Temperature 1 | 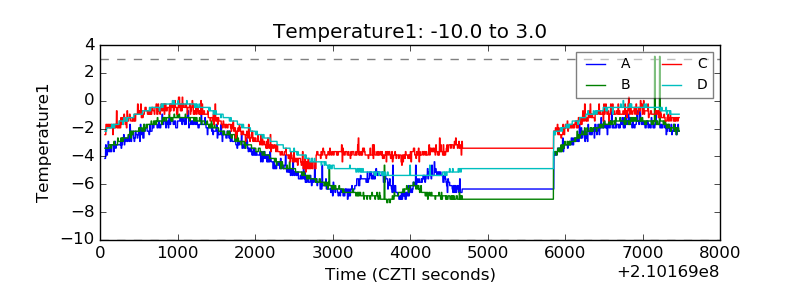 |
| Veto HV Monitor | 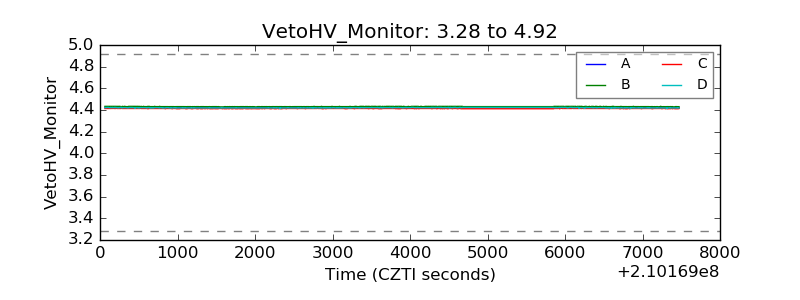 |
| Veto LLD | 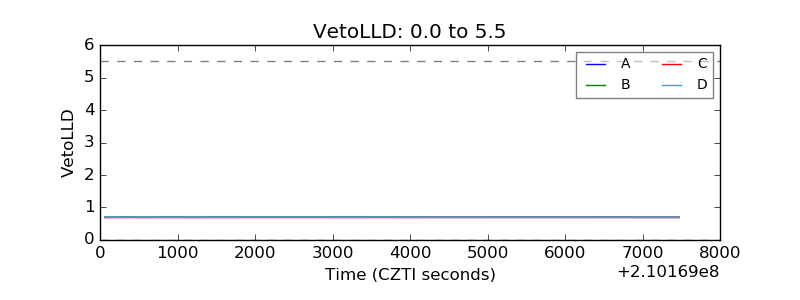 |
| Alpha Counter | 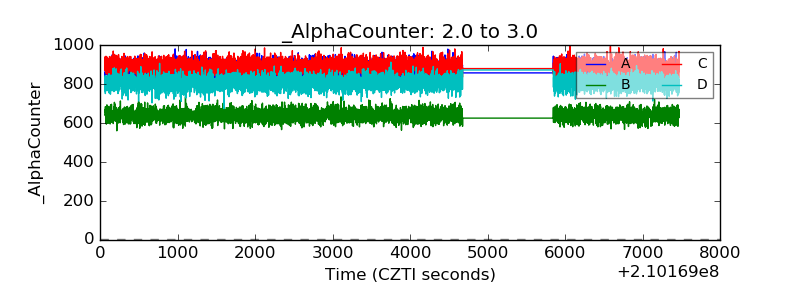 |
| _CPM_Rate | 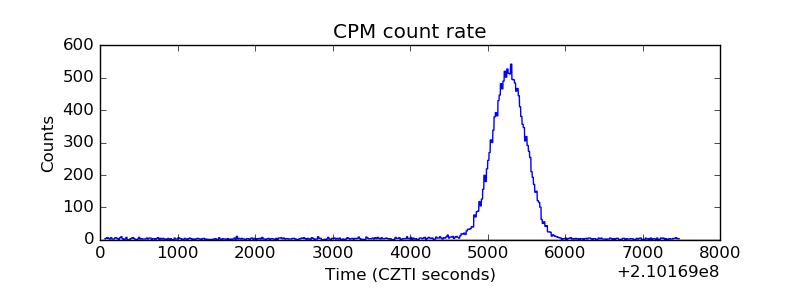 |
| CZT Counter | 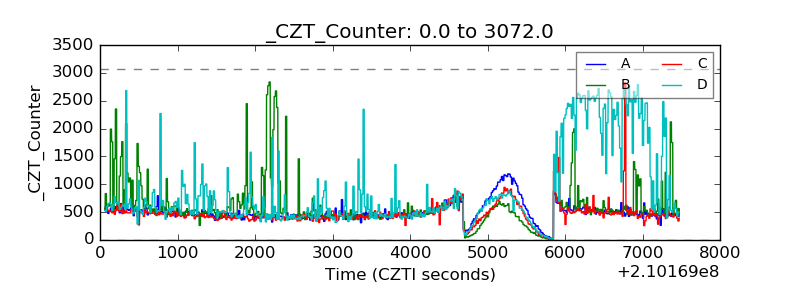 |
| +2.5 Volts monitor |  |
| +5 Volts monitor |  |
| _ROLL_ROT | 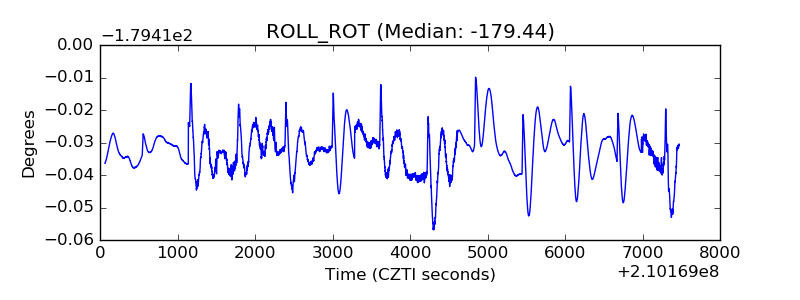 |
| _Roll_DEC | 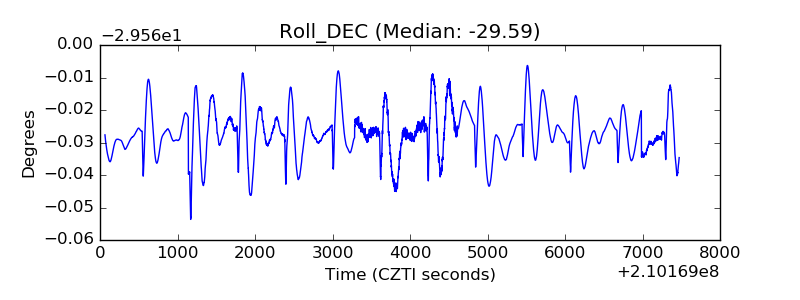 |
| _Roll_RA | 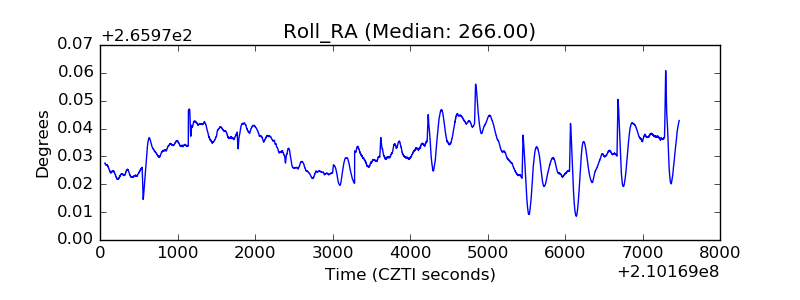 |
| Veto Counter | 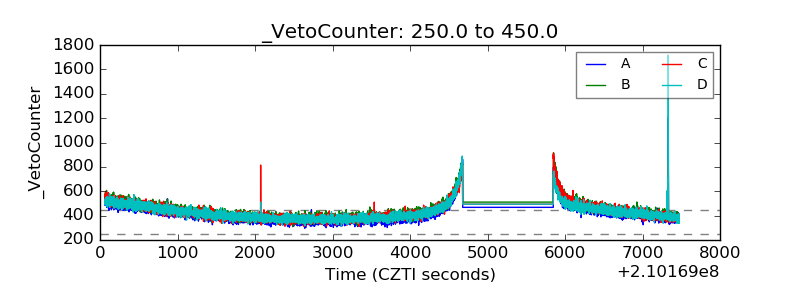 |