| Param | Original file | Final file |
|---|---|---|
| Filename | modeM0/AS1G05_158T01_9000000630_04981cztM0_level2.evt | modeM0/AS1G05_158T01_9000000630_04981cztM0_level2_quad_clean.evt |
| Size (bytes) | 251,078,400 | 36,866,880 |
| Size | 239.4 MB | 35.2 MB |
| Events in quadrant A | 1,051,454 | 260,179 |
| Events in quadrant B | 1,327,839 | 256,521 |
| Events in quadrant C | 1,044,557 | 258,040 |
| Events in quadrant D | 4,022,022 | 174,876 |
| Mode M0 | |||
|---|---|---|---|
| Quadrant | BADHDUFLAG | Total packets | Discarded packets |
| A | 0 | 4665 | 2 |
| B | 0 | 5406 | 4 |
| C | 0 | 4779 | 0 |
| D | 0 | 13509 | 21 |
| Mode SS | |||
|---|---|---|---|
| Quadrant | BADHDUFLAG | Total packets | Discarded packets |
| A | 0 | 46 | 0 |
| B | 0 | 46 | 0 |
| C | 0 | 46 | 0 |
| D | 0 | 46 | 0 |
| Quadrant | Total seconds | Saturated seconds | Saturation percentage |
|---|---|---|---|
| A | 2300 | 4 | 0.173913% |
| B | 2299 | 17 | 0.739452% |
| C | 2301 | 7 | 0.304216% |
| D | 2298 | 1095 | 47.650131% |
Noise dominated data is calculated using 1-second bins in cleaned event files. If a bin has >2000 counts, and if more than 50% of those come from <1% of pixels, then it is considered to be noise-dominated and hence unusable.
| Quadrant | # 1 sec bins | Bins with >0 counts | Bins with >2000 counts | High rate bins dominated by noise | Noise dominated (total time) | Noise dominated (detector-on time) | Marked lightcurve |
|---|---|---|---|---|---|---|---|
| A | 2301 | 2301 | 0 | 0 | 0.00% | 0.00% | 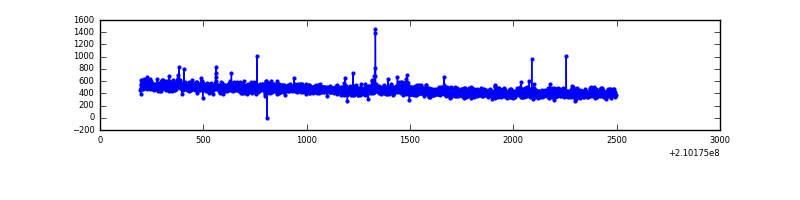 |
| B | 2301 | 2300 | 17 | 17 | 0.74% | 0.74% | 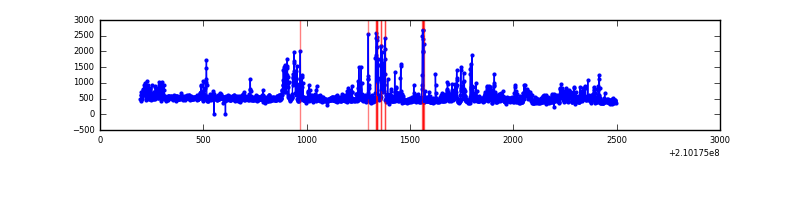 |
| C | 2301 | 2301 | 6 | 6 | 0.26% | 0.26% | 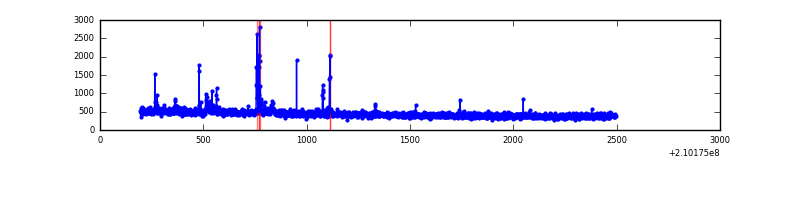 |
| D | 2301 | 2298 | 1166 | 1166 | 50.67% | 50.74% | 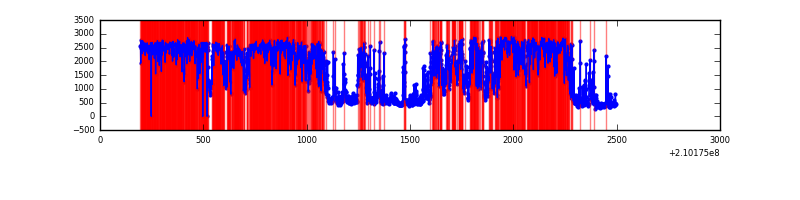 |
Top three noisy pixels from each quadrant. If the there are fewer than three noisy pixels in the level2.evt file, extra rows are filled as -1
| Pixel properties | Quadrant properties | ||||||
|---|---|---|---|---|---|---|---|
| Quadrant | DetID | PixID | Counts | Sigma | Mean | Median | Sigma |
| A | 0 | 31 | 12067 | 208.86 | 269 | 264 | 56.5 |
| A | 12 | 194 | 2802 | 44.91 | 269 | 264 | 56.5 |
| A | 0 | 226 | 2741 | 43.83 | 269 | 264 | 56.5 |
| B | 14 | 167 | 172233 | 3277.66 | 266 | 260 | 52.5 |
| B | 0 | 219 | 91781 | 1744.31 | 266 | 260 | 52.5 |
| B | 0 | 183 | 15253 | 285.75 | 266 | 260 | 52.5 |
| C | 1 | 16 | 55123 | 910.57 | 253 | 256 | 60.3 |
| C | 13 | 61 | 2095 | 30.52 | 253 | 256 | 60.3 |
| C | 3 | 202 | 604 | 5.78 | 253 | 256 | 60.3 |
| D | 4 | 95 | 3045950 | 62751.54 | 190 | 183 | 48.5 |
| D | 13 | 235 | 68240 | 1402.17 | 190 | 183 | 48.5 |
| D | 2 | 33 | 56841 | 1167.32 | 190 | 183 | 48.5 |
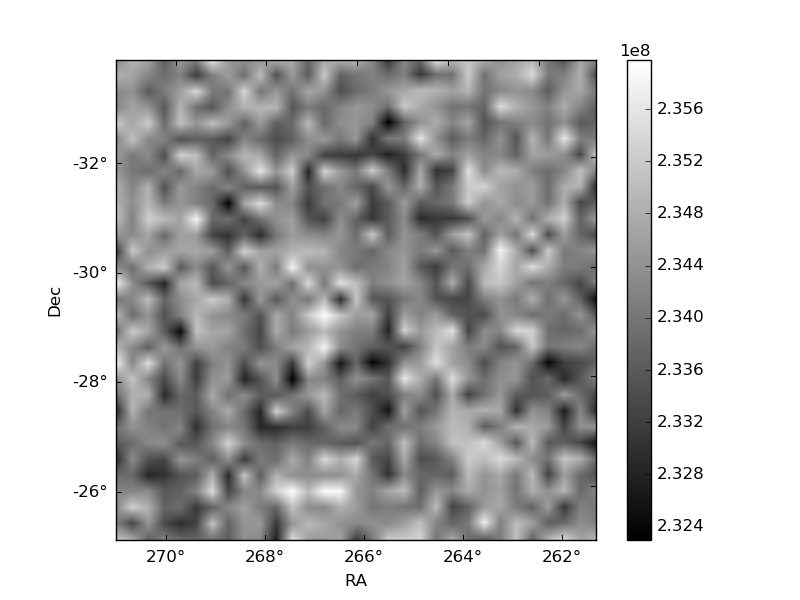
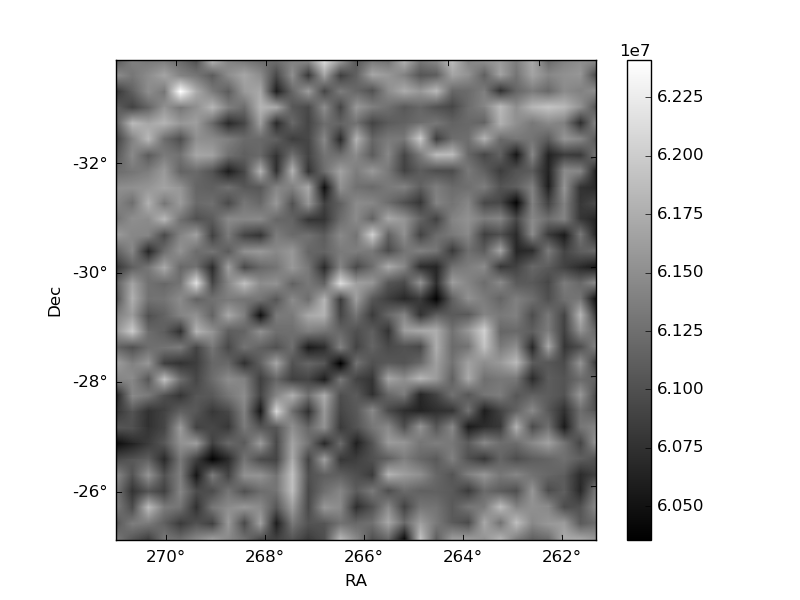
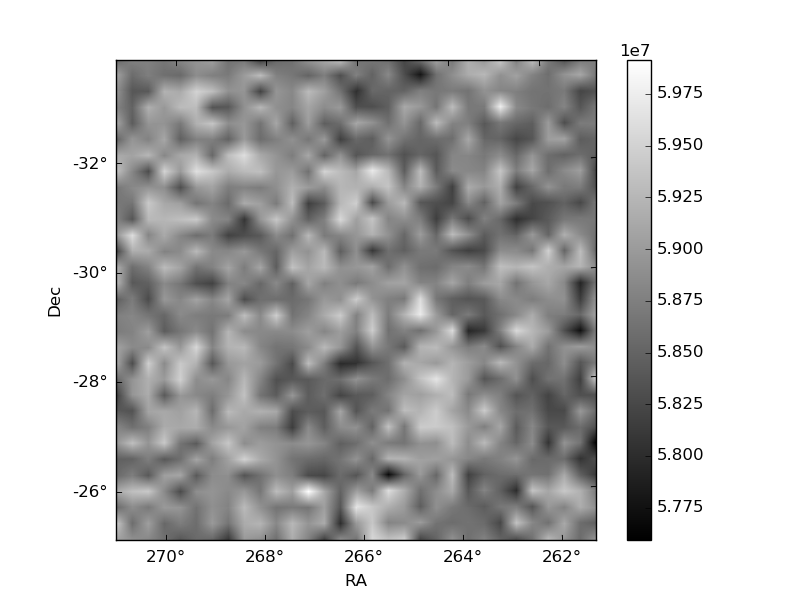
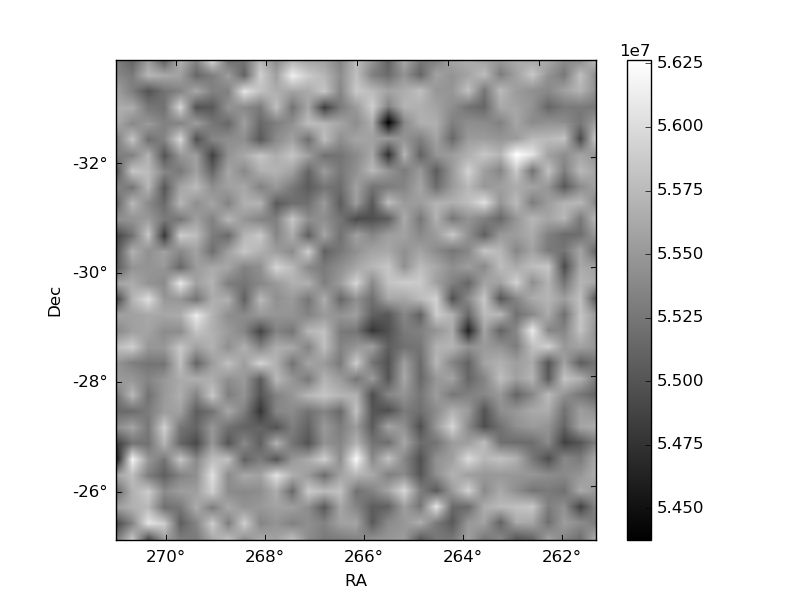
Histogram calculated using DETX and DETY for each event in the final _common_clean file
| Quadrant A | 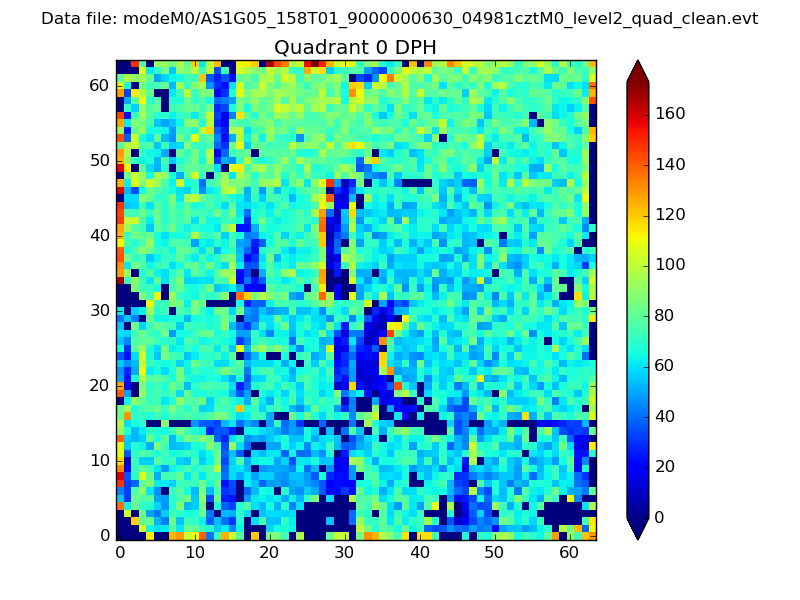 |
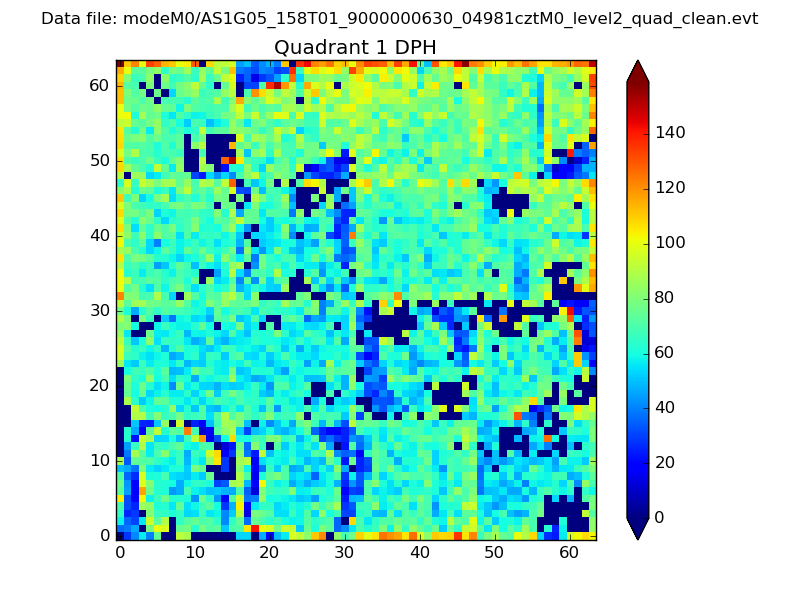 |
Quadrant B |
|---|---|---|---|
| Quadrant D | 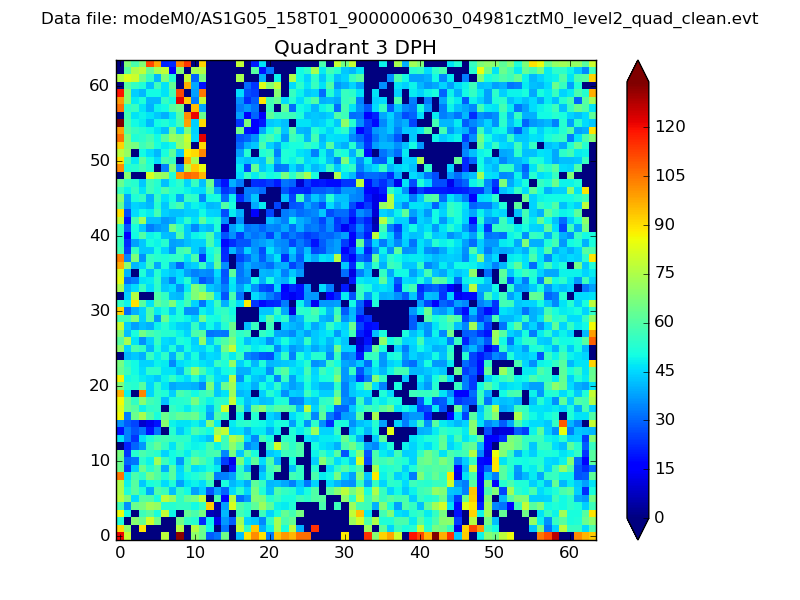 |
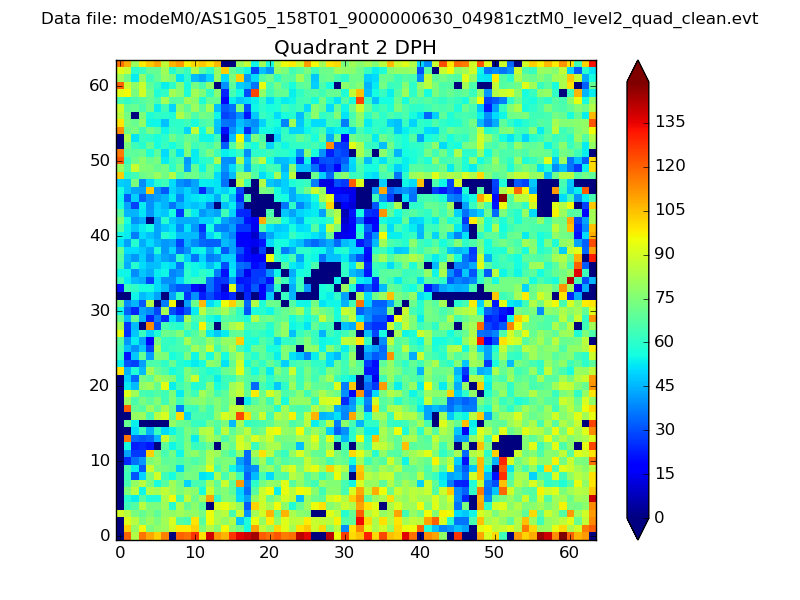 |
Quadrant C |
| Plot type | Count rate plots | Images |
|---|---|---|
| Comparison with Poisson distribution Blue bars denote a histogram of data divided into 1 sec bins. Red curve is a Poisson curve with rate = median count rate of data. |
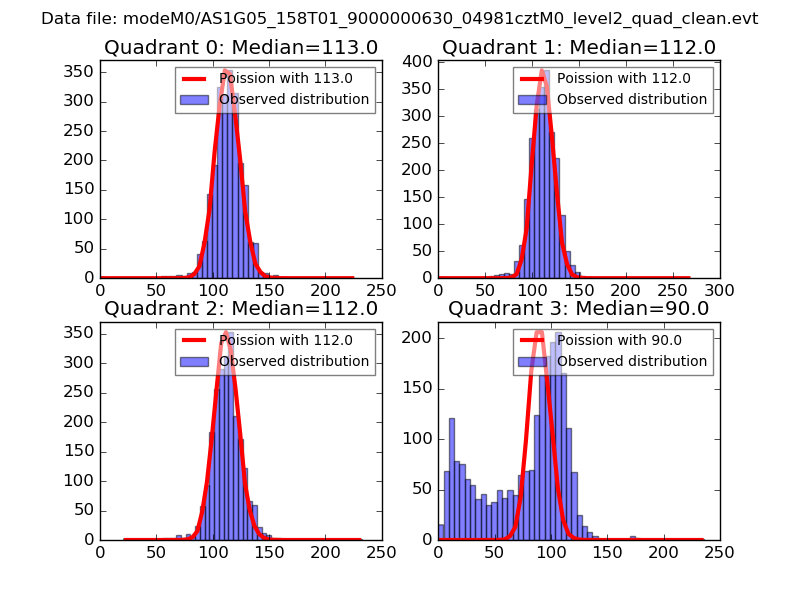 |
 |
| Quadrant-wise count rates Data is divided into 100 sec bins |
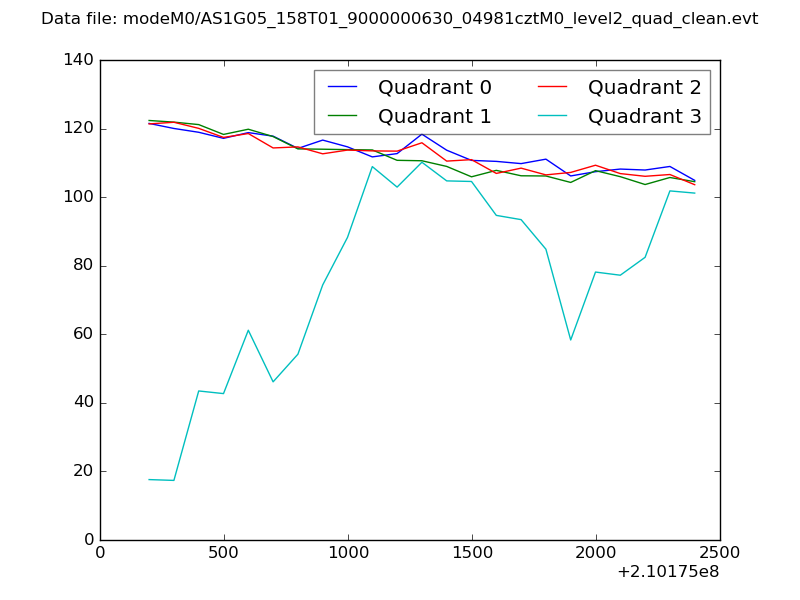 |
|
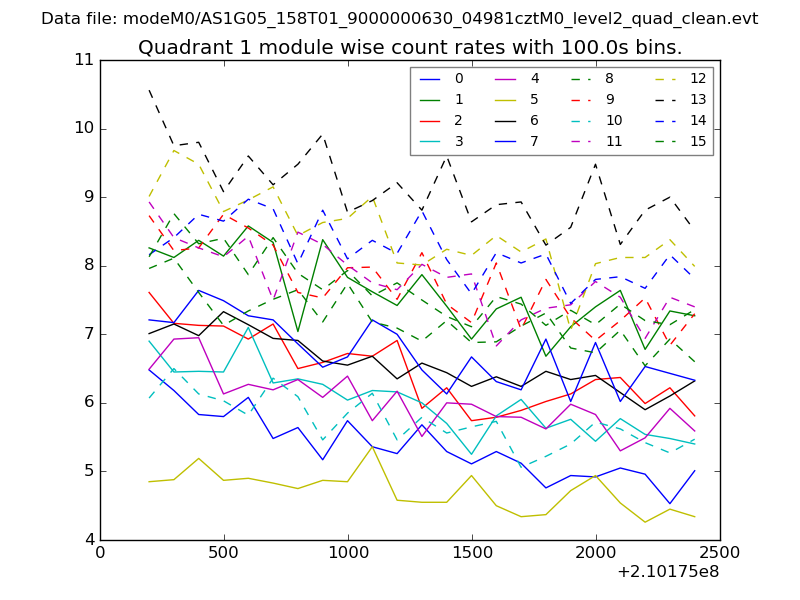
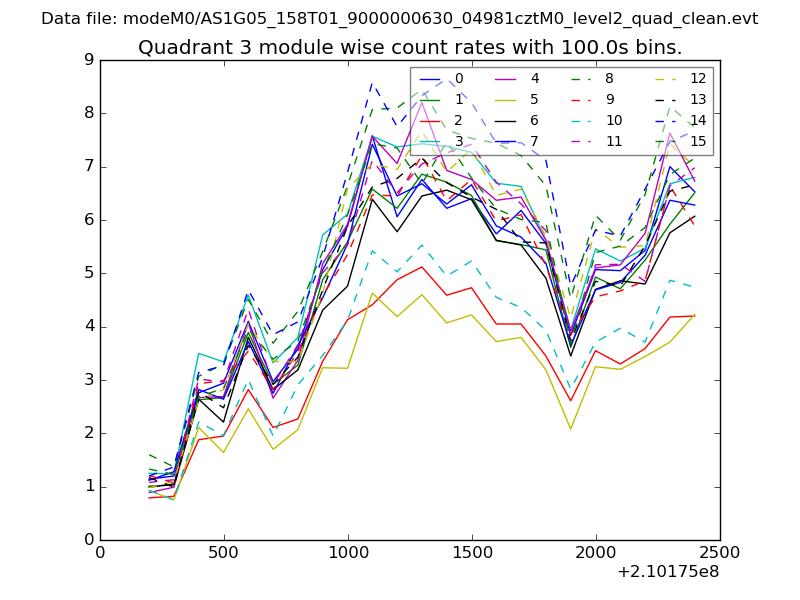
| Module-wise count rates for Quadrant A Data is divided into 100 sec bins |
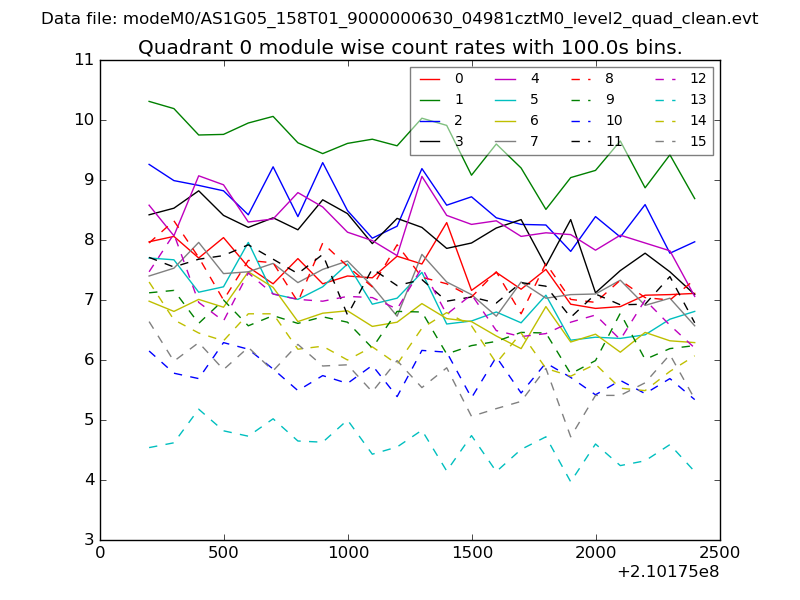 |
 |
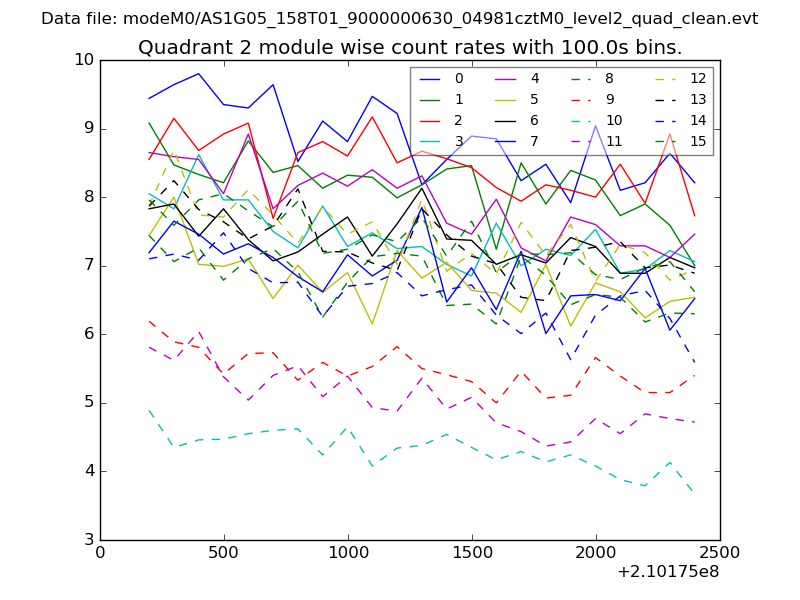
| Module-wise count rates for Quadrant B Data is divided into 100 sec bins |
 |
 |
| Module-wise count rates for Quadrant C Data is divided into 100 sec bins |
 |
 |
| Module-wise count rates for Quadrant D Data is divided into 100 sec bins |
 |
 |
| Parameter | Plot |
|---|---|
| CZT HV Monitor | 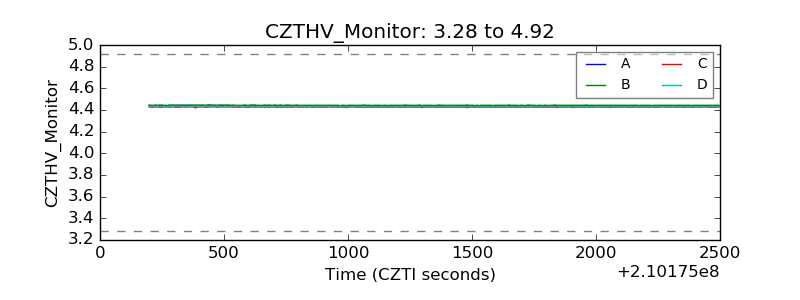 |
| D_VDD | 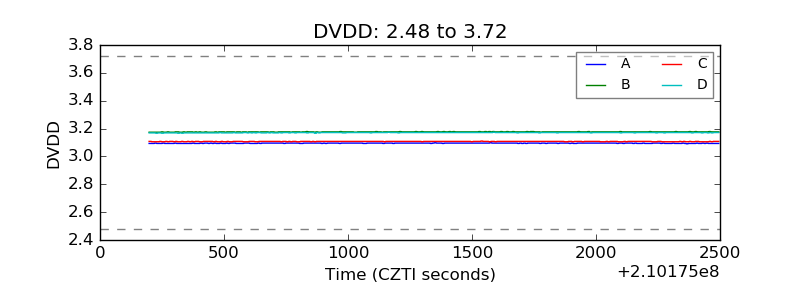 |
| Temperature 1 | 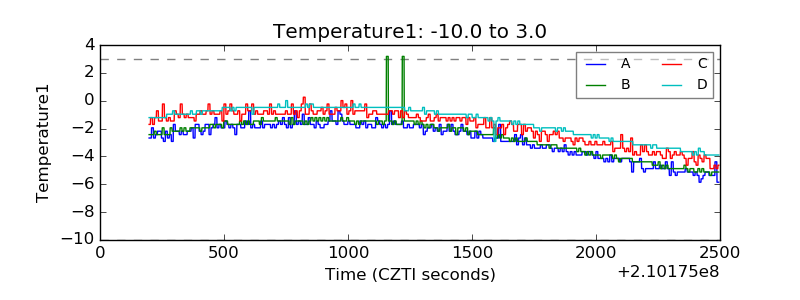 |
| Veto HV Monitor | 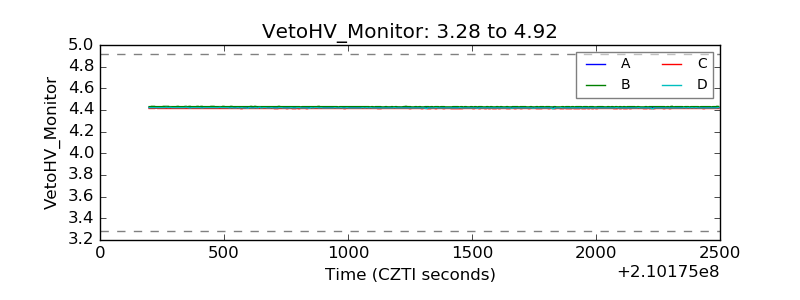 |
| Veto LLD | 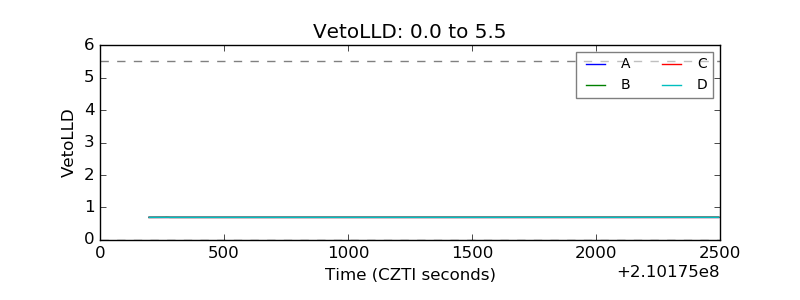 |
| Alpha Counter | 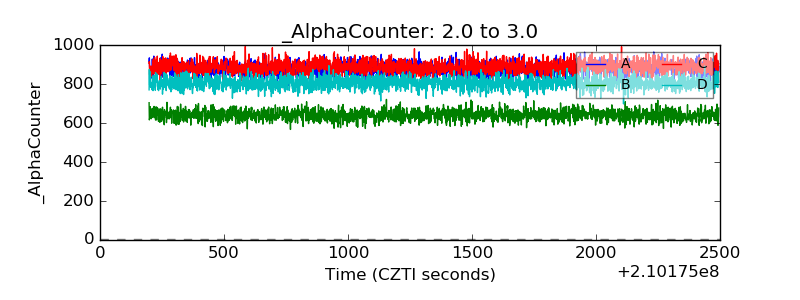 |
| _CPM_Rate | 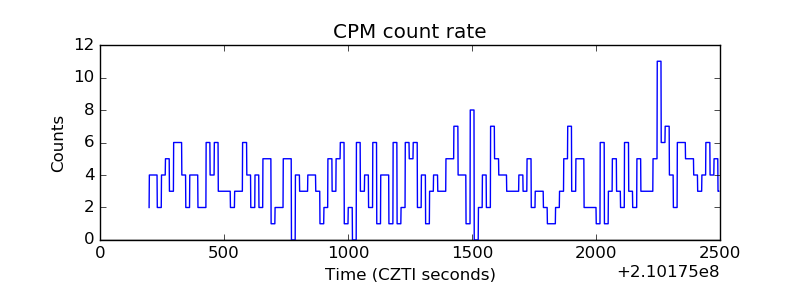 |
| CZT Counter | 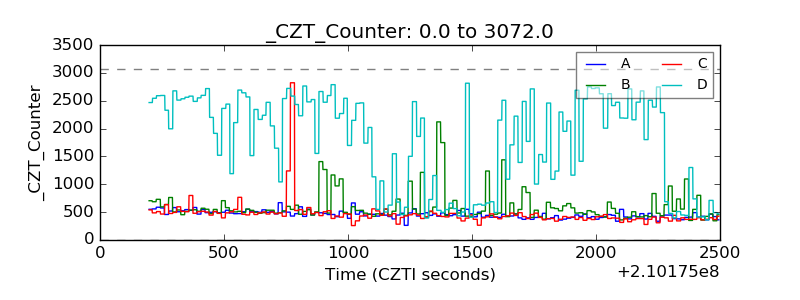 |
| +2.5 Volts monitor |  |
| +5 Volts monitor |  |
| _ROLL_ROT | 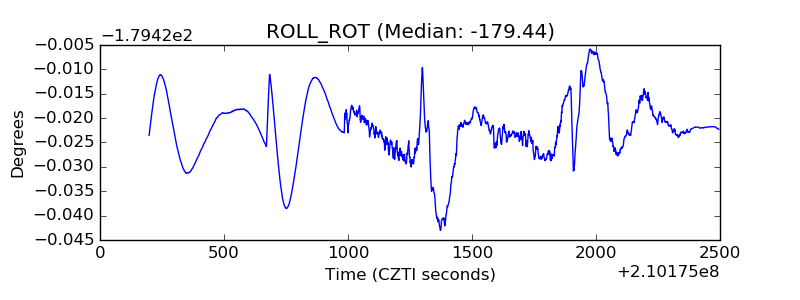 |
| _Roll_DEC | 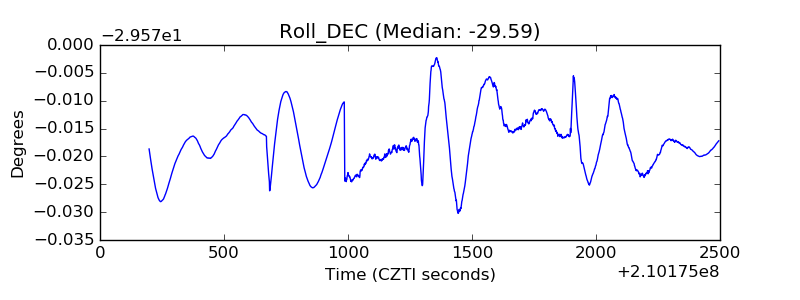 |
| _Roll_RA | 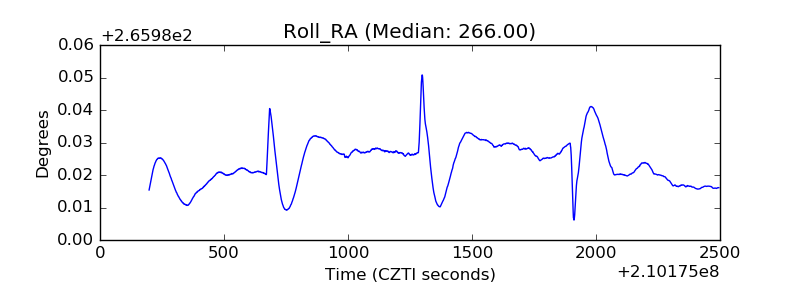 |
| Veto Counter | 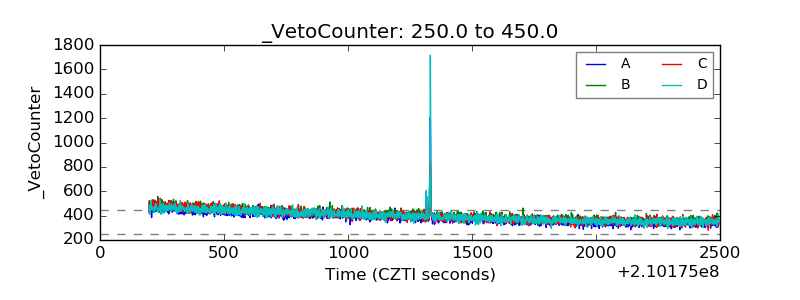 |