| Param | Original file | Final file |
|---|---|---|
| Filename | modeM0/AS1G05_115T01_9000000634cztM0_level2.fits | modeM0/AS1G05_115T01_9000000634cztM0_level2_quad_clean.evt |
| Size (bytes) | 599,299,200 | 639,011,520 |
| Size | 571.5 MB | 609.4 MB |
| Events in quadrant A | 3,600,296 | 3,852,053 |
| Events in quadrant B | 3,470,046 | 3,866,381 |
| Events in quadrant C | 3,560,592 | 3,745,624 |
| Events in quadrant D | 3,005,802 | 3,377,671 |
| Mode M9 | |||
|---|---|---|---|
| Quadrant | BADHDUFLAG | Total packets | Discarded packets |
| A | 0 | 86 | 0 |
| B | 0 | 85 | 0 |
| C | 0 | 85 | 0 |
| D | 0 | 85 | 0 |
| Mode M0 | |||
|---|---|---|---|
| Quadrant | BADHDUFLAG | Total packets | Discarded packets |
| A | 0 | 135604 | 0 |
| B | 0 | 142359 | 0 |
| C | 0 | 134080 | 0 |
| D | 0 | 170337 | 0 |
| Mode SS | |||
|---|---|---|---|
| Quadrant | BADHDUFLAG | Total packets | Discarded packets |
| A | 0 | 1336 | 0 |
| B | 0 | 1346 | 0 |
| C | 0 | 1340 | 0 |
| D | 0 | 1340 | 0 |
| Quadrant | Total seconds | Saturated seconds | Saturation percentage |
|---|---|---|---|
| A | 65776 | 710 | 1.079421% |
| B | 65766 | 957 | 1.455159% |
| C | 65810 | 374 | 0.568303% |
| D | 65679 | 2885 | 4.392576% |
Noise dominated data is calculated using 1-second bins in cleaned event files. If a bin has >2000 counts, and if more than 50% of those come from <1% of pixels, then it is considered to be noise-dominated and hence unusable.
| Quadrant | # 1 sec bins | Bins with >0 counts | Bins with >2000 counts | High rate bins dominated by noise | Noise dominated (total time) | Noise dominated (detector-on time) | Marked lightcurve |
|---|---|---|---|---|---|---|---|
| A | 89220 | 66040 | 0 | 0 | 0.00% | 0.00% |  |
| B | 89220 | 66023 | 0 | 0 | 0.00% | 0.00% |  |
| C | 89220 | 66083 | 0 | 0 | 0.00% | 0.00% |  |
| D | 89220 | 65893 | 0 | 0 | 0.00% | 0.00% |  |
Top three noisy pixels from each quadrant. If the there are fewer than three noisy pixels in the level2.evt file, extra rows are filled as -1
| Pixel properties | Quadrant properties | ||||||
|---|---|---|---|---|---|---|---|
| Quadrant | DetID | PixID | Counts | Sigma | Mean | Median | Sigma |
| A | 0 | 29 | 3554 | 11.19 | 934 | 872 | 239.6 |
| A | 14 | 188 | 3553 | 11.19 | 934 | 872 | 239.6 |
| A | 14 | 204 | 3191 | 9.68 | 934 | 872 | 239.6 |
| B | 2 | 9 | 3069 | 11.91 | 915 | 869 | 184.8 |
| B | 12 | 226 | 2484 | 8.74 | 915 | 869 | 184.8 |
| B | 14 | 254 | 2458 | 8.6 | 915 | 869 | 184.8 |
| C | 1 | 80 | 2680 | 7.32 | 938 | 870 | 247.4 |
| C | 1 | 81 | 2666 | 7.26 | 938 | 870 | 247.4 |
| C | 12 | 241 | 2457 | 6.41 | 938 | 870 | 247.4 |
| D | 11 | 82 | 2428 | 7.15 | 857 | 780 | 230.4 |
| D | 1 | 19 | 2250 | 6.38 | 857 | 780 | 230.4 |
| D | 6 | 231 | 2226 | 6.28 | 857 | 780 | 230.4 |
Histogram calculated using DETX and DETY for each event in the final _common_clean file
| Quadrant A |  |
 |
Quadrant B |
|---|---|---|---|
| Quadrant D |  |
 |
Quadrant C |
| Plot type | Count rate plots | Images |
|---|---|---|
| Comparison with Poisson distribution Blue bars denote a histogram of data divided into 1 sec bins. Red curve is a Poisson curve with rate = median count rate of data. |
 |
 |
| Quadrant-wise count rates Data is divided into 100 sec bins |
 |
|
| Module-wise count rates for Quadrant A Data is divided into 100 sec bins |
 |
 |
| Module-wise count rates for Quadrant B Data is divided into 100 sec bins |
 |
 |
| Module-wise count rates for Quadrant C Data is divided into 100 sec bins |
 |
 |
| Module-wise count rates for Quadrant D Data is divided into 100 sec bins |
 |
 |
| Parameter | Plot |
|---|---|
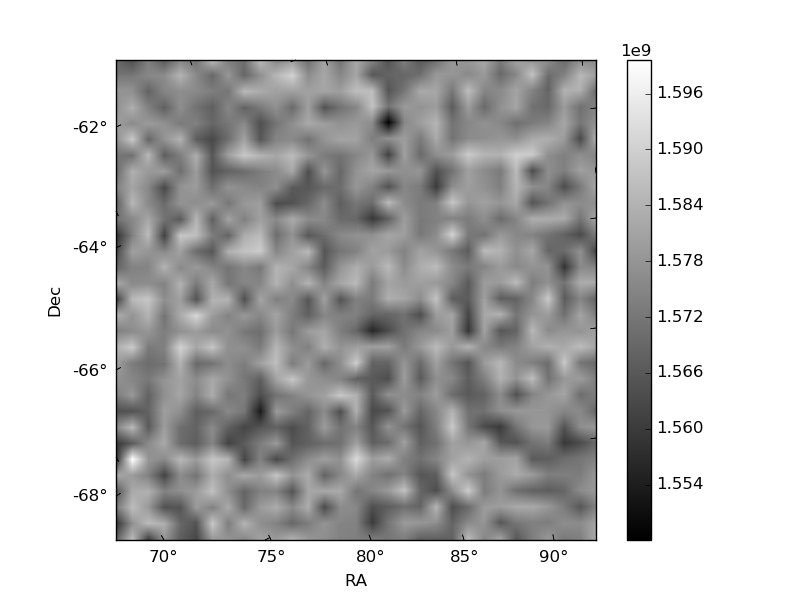
| CZT HV Monitor |  |
| D_VDD | 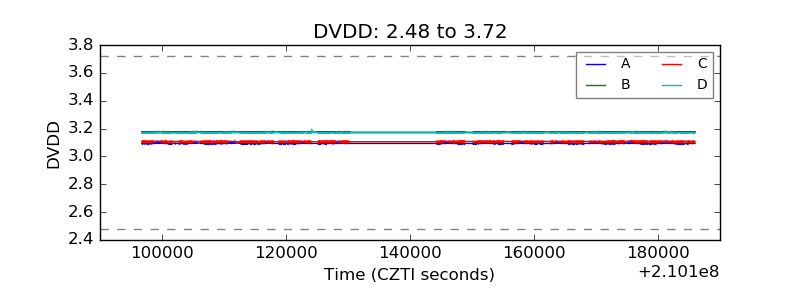 |
| Temperature 1 |  |
| Veto HV Monitor |  |
| Veto LLD |  |
| Alpha Counter |  |
| _CPM_Rate |  |
| CZT Counter |  |
| +2.5 Volts monitor |  |
| +5 Volts monitor |  |
| _ROLL_ROT |  |
| _Roll_DEC |  |
| _Roll_RA |  |
| Veto Counter |  |