| Param | Original file | Final file |
|---|---|---|
| Filename | modeM0/AS1G05_115T01_9000000634_04984cztM0_level2.evt | modeM0/AS1G05_115T01_9000000634_04984cztM0_level2_quad_clean.evt |
| Size (bytes) | 316,336,320 | 53,720,640 |
| Size | 301.7 MB | 51.2 MB |
| Events in quadrant A | 2,109,944 | 328,044 |
| Events in quadrant B | 2,356,612 | 330,439 |
| Events in quadrant C | 2,049,396 | 331,520 |
| Events in quadrant D | 2,753,549 | 316,247 |
| Mode M9 | |||
|---|---|---|---|
| Quadrant | BADHDUFLAG | Total packets | Discarded packets |
| A | 0 | 2 | 0 |
| B | 0 | 2 | 0 |
| C | 0 | 2 | 0 |
| D | 0 | 2 | 0 |
| Mode M0 | |||
|---|---|---|---|
| Quadrant | BADHDUFLAG | Total packets | Discarded packets |
| A | 0 | 9423 | 2 |
| B | 0 | 10099 | 1 |
| C | 0 | 9343 | 1 |
| D | 0 | 11329 | 1 |
| Mode SS | |||
|---|---|---|---|
| Quadrant | BADHDUFLAG | Total packets | Discarded packets |
| A | 0 | 92 | 0 |
| B | 0 | 92 | 0 |
| C | 0 | 92 | 0 |
| D | 0 | 92 | 0 |
| Quadrant | Total seconds | Saturated seconds | Saturation percentage |
|---|---|---|---|
| A | 4558 | 77 | 1.689337% |
| B | 4558 | 107 | 2.347521% |
| C | 4558 | 44 | 0.965336% |
| D | 4558 | 176 | 3.861343% |
Noise dominated data is calculated using 1-second bins in cleaned event files. If a bin has >2000 counts, and if more than 50% of those come from <1% of pixels, then it is considered to be noise-dominated and hence unusable.
| Quadrant | # 1 sec bins | Bins with >0 counts | Bins with >2000 counts | High rate bins dominated by noise | Noise dominated (total time) | Noise dominated (detector-on time) | Marked lightcurve |
|---|---|---|---|---|---|---|---|
| A | 4727 | 4557 | 0 | 0 | 0.00% | 0.00% | 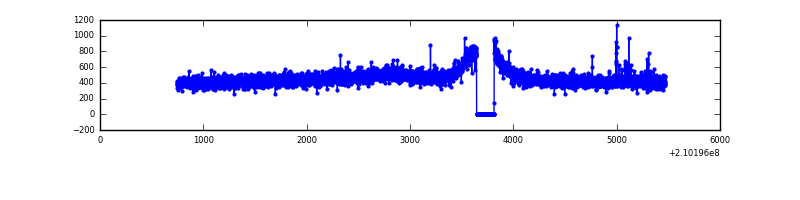 |
| B | 4727 | 4557 | 4 | 4 | 0.08% | 0.09% | 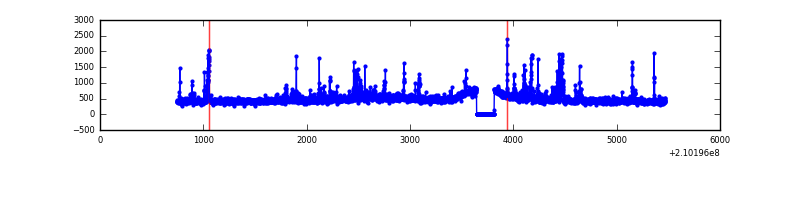 |
| C | 4727 | 4557 | 0 | 0 | 0.00% | 0.00% | 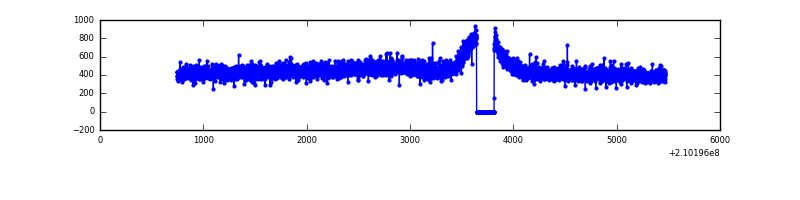 |
| D | 4727 | 4557 | 93 | 93 | 1.97% | 2.04% | 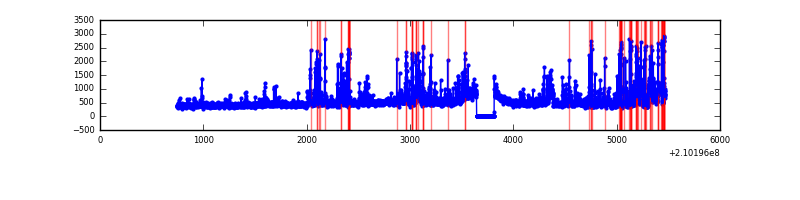 |
Top three noisy pixels from each quadrant. If the there are fewer than three noisy pixels in the level2.evt file, extra rows are filled as -1
| Pixel properties | Quadrant properties | ||||||
|---|---|---|---|---|---|---|---|
| Quadrant | DetID | PixID | Counts | Sigma | Mean | Median | Sigma |
| A | 0 | 50 | 15227 | 131.62 | 539 | 525 | 111.7 |
| A | 8 | 15 | 7593 | 63.28 | 539 | 525 | 111.7 |
| A | 4 | 2 | 6521 | 53.68 | 539 | 525 | 111.7 |
| B | 0 | 219 | 218343 | 2068.6 | 542 | 529 | 105.3 |
| B | 15 | 54 | 16269 | 149.48 | 542 | 529 | 105.3 |
| B | 4 | 48 | 10872 | 98.23 | 542 | 529 | 105.3 |
| C | 13 | 61 | 4306 | 30.92 | 524 | 524 | 122.3 |
| C | 12 | 4 | 2543 | 16.5 | 524 | 524 | 122.3 |
| C | 9 | 54 | 1645 | 9.16 | 524 | 524 | 122.3 |
| D | 13 | 235 | 373609 | 2885.17 | 522 | 504 | 129.3 |
| D | 2 | 33 | 165906 | 1279.03 | 522 | 504 | 129.3 |
| D | 2 | 136 | 86150 | 662.29 | 522 | 504 | 129.3 |
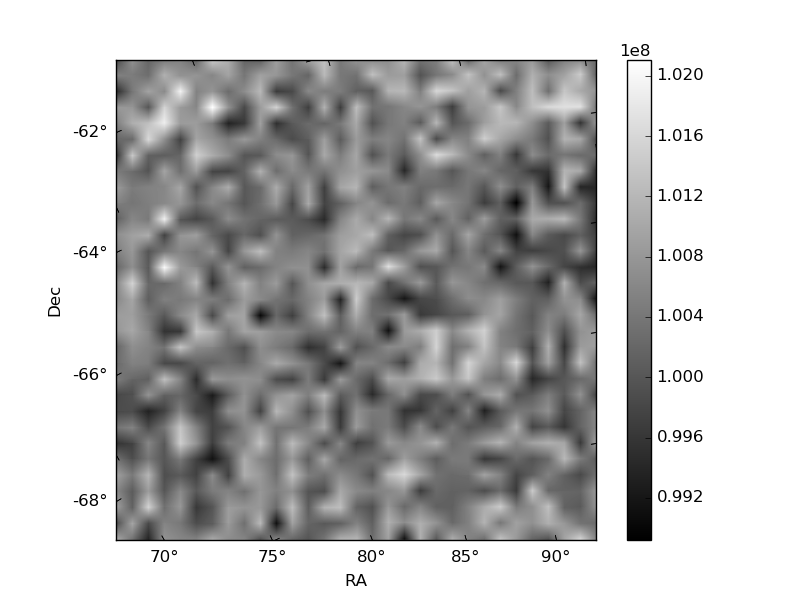
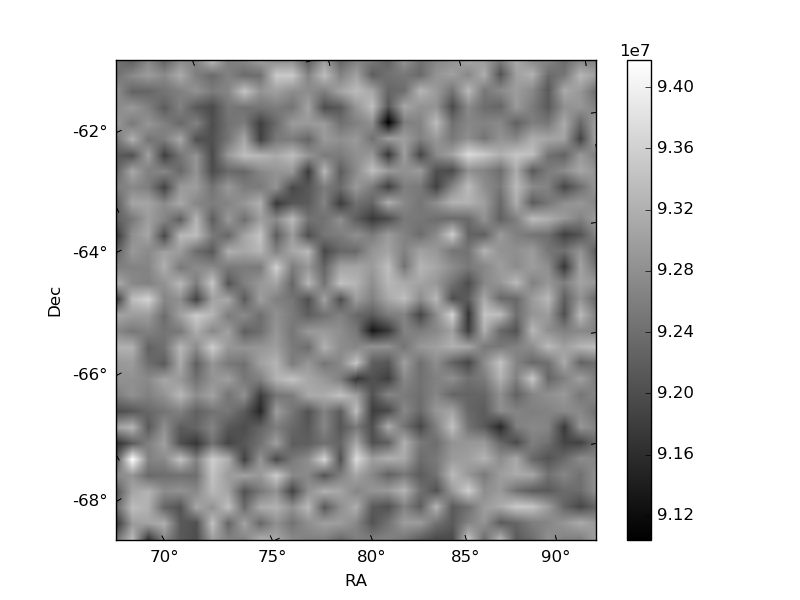
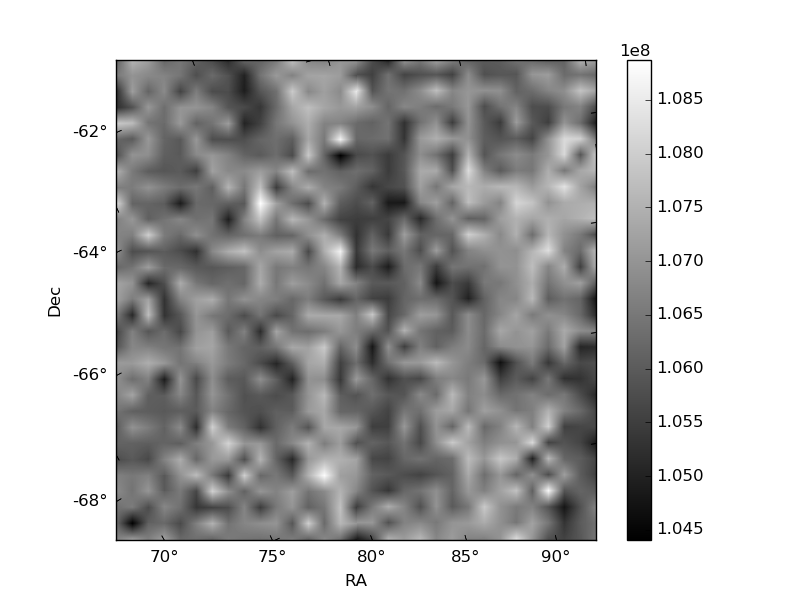
Histogram calculated using DETX and DETY for each event in the final _common_clean file
| Quadrant A |  |
 |
Quadrant B |
|---|---|---|---|
| Quadrant D |  |
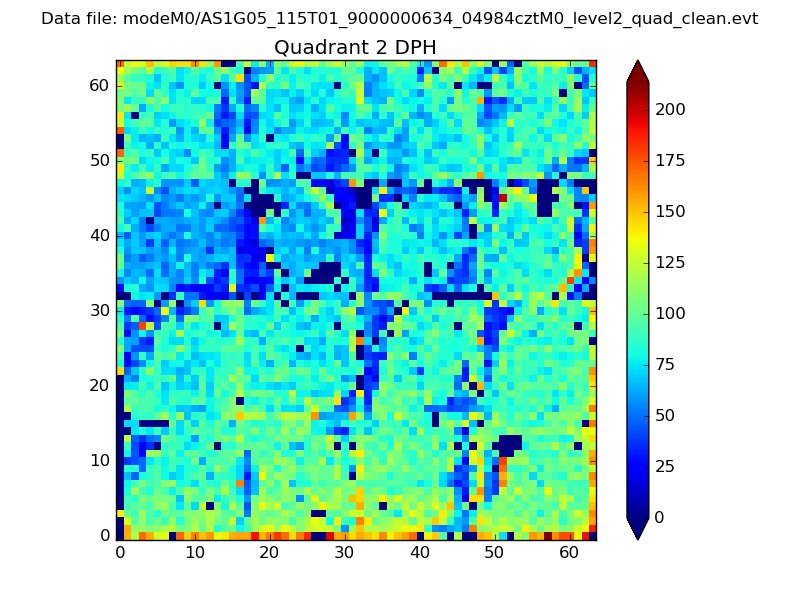 |
Quadrant C |
| Plot type | Count rate plots | Images |
|---|---|---|
| Comparison with Poisson distribution Blue bars denote a histogram of data divided into 1 sec bins. Red curve is a Poisson curve with rate = median count rate of data. |
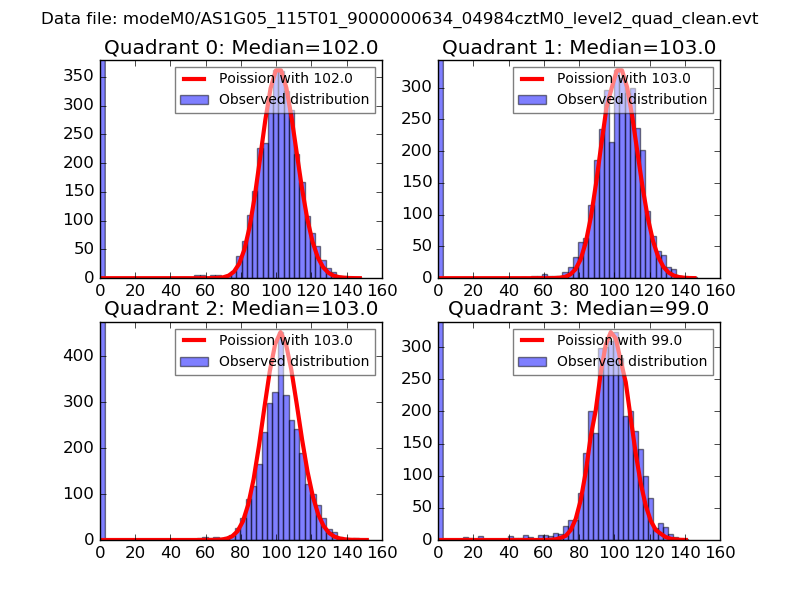 |
 |
| Quadrant-wise count rates Data is divided into 100 sec bins |
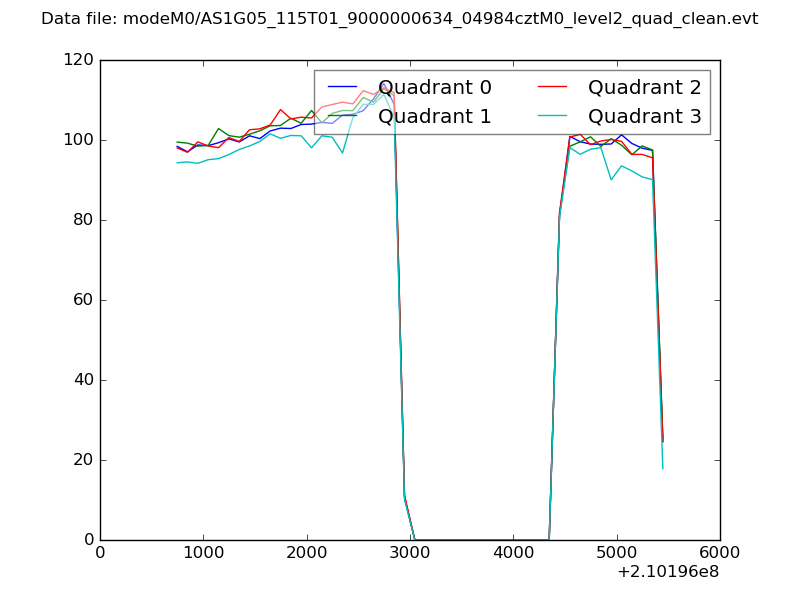 |
|
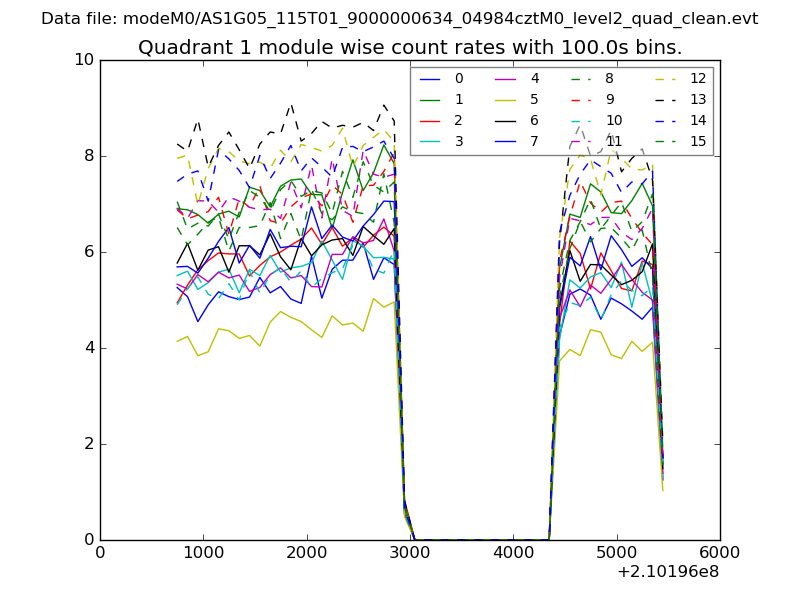
| Module-wise count rates for Quadrant A Data is divided into 100 sec bins |
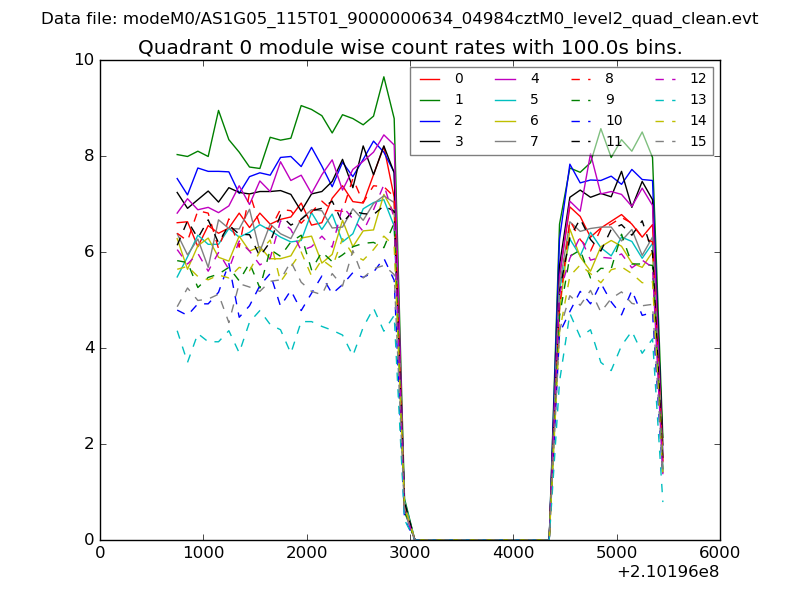 |
 |
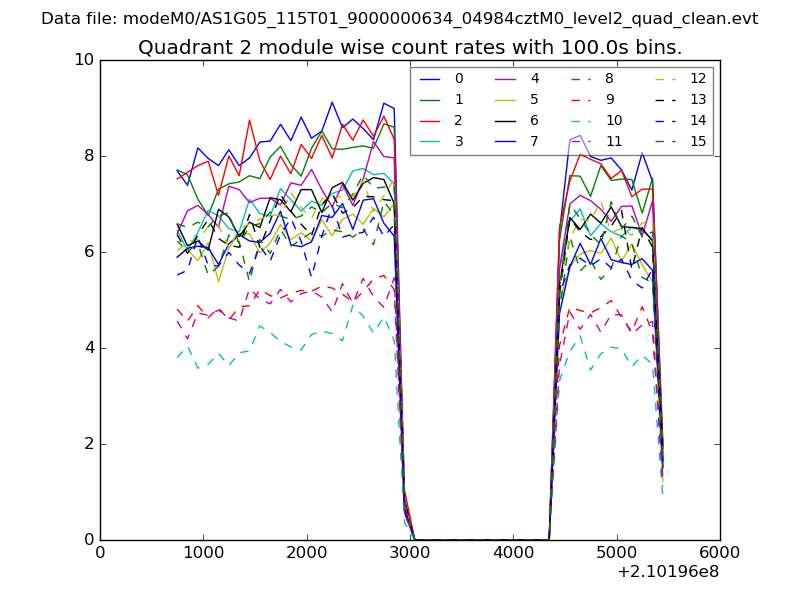
| Module-wise count rates for Quadrant B Data is divided into 100 sec bins |
 |
 |
| Module-wise count rates for Quadrant C Data is divided into 100 sec bins |
 |
 |
| Module-wise count rates for Quadrant D Data is divided into 100 sec bins |
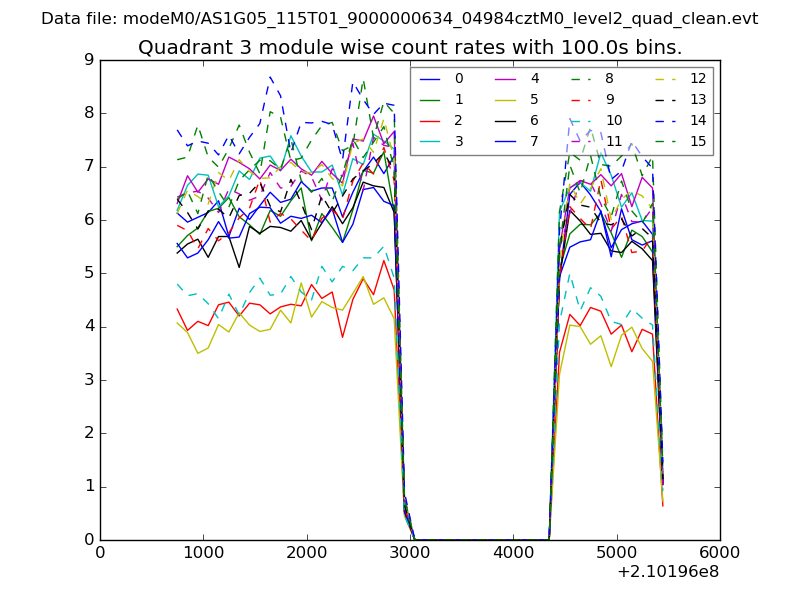 |
 |
| Parameter | Plot |
|---|---|
| CZT HV Monitor | 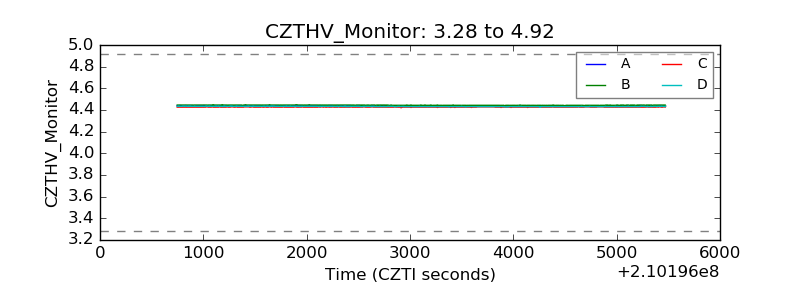 |
| D_VDD | 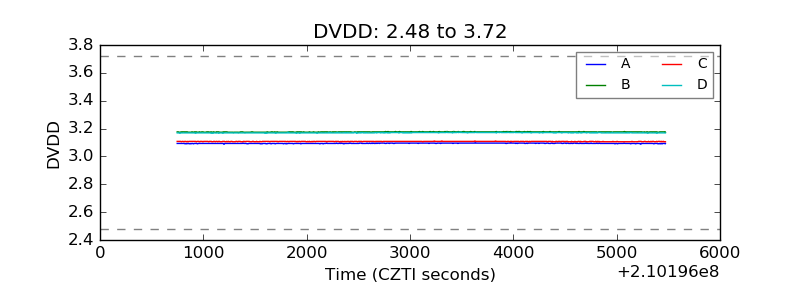 |
| Temperature 1 | 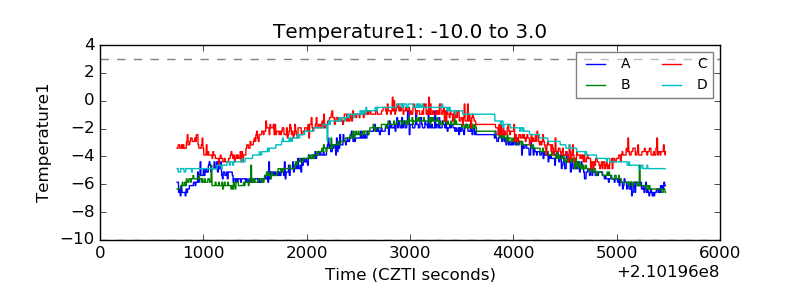 |
| Veto HV Monitor |  |
| Veto LLD | 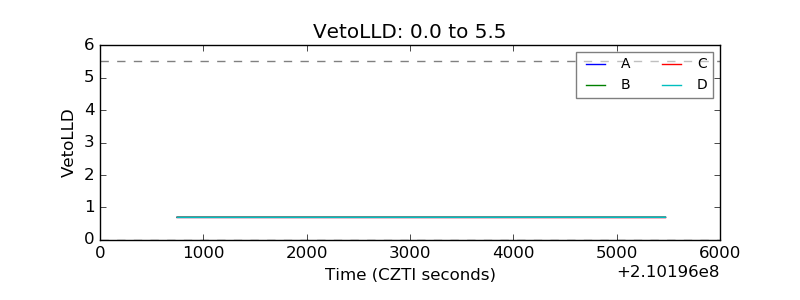 |
| Alpha Counter | 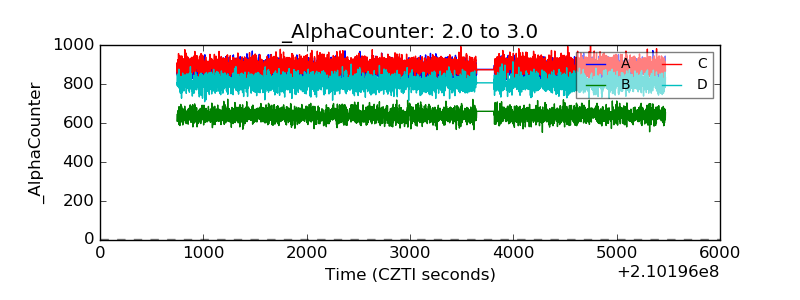 |
| _CPM_Rate | 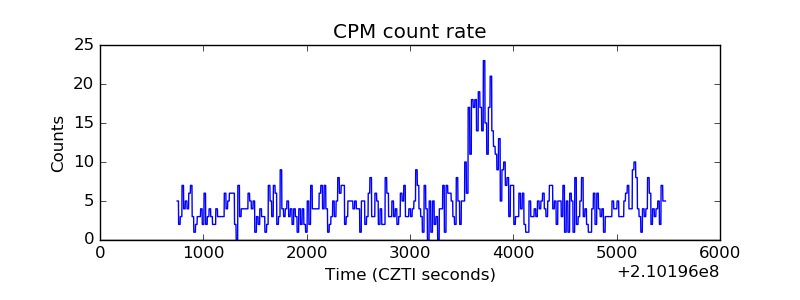 |
| CZT Counter | 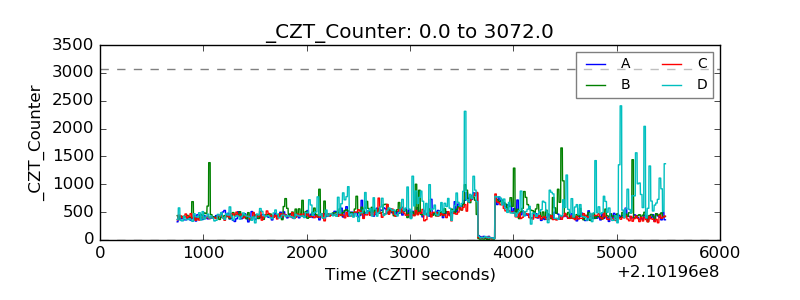 |
| +2.5 Volts monitor |  |
| +5 Volts monitor |  |
| _ROLL_ROT | 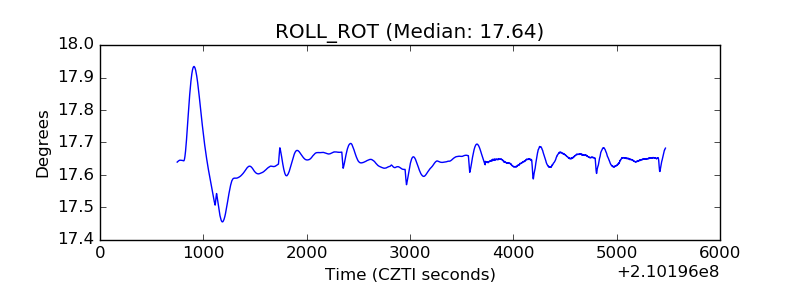 |
| _Roll_DEC | 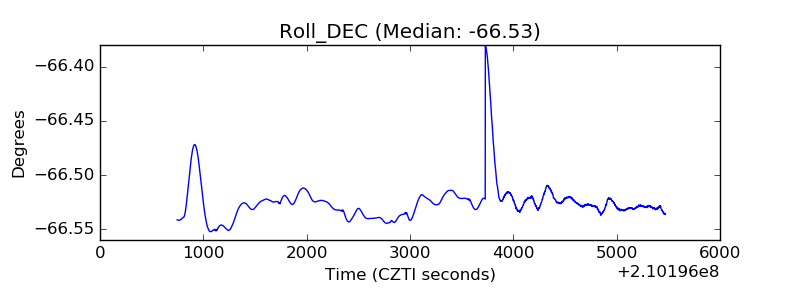 |
| _Roll_RA |  |
| Veto Counter | 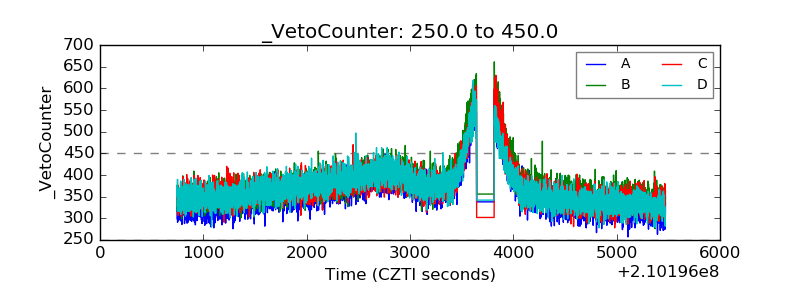 |