| Param | Original file | Final file |
|---|---|---|
| Filename | modeM0/AS1G05_115T01_9000000634_04985cztM0_level2.evt | modeM0/AS1G05_115T01_9000000634_04985cztM0_level2_quad_clean.evt |
| Size (bytes) | 29,162,880 | 5,788,800 |
| Size | 27.8 MB | 5.5 MB |
| Events in quadrant A | 203,365 | 34,478 |
| Events in quadrant B | 217,274 | 35,955 |
| Events in quadrant C | 220,053 | 35,253 |
| Events in quadrant D | 206,112 | 27,696 |
| Mode M9 | |||
|---|---|---|---|
| Quadrant | BADHDUFLAG | Total packets | Discarded packets |
| A | 0 | 2 | 1 |
| B | 0 | 2 | 0 |
| C | 0 | 2 | 1 |
| D | 0 | 2 | 0 |
| Mode M0 | |||
|---|---|---|---|
| Quadrant | BADHDUFLAG | Total packets | Discarded packets |
| A | 0 | 6444 | 5482 |
| B | 0 | 6759 | 5749 |
| C | 0 | 6351 | 5297 |
| D | 0 | 8353 | 7438 |
| Mode SS | |||
|---|---|---|---|
| Quadrant | BADHDUFLAG | Total packets | Discarded packets |
| A | 0 | 64 | 56 |
| B | 0 | 64 | 46 |
| C | 0 | 64 | 56 |
| D | 0 | 64 | 58 |
| Quadrant | Total seconds | Saturated seconds | Saturation percentage |
|---|---|---|---|
| A | 469 | 10 | 2.132196% |
| B | 481 | 12 | 2.494802% |
| C | 515 | 6 | 1.165049% |
| D | 429 | 9 | 2.097902% |
Noise dominated data is calculated using 1-second bins in cleaned event files. If a bin has >2000 counts, and if more than 50% of those come from <1% of pixels, then it is considered to be noise-dominated and hence unusable.
| Quadrant | # 1 sec bins | Bins with >0 counts | Bins with >2000 counts | High rate bins dominated by noise | Noise dominated (total time) | Noise dominated (detector-on time) | Marked lightcurve |
|---|---|---|---|---|---|---|---|
| A | 3247 | 583 | 0 | 0 | 0.00% | 0.00% | 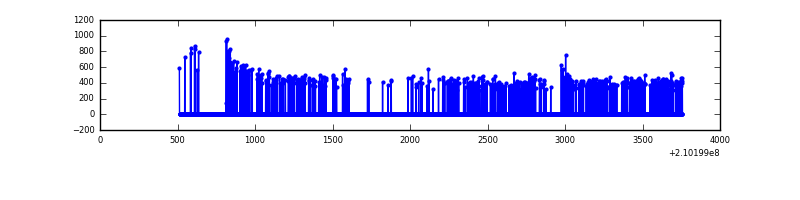 |
| B | 3263 | 566 | 0 | 0 | 0.00% | 0.00% | 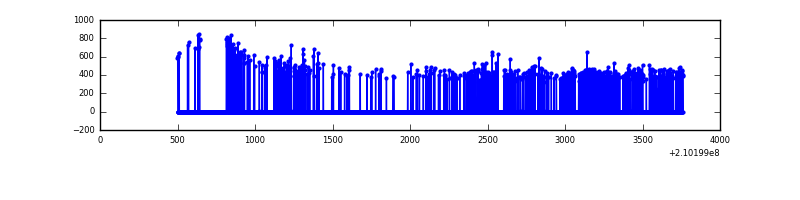 |
| C | 3273 | 621 | 0 | 0 | 0.00% | 0.00% | 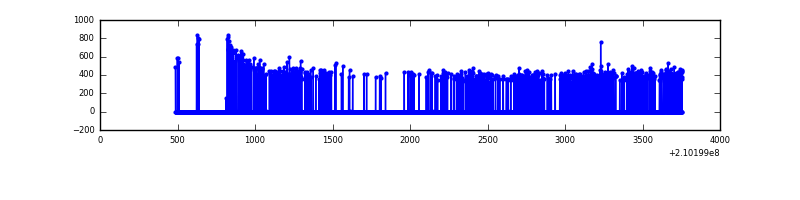 |
| D | 3279 | 528 | 0 | 0 | 0.00% | 0.00% | 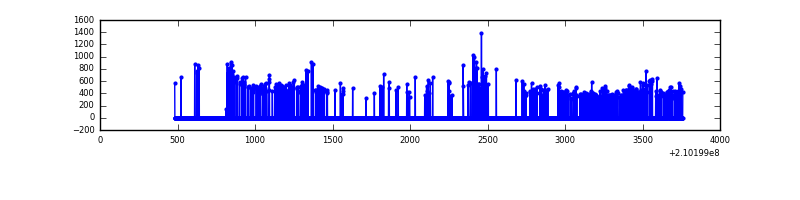 |
Top three noisy pixels from each quadrant. If the there are fewer than three noisy pixels in the level2.evt file, extra rows are filled as -1
| Pixel properties | Quadrant properties | ||||||
|---|---|---|---|---|---|---|---|
| Quadrant | DetID | PixID | Counts | Sigma | Mean | Median | Sigma |
| A | 8 | 15 | 2833 | 214.39 | 51 | 50 | 13.0 |
| A | 0 | 50 | 1453 | 108.08 | 51 | 50 | 13.0 |
| A | 4 | 2 | 912 | 66.4 | 51 | 50 | 13.0 |
| B | 0 | 219 | 5909 | 457.34 | 54 | 52 | 12.8 |
| B | 12 | 111 | 940 | 69.34 | 54 | 52 | 12.8 |
| B | 0 | 183 | 811 | 59.27 | 54 | 52 | 12.8 |
| C | 7 | 159 | 527 | 31.38 | 55 | 55 | 15.0 |
| C | 13 | 61 | 430 | 24.93 | 55 | 55 | 15.0 |
| C | 12 | 4 | 397 | 22.74 | 55 | 55 | 15.0 |
| D | 13 | 235 | 17845 | 1342.64 | 46 | 44 | 13.3 |
| D | 2 | 33 | 4948 | 369.88 | 46 | 44 | 13.3 |
| D | 1 | 7 | 2454 | 181.77 | 46 | 44 | 13.3 |
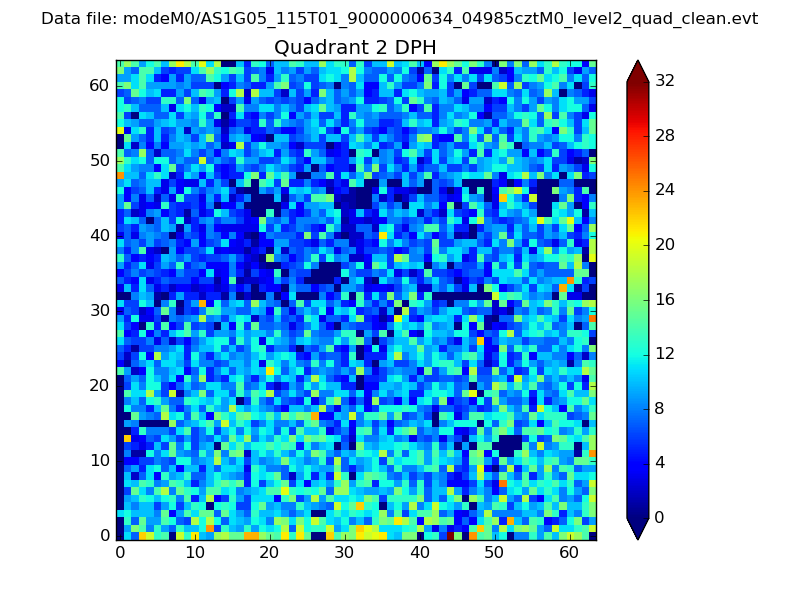
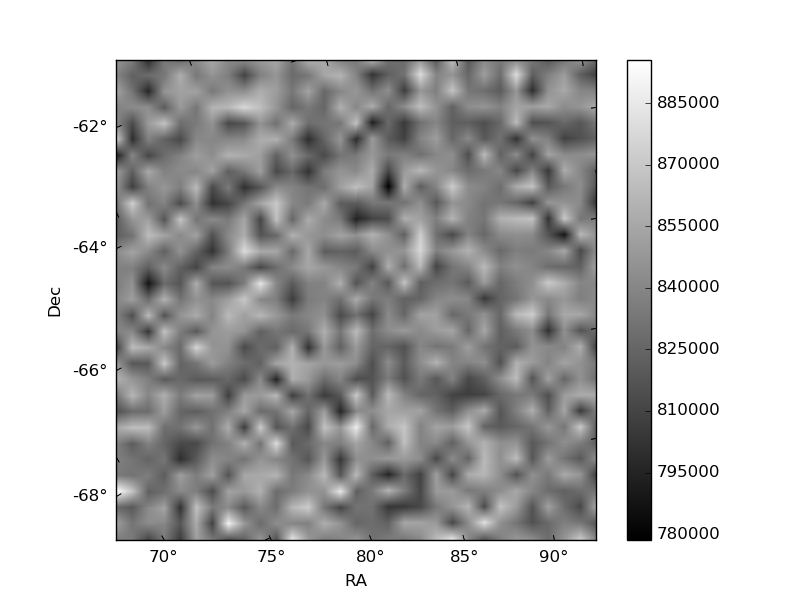
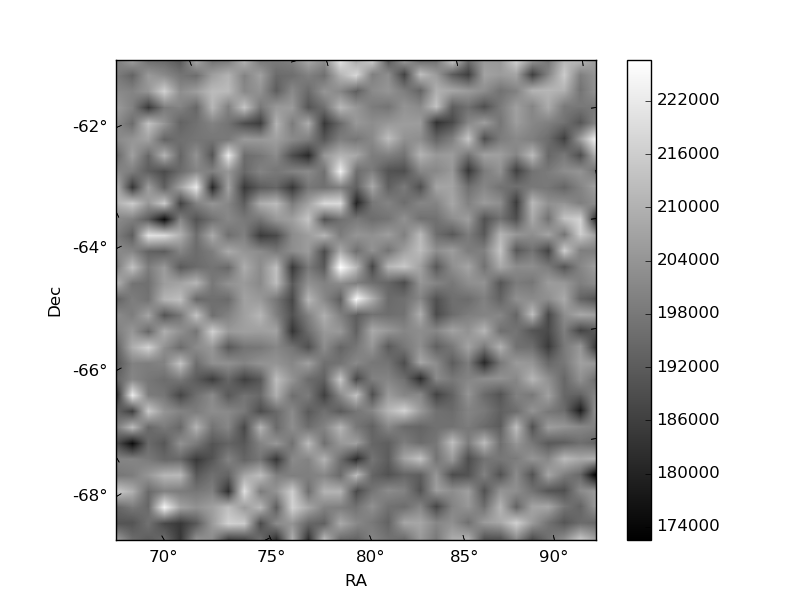
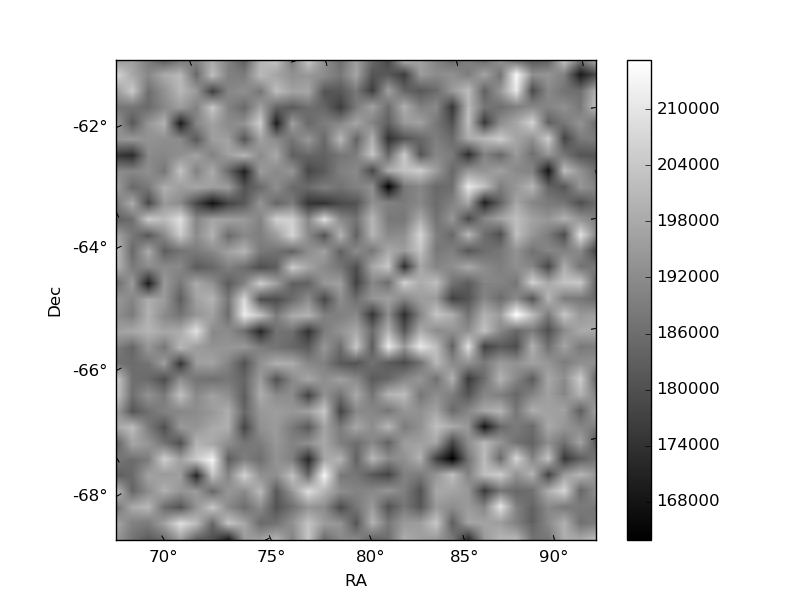
Histogram calculated using DETX and DETY for each event in the final _common_clean file
| Quadrant A | 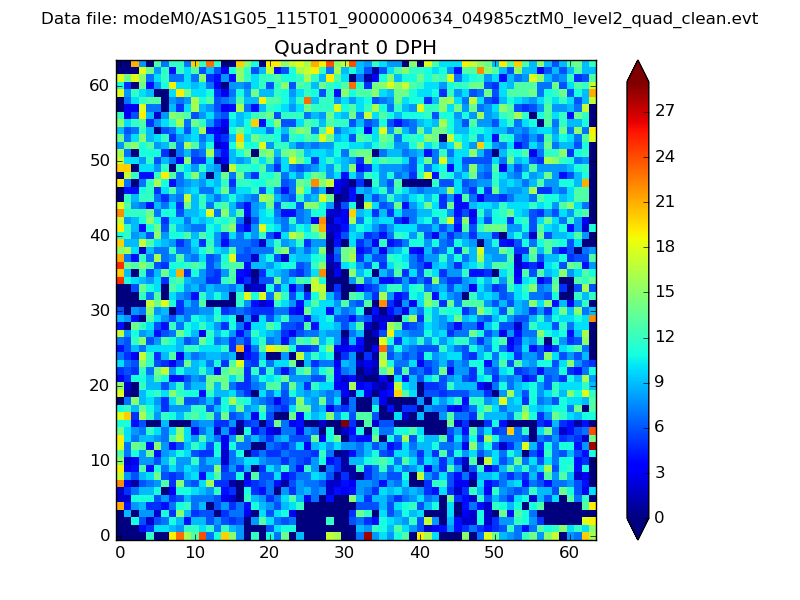 |
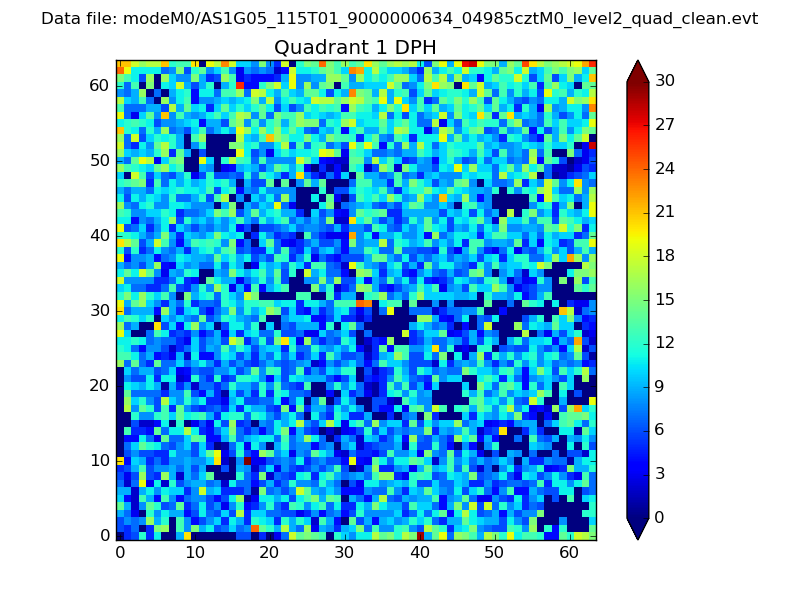 |
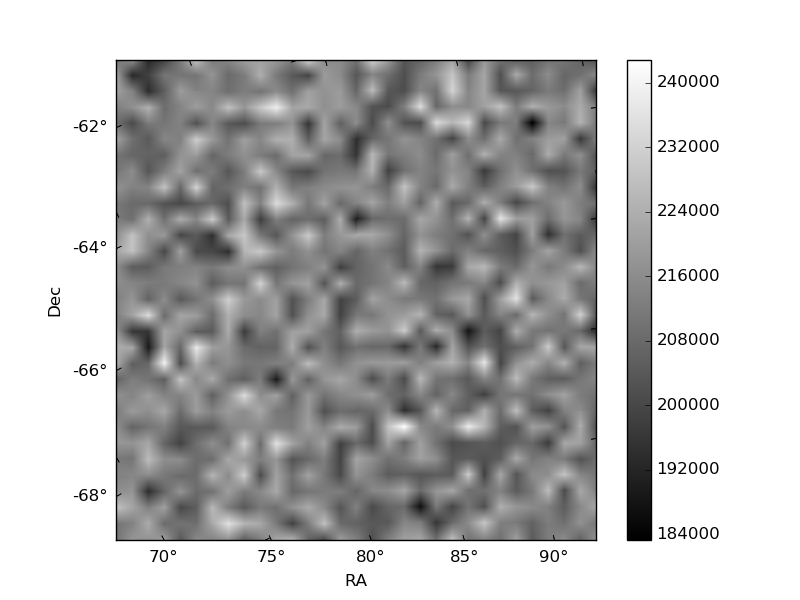
Quadrant B |
|---|---|---|---|
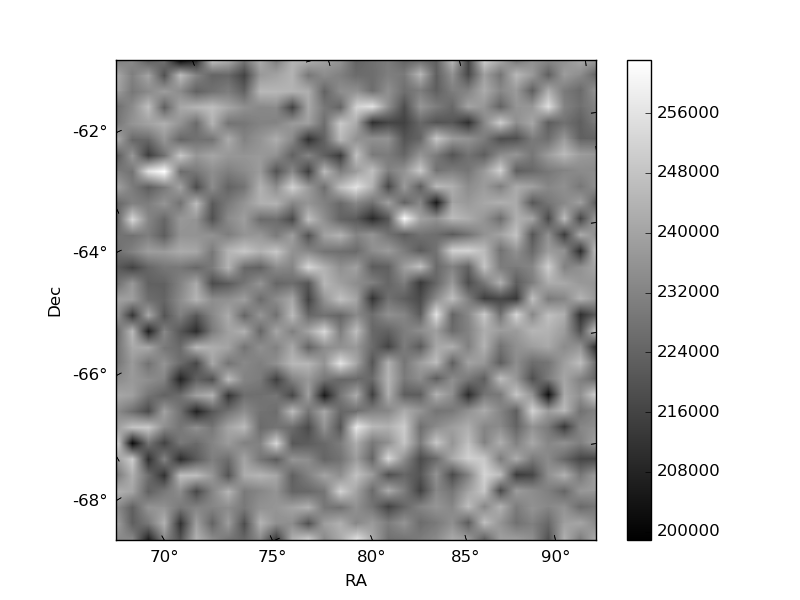
| Quadrant D | 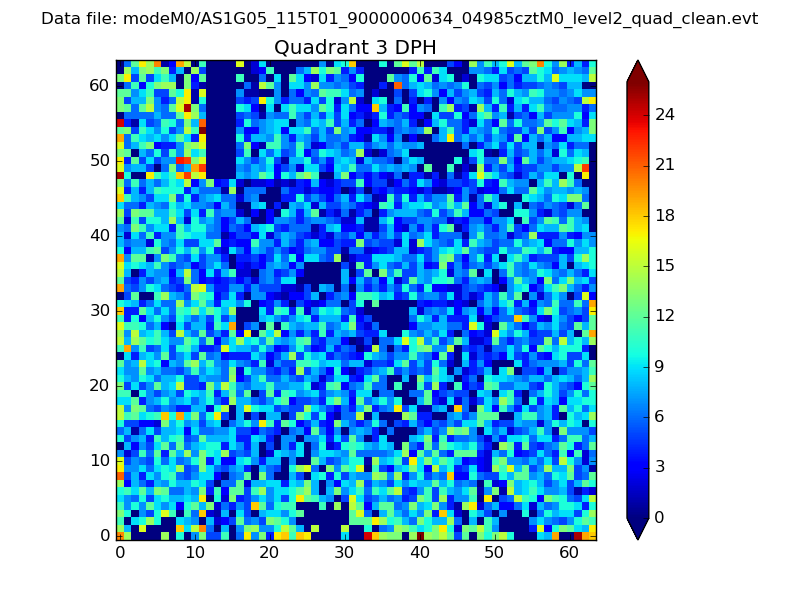 |
 |
Quadrant C |
| Plot type | Count rate plots | Images |
|---|---|---|
| Comparison with Poisson distribution Blue bars denote a histogram of data divided into 1 sec bins. Red curve is a Poisson curve with rate = median count rate of data. |
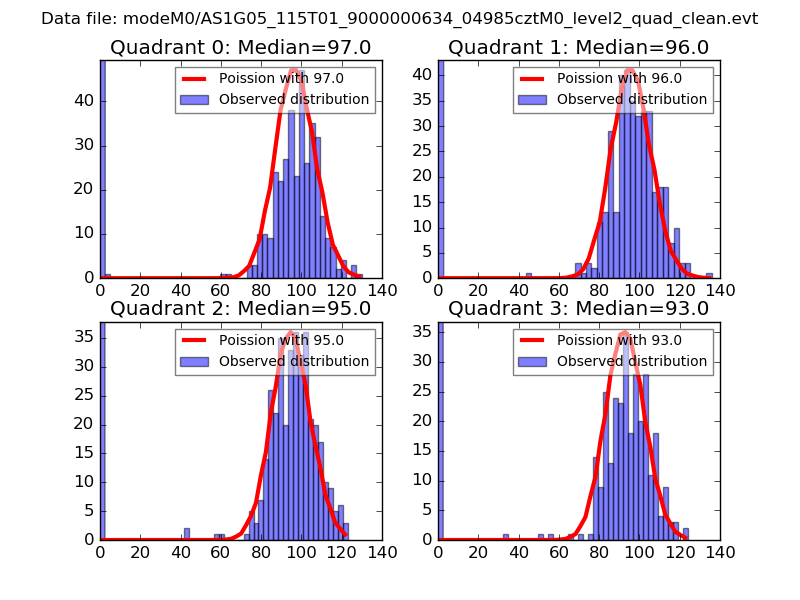 |
 |
| Quadrant-wise count rates Data is divided into 100 sec bins |
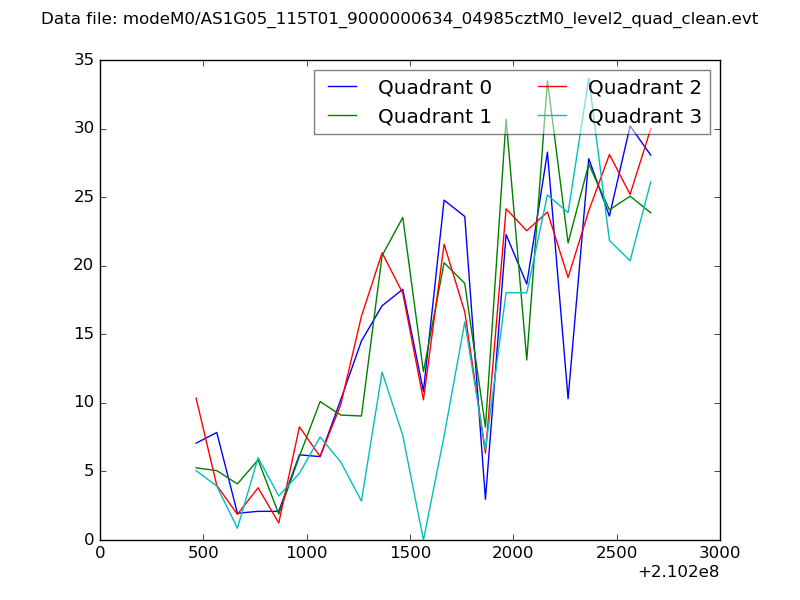 |
|
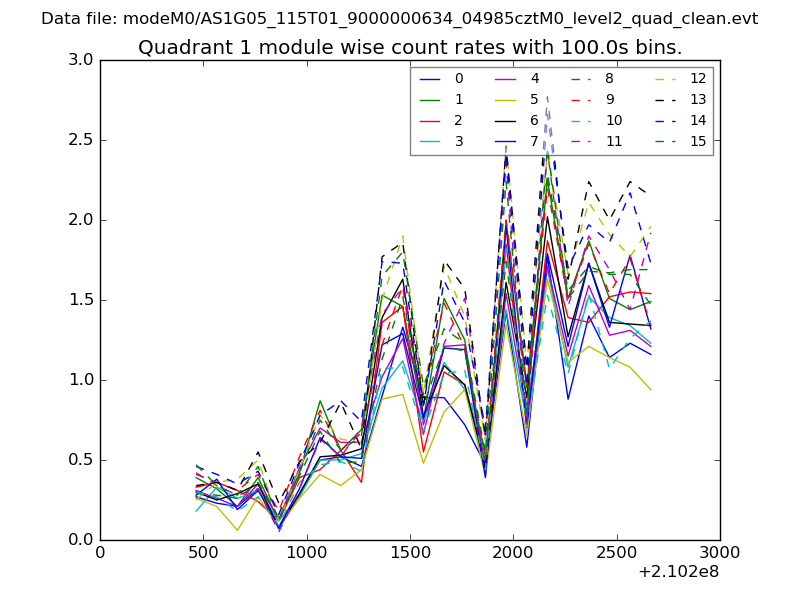
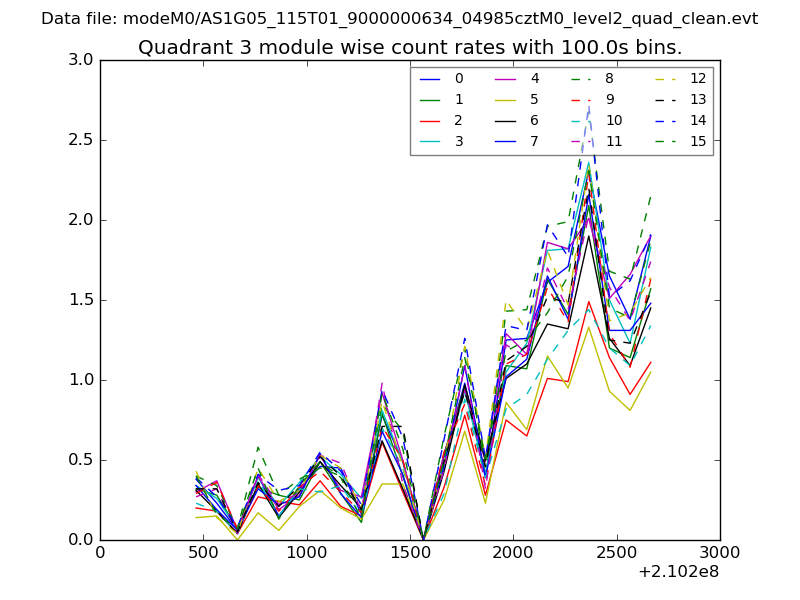
| Module-wise count rates for Quadrant A Data is divided into 100 sec bins |
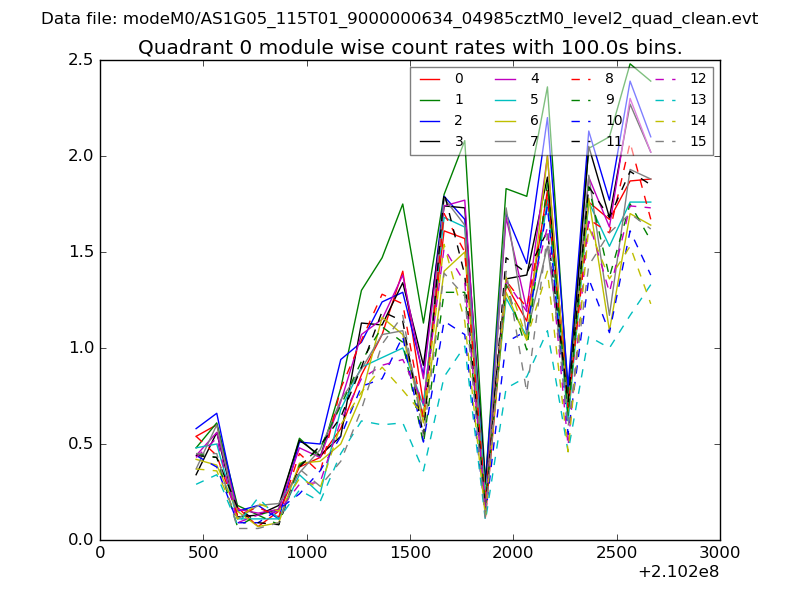 |
 |
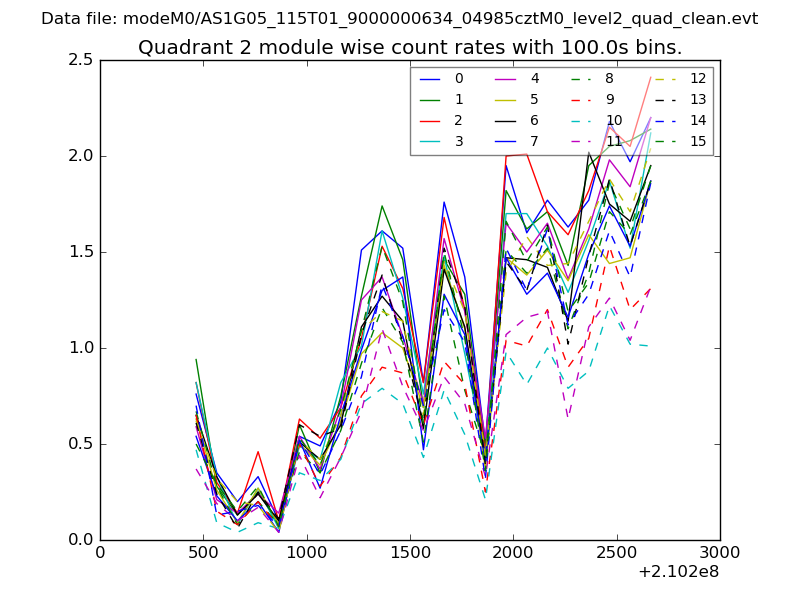
| Module-wise count rates for Quadrant B Data is divided into 100 sec bins |
 |
 |
| Module-wise count rates for Quadrant C Data is divided into 100 sec bins |
 |
 |
| Module-wise count rates for Quadrant D Data is divided into 100 sec bins |
 |
 |
| Parameter | Plot |
|---|---|
| CZT HV Monitor | 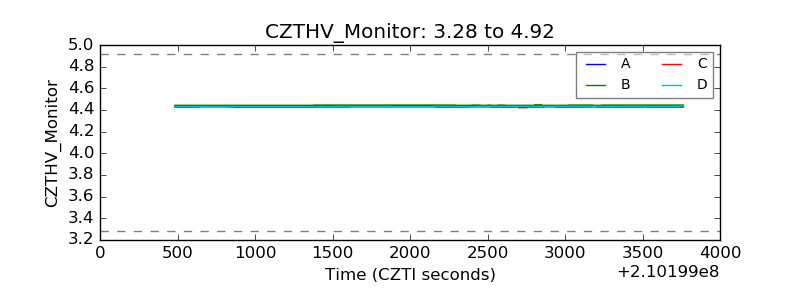 |
| D_VDD | 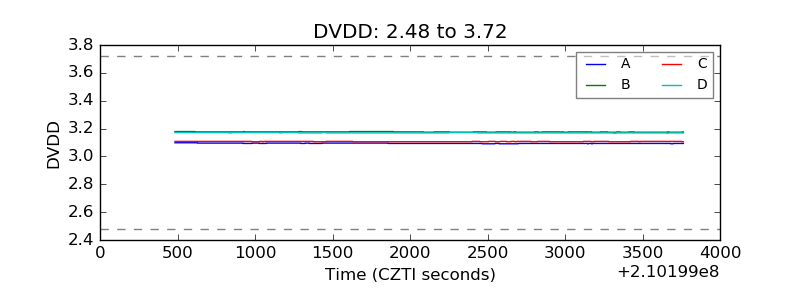 |
| Temperature 1 | 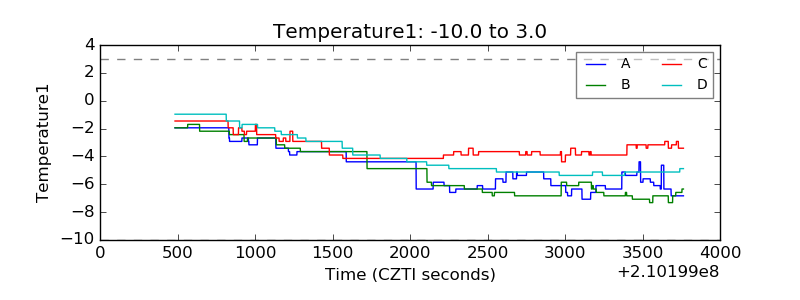 |
| Veto HV Monitor | 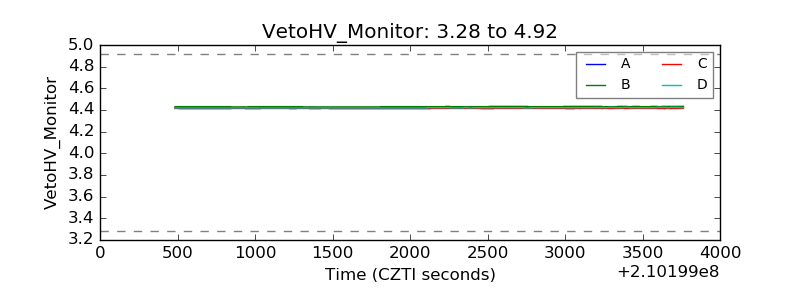 |
| Veto LLD | 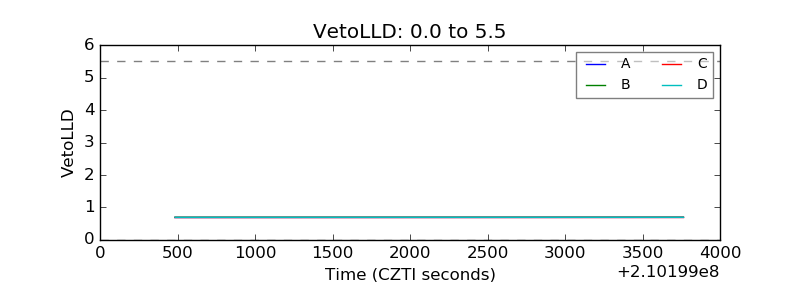 |
| Alpha Counter | 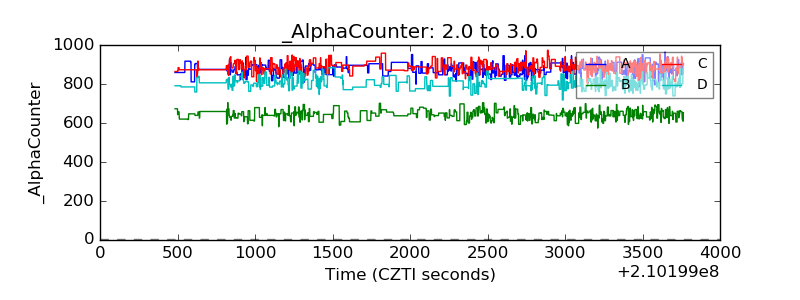 |
| _CPM_Rate | 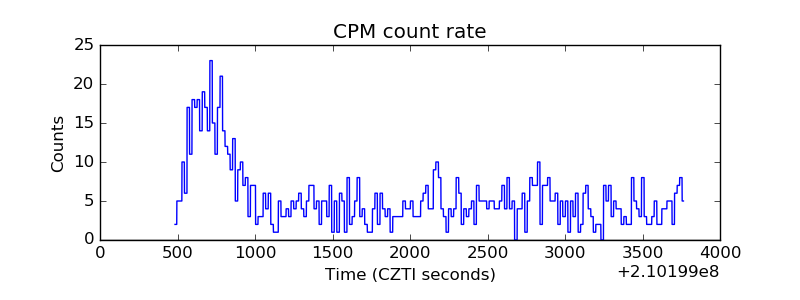 |
| CZT Counter | 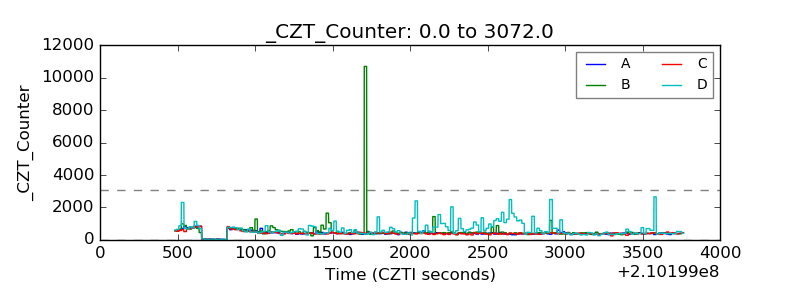 |
| +2.5 Volts monitor |  |
| +5 Volts monitor |  |
| _ROLL_ROT | 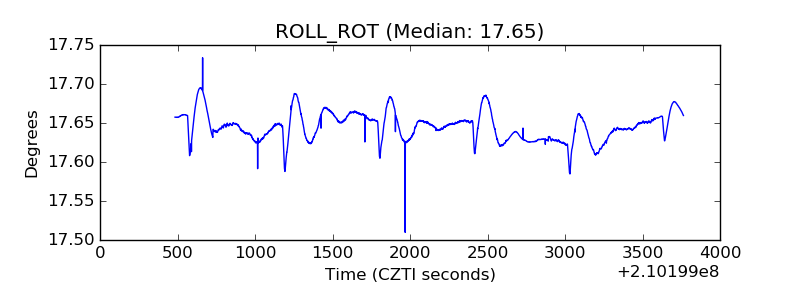 |
| _Roll_DEC | 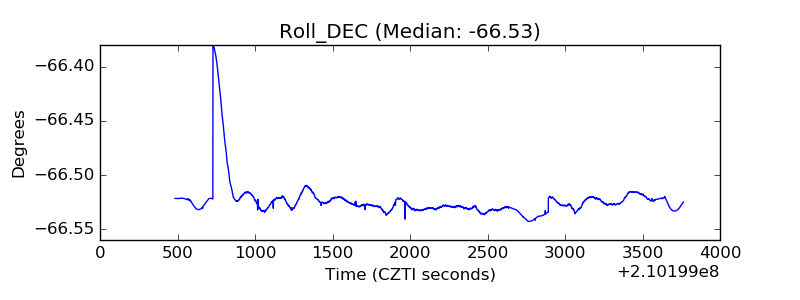 |
| _Roll_RA | 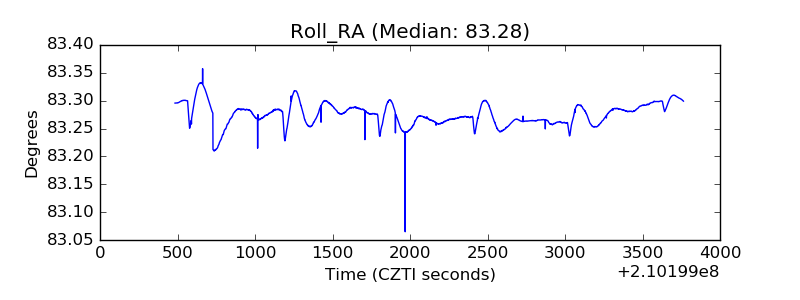 |
| Veto Counter | 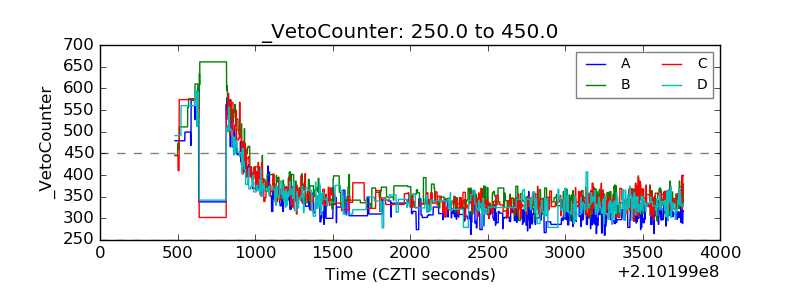 |