| Param | Original file | Final file |
|---|---|---|
| Filename | modeM0/AS1G05_115T01_9000000634_04987cztM0_level2.evt | modeM0/AS1G05_115T01_9000000634_04987cztM0_level2_quad_clean.evt |
| Size (bytes) | 68,204,160 | 17,536,320 |
| Size | 65.0 MB | 16.7 MB |
| Events in quadrant A | 514,520 | 110,981 |
| Events in quadrant B | 507,909 | 112,447 |
| Events in quadrant C | 476,595 | 113,526 |
| Events in quadrant D | 485,094 | 106,415 |
| Mode M0 | |||
|---|---|---|---|
| Quadrant | BADHDUFLAG | Total packets | Discarded packets |
| A | 0 | 2764 | 380 |
| B | 0 | 2775 | 389 |
| C | 0 | 2649 | 334 |
| D | 0 | 2766 | 451 |
| Mode SS | |||
|---|---|---|---|
| Quadrant | BADHDUFLAG | Total packets | Discarded packets |
| A | 0 | 28 | 2 |
| B | 0 | 28 | 6 |
| C | 0 | 28 | 6 |
| D | 0 | 28 | 2 |
| Quadrant | Total seconds | Saturated seconds | Saturation percentage |
|---|---|---|---|
| A | 1142 | 2 | 0.175131% |
| B | 1152 | 3 | 0.260417% |
| C | 1157 | 0 | 0.000000% |
| D | 1127 | 2 | 0.177462% |
Noise dominated data is calculated using 1-second bins in cleaned event files. If a bin has >2000 counts, and if more than 50% of those come from <1% of pixels, then it is considered to be noise-dominated and hence unusable.
| Quadrant | # 1 sec bins | Bins with >0 counts | Bins with >2000 counts | High rate bins dominated by noise | Noise dominated (total time) | Noise dominated (detector-on time) | Marked lightcurve |
|---|---|---|---|---|---|---|---|
| A | 1323 | 1168 | 1 | 1 | 0.08% | 0.09% | 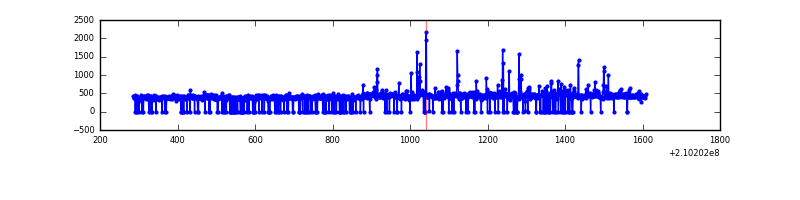 |
| B | 1323 | 1185 | 1 | 1 | 0.08% | 0.08% | 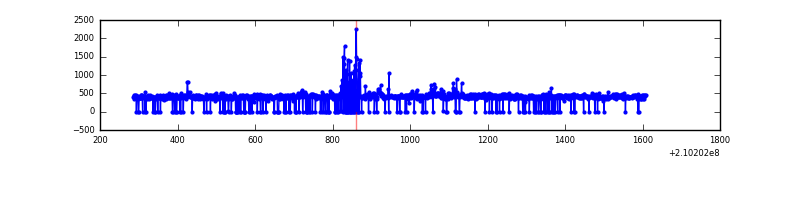 |
| C | 1322 | 1193 | 0 | 0 | 0.00% | 0.00% | 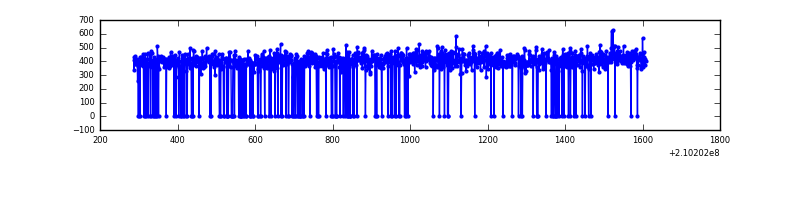 |
| D | 1323 | 1164 | 2 | 2 | 0.15% | 0.17% | 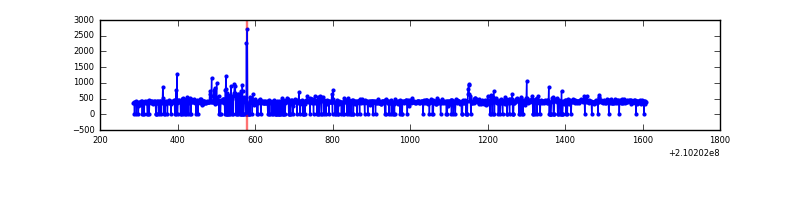 |
Top three noisy pixels from each quadrant. If the there are fewer than three noisy pixels in the level2.evt file, extra rows are filled as -1
| Pixel properties | Quadrant properties | ||||||
|---|---|---|---|---|---|---|---|
| Quadrant | DetID | PixID | Counts | Sigma | Mean | Median | Sigma |
| A | 8 | 15 | 59365 | 2251.81 | 118 | 115 | 26.3 |
| A | 0 | 226 | 1159 | 39.68 | 118 | 115 | 26.3 |
| A | 12 | 194 | 1156 | 39.56 | 118 | 115 | 26.3 |
| B | 0 | 219 | 35448 | 1416.69 | 121 | 117 | 24.9 |
| B | 12 | 111 | 2170 | 82.32 | 121 | 117 | 24.9 |
| B | 11 | 111 | 1668 | 62.19 | 121 | 117 | 24.9 |
| C | 13 | 61 | 956 | 28.19 | 121 | 121 | 29.6 |
| C | 9 | 54 | 780 | 22.25 | 121 | 121 | 29.6 |
| C | 8 | 222 | 717 | 20.12 | 121 | 121 | 29.6 |
| D | 13 | 235 | 24290 | 794.51 | 117 | 114 | 30.4 |
| D | 2 | 234 | 10535 | 342.47 | 117 | 114 | 30.4 |
| D | 7 | 67 | 3698 | 117.78 | 117 | 114 | 30.4 |
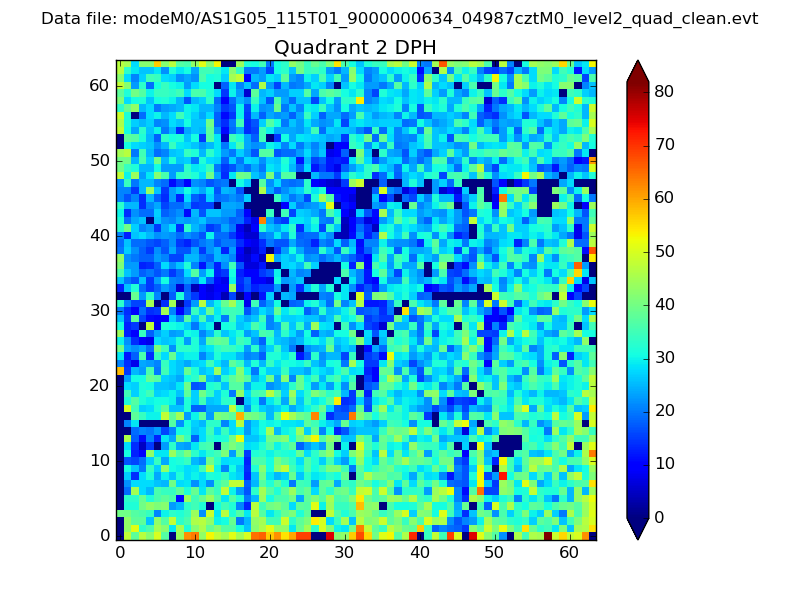
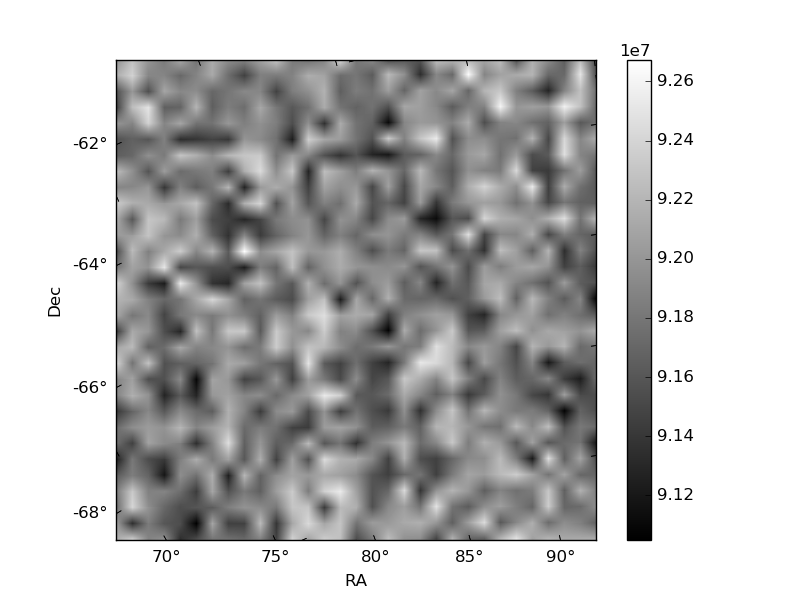
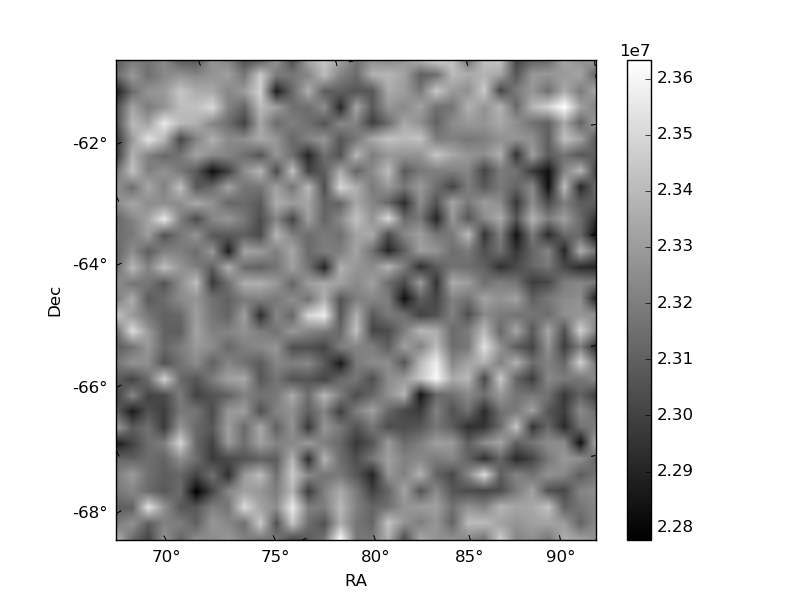
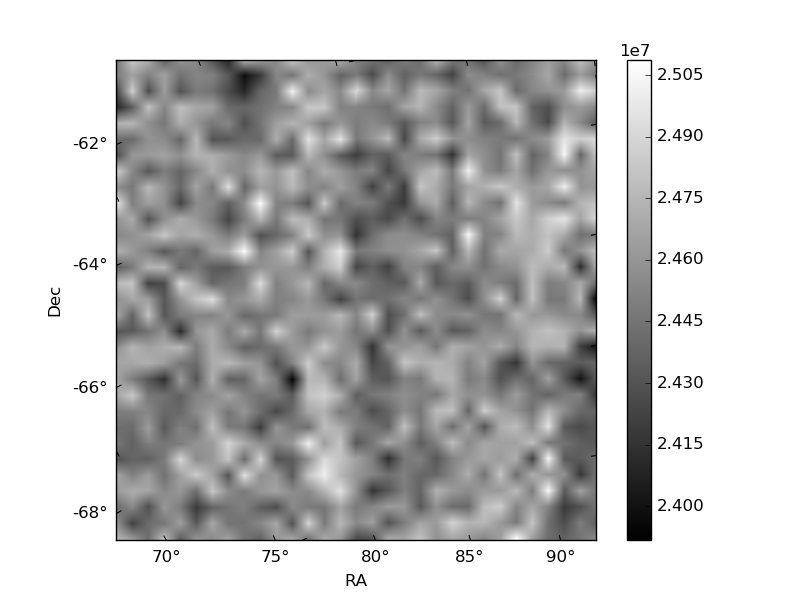
Histogram calculated using DETX and DETY for each event in the final _common_clean file
| Quadrant A | 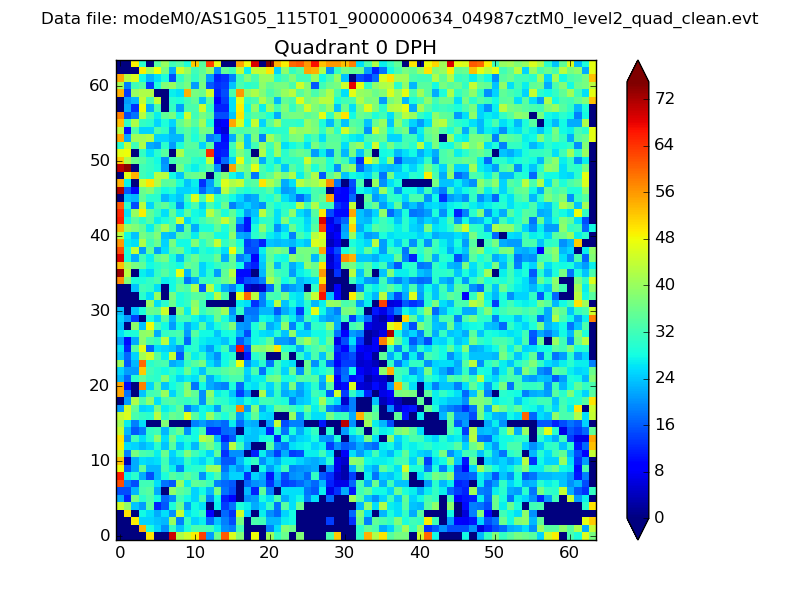 |
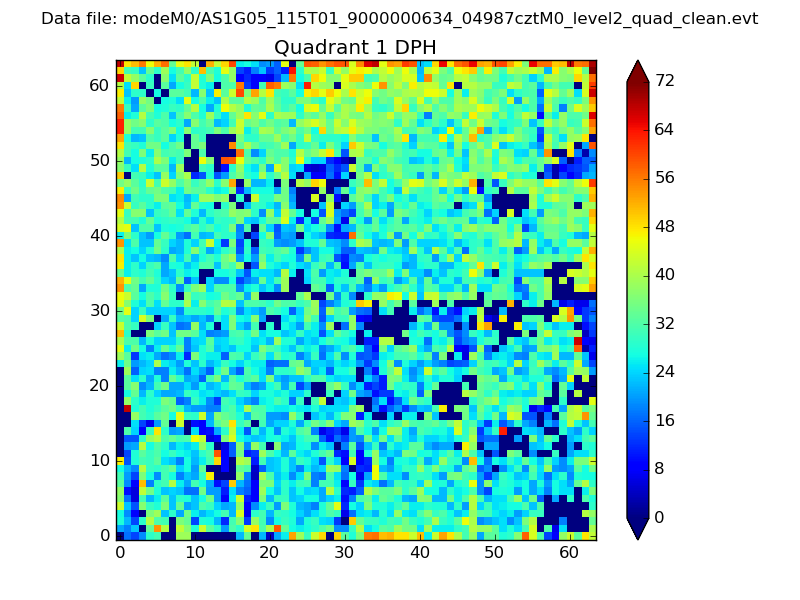 |
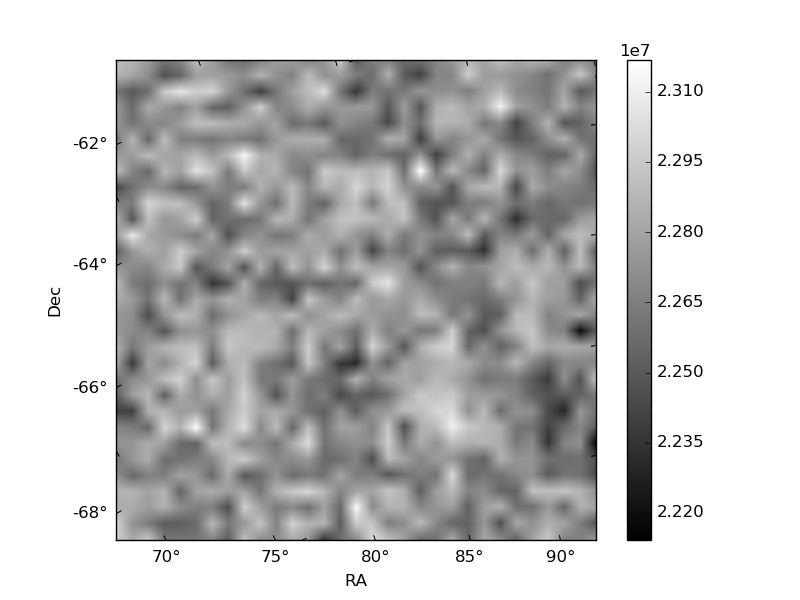
Quadrant B |
|---|---|---|---|
| Quadrant D | 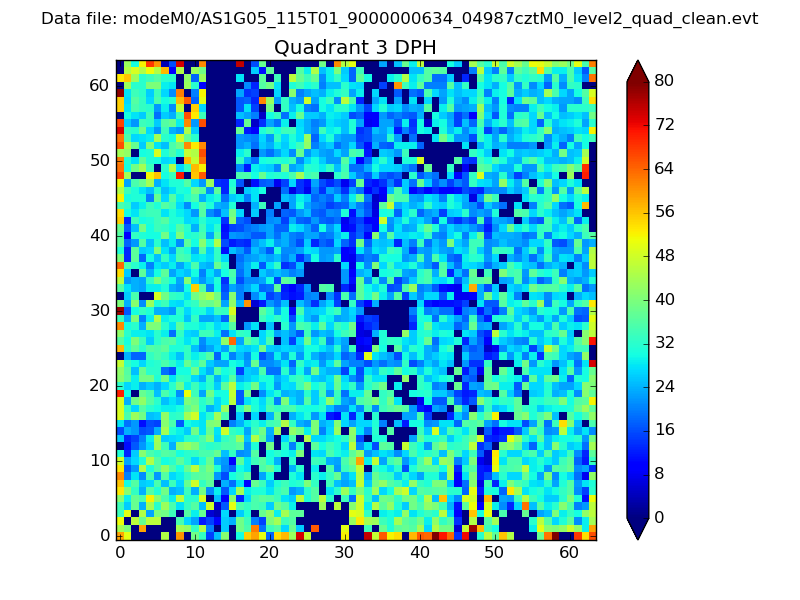 |
 |
Quadrant C |
| Plot type | Count rate plots | Images |
|---|---|---|
| Comparison with Poisson distribution Blue bars denote a histogram of data divided into 1 sec bins. Red curve is a Poisson curve with rate = median count rate of data. |
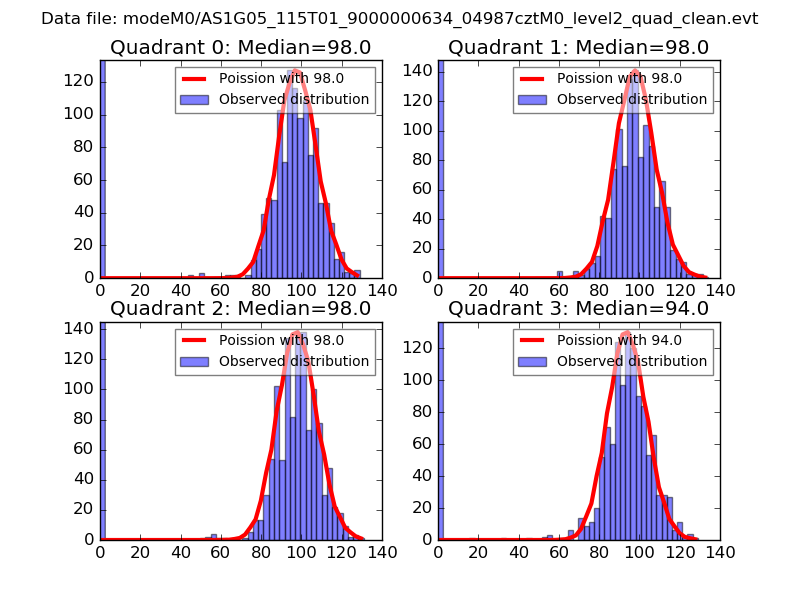 |
 |
| Quadrant-wise count rates Data is divided into 100 sec bins |
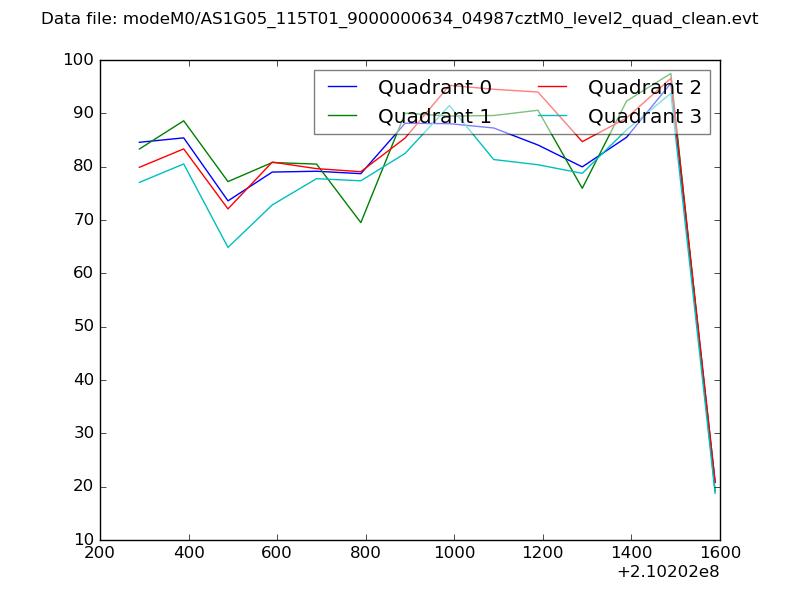 |
|
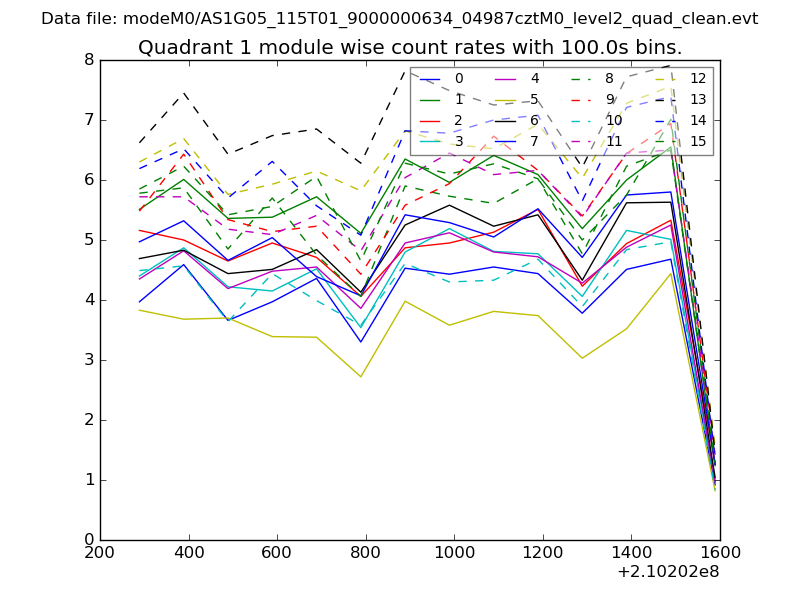
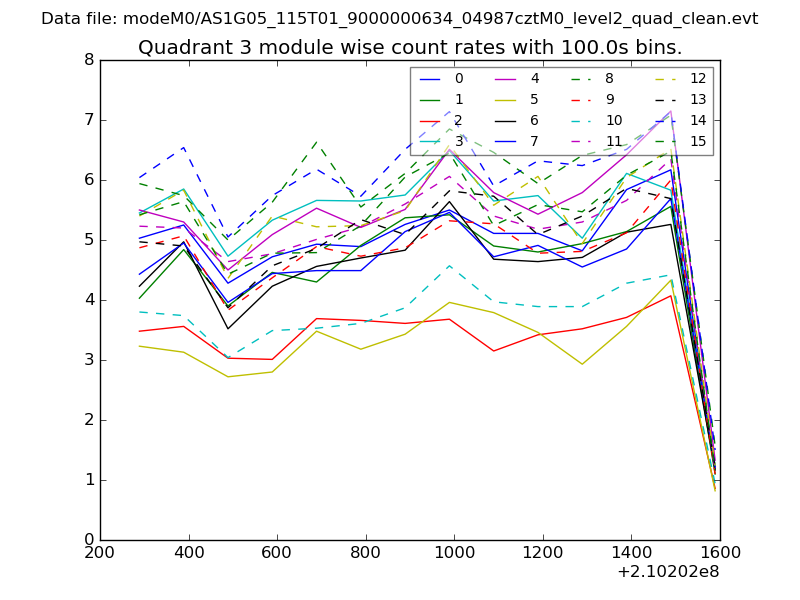
| Module-wise count rates for Quadrant A Data is divided into 100 sec bins |
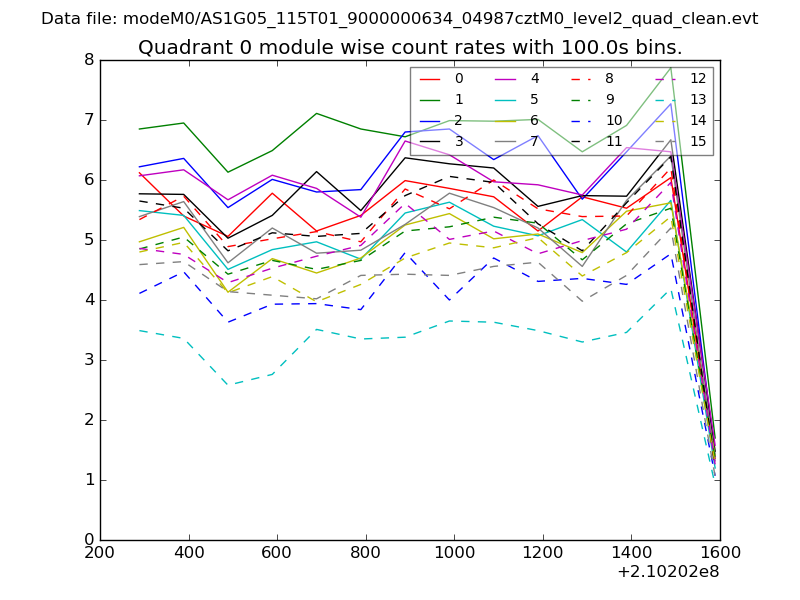 |
 |
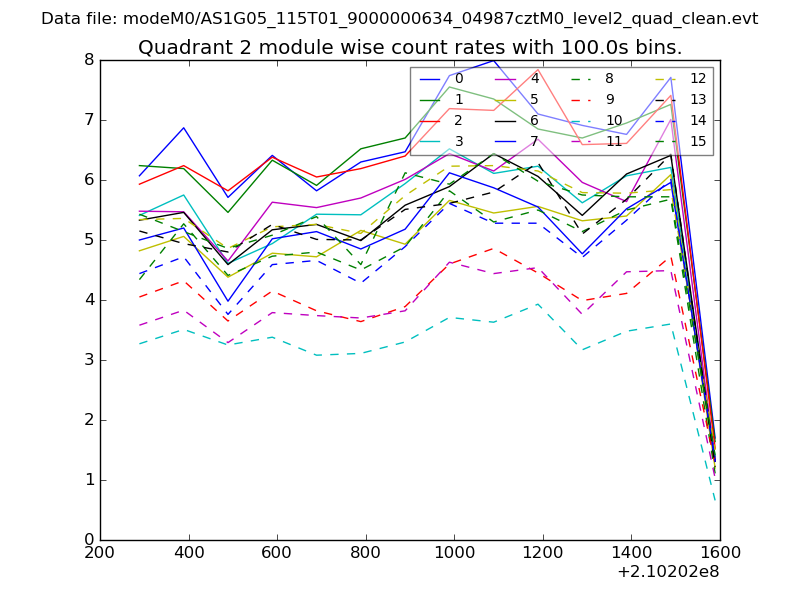
| Module-wise count rates for Quadrant B Data is divided into 100 sec bins |
 |
 |
| Module-wise count rates for Quadrant C Data is divided into 100 sec bins |
 |
 |
| Module-wise count rates for Quadrant D Data is divided into 100 sec bins |
 |
 |
| Parameter | Plot |
|---|---|
| CZT HV Monitor | 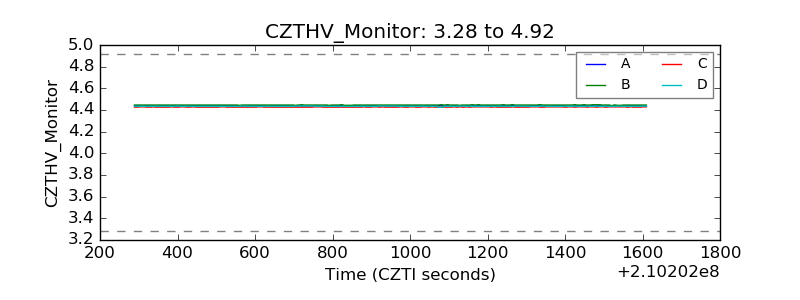 |
| D_VDD | 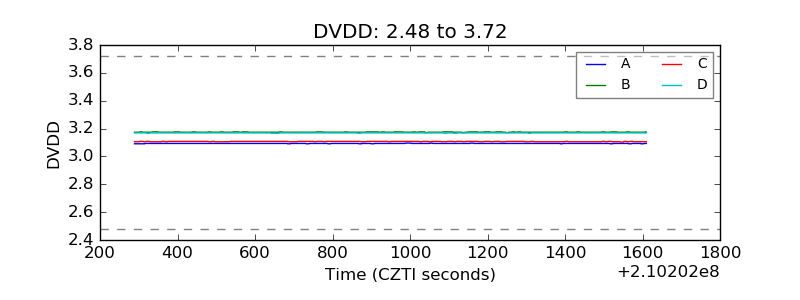 |
| Temperature 1 |  |
| Veto HV Monitor | 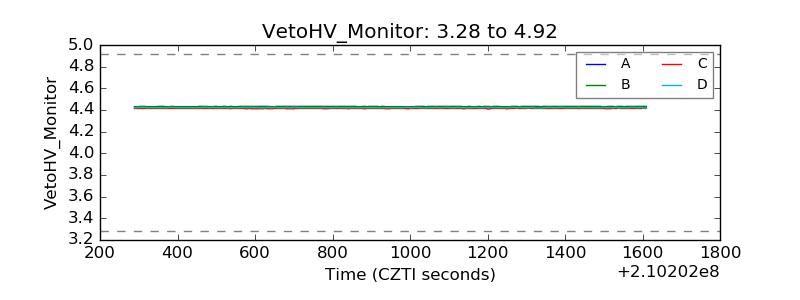 |
| Veto LLD | 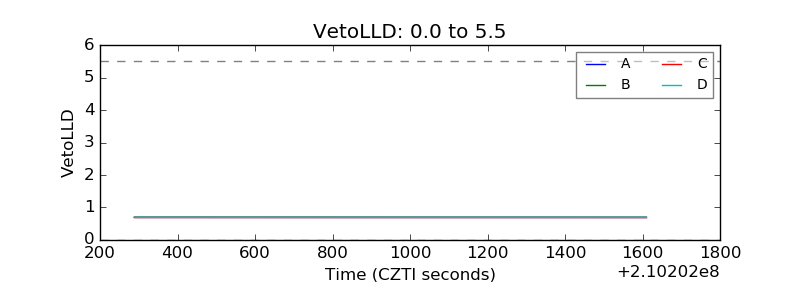 |
| Alpha Counter | 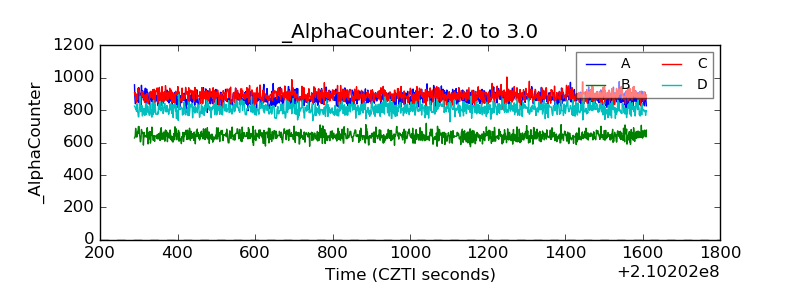 |
| _CPM_Rate | 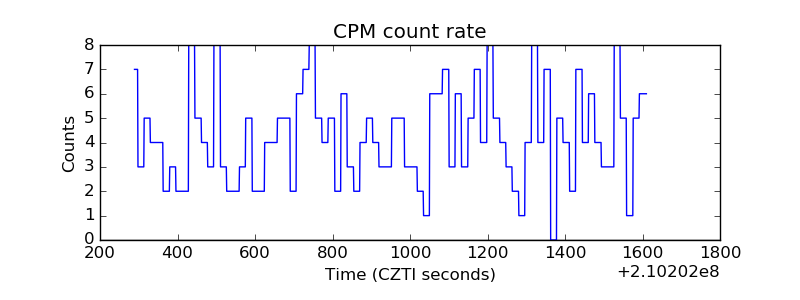 |
| CZT Counter | 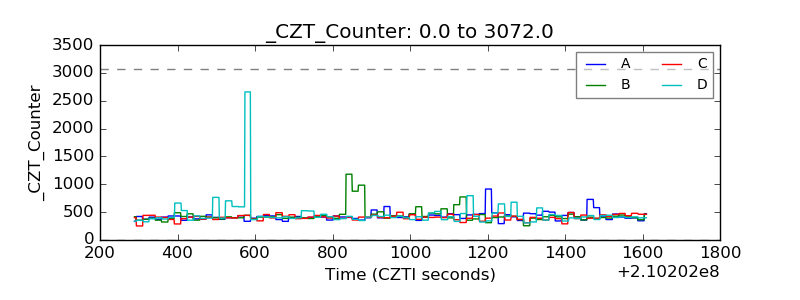 |
| +2.5 Volts monitor |  |
| +5 Volts monitor |  |
| _ROLL_ROT | 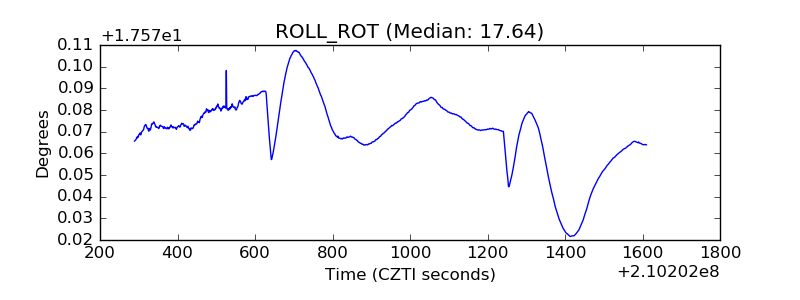 |
| _Roll_DEC |  |
| _Roll_RA | 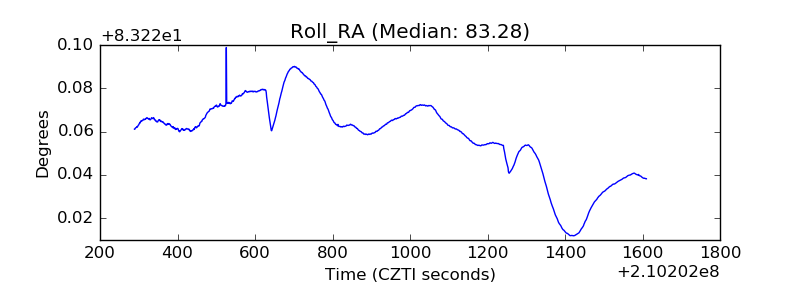 |
| Veto Counter |  |