| Param | Original file | Final file |
|---|---|---|
| Filename | modeM0/AS1G05_115T01_9000000634_04988cztM0_level2.evt | modeM0/AS1G05_115T01_9000000634_04988cztM0_level2_quad_clean.evt |
| Size (bytes) | 39,741,120 | 10,278,720 |
| Size | 37.9 MB | 9.8 MB |
| Events in quadrant A | 317,515 | 63,517 |
| Events in quadrant B | 276,886 | 64,271 |
| Events in quadrant C | 276,038 | 65,571 |
| Events in quadrant D | 284,896 | 63,759 |
| Mode M0 | |||
|---|---|---|---|
| Quadrant | BADHDUFLAG | Total packets | Discarded packets |
| A | 0 | 1484 | 97 |
| B | 0 | 1407 | 94 |
| C | 0 | 1393 | 68 |
| D | 0 | 1411 | 59 |
| Mode SS | |||
|---|---|---|---|
| Quadrant | BADHDUFLAG | Total packets | Discarded packets |
| A | 0 | 14 | 2 |
| B | 0 | 14 | 0 |
| C | 0 | 14 | 0 |
| D | 0 | 14 | 0 |
| Quadrant | Total seconds | Saturated seconds | Saturation percentage |
|---|---|---|---|
| A | 652 | 0 | 0.000000% |
| B | 649 | 0 | 0.000000% |
| C | 661 | 0 | 0.000000% |
| D | 666 | 0 | 0.000000% |
Noise dominated data is calculated using 1-second bins in cleaned event files. If a bin has >2000 counts, and if more than 50% of those come from <1% of pixels, then it is considered to be noise-dominated and hence unusable.
| Quadrant | # 1 sec bins | Bins with >0 counts | Bins with >2000 counts | High rate bins dominated by noise | Noise dominated (total time) | Noise dominated (detector-on time) | Marked lightcurve |
|---|---|---|---|---|---|---|---|
| A | 694 | 659 | 0 | 0 | 0.00% | 0.00% |  |
| B | 693 | 659 | 0 | 0 | 0.00% | 0.00% | 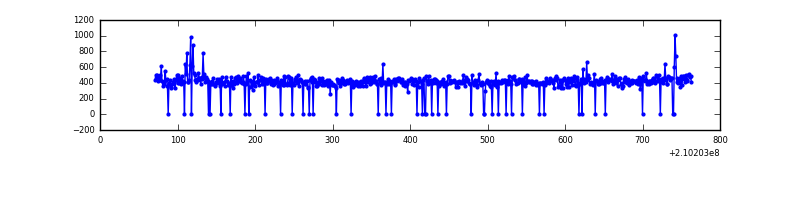 |
| C | 694 | 664 | 0 | 0 | 0.00% | 0.00% | 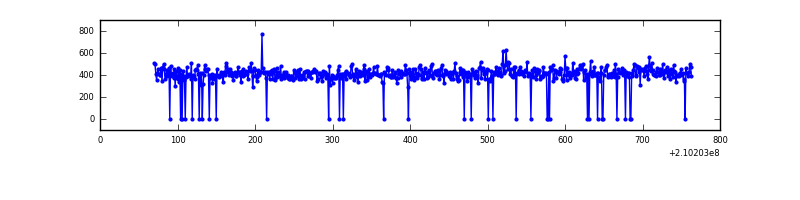 |
| D | 695 | 673 | 0 | 0 | 0.00% | 0.00% | 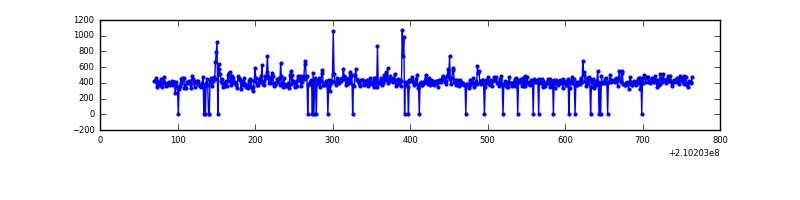 |
Top three noisy pixels from each quadrant. If the there are fewer than three noisy pixels in the level2.evt file, extra rows are filled as -1
| Pixel properties | Quadrant properties | ||||||
|---|---|---|---|---|---|---|---|
| Quadrant | DetID | PixID | Counts | Sigma | Mean | Median | Sigma |
| A | 8 | 15 | 53277 | 3295.88 | 68 | 66 | 16.1 |
| A | 0 | 226 | 716 | 40.26 | 68 | 66 | 16.1 |
| A | 12 | 194 | 652 | 36.3 | 68 | 66 | 16.1 |
| B | 0 | 219 | 8434 | 547.4 | 69 | 67 | 15.3 |
| B | 12 | 111 | 1201 | 74.19 | 69 | 67 | 15.3 |
| B | 11 | 111 | 917 | 55.61 | 69 | 67 | 15.3 |
| C | 9 | 54 | 770 | 38.78 | 70 | 70 | 18.0 |
| C | 13 | 61 | 561 | 27.2 | 70 | 70 | 18.0 |
| C | 14 | 67 | 250 | 9.97 | 70 | 70 | 18.0 |
| D | 2 | 234 | 8802 | 458.59 | 71 | 68 | 19.0 |
| D | 13 | 105 | 2174 | 110.58 | 71 | 68 | 19.0 |
| D | 7 | 67 | 2135 | 108.53 | 71 | 68 | 19.0 |
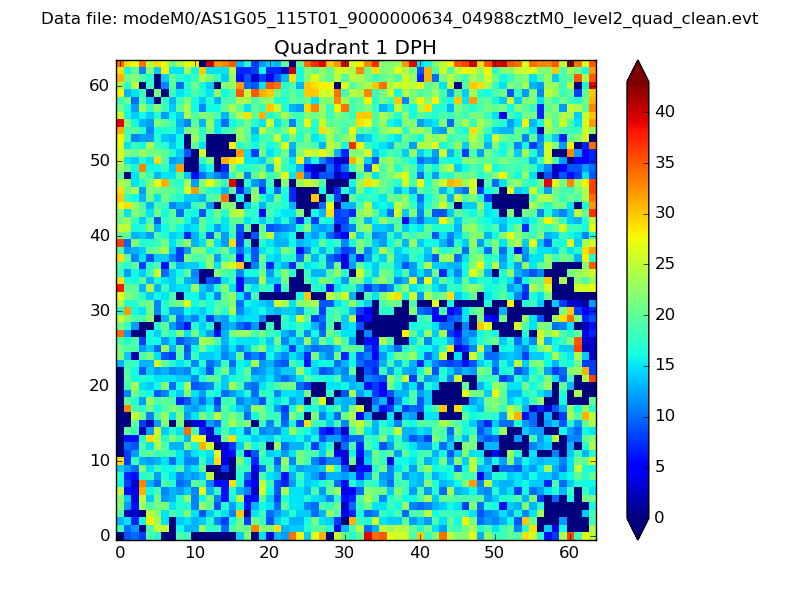
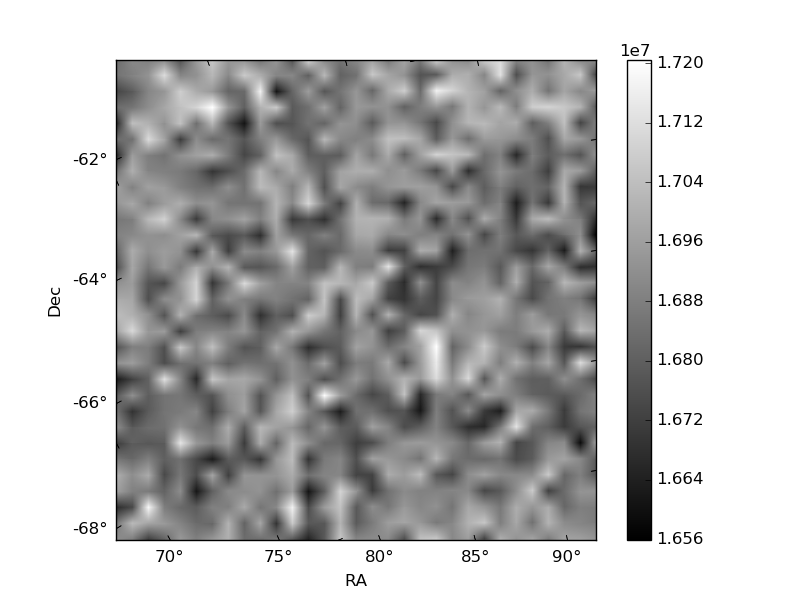
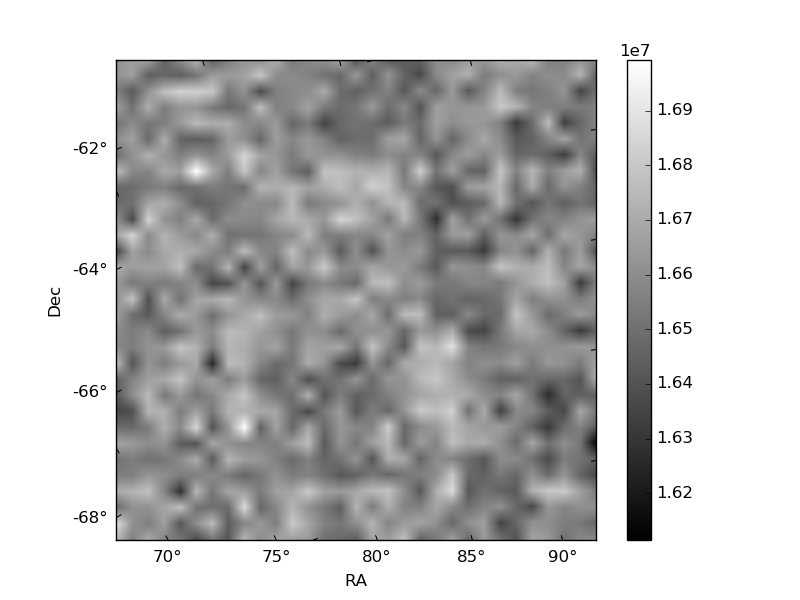
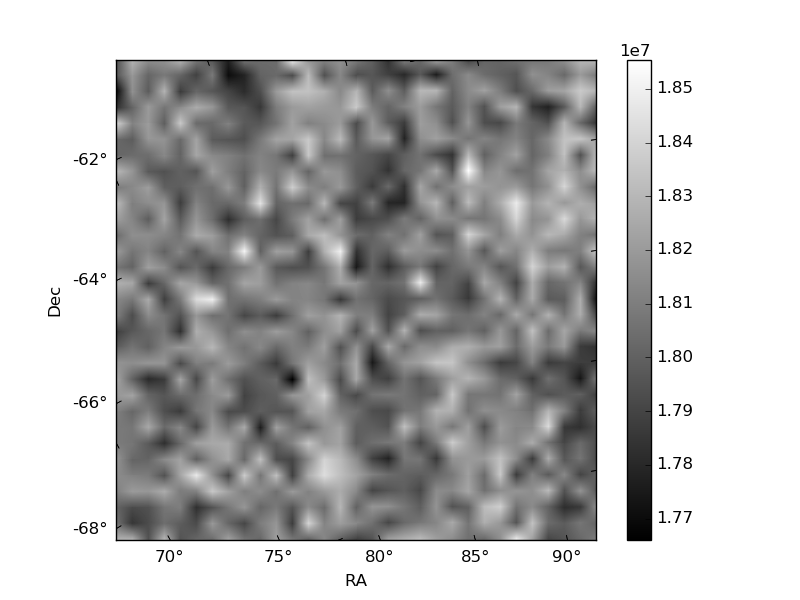
Histogram calculated using DETX and DETY for each event in the final _common_clean file
| Quadrant A | 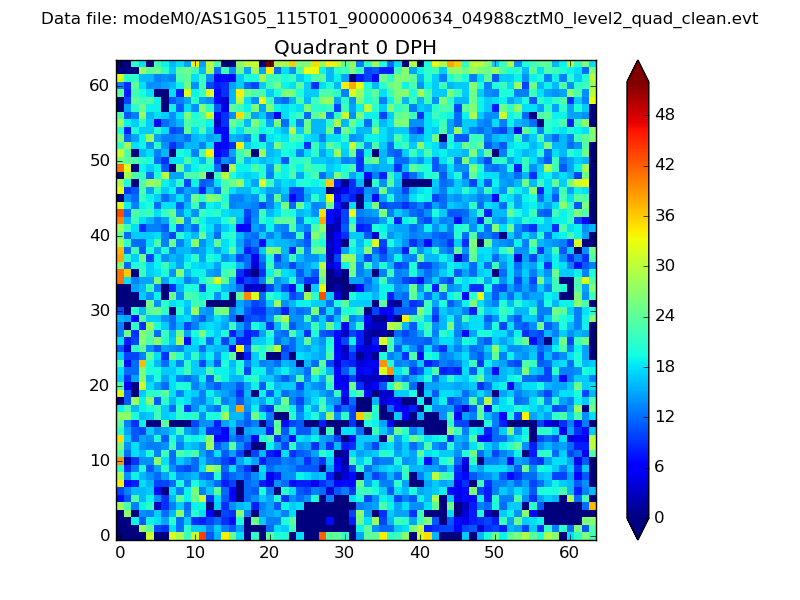 |
 |
Quadrant B |
|---|---|---|---|
| Quadrant D | 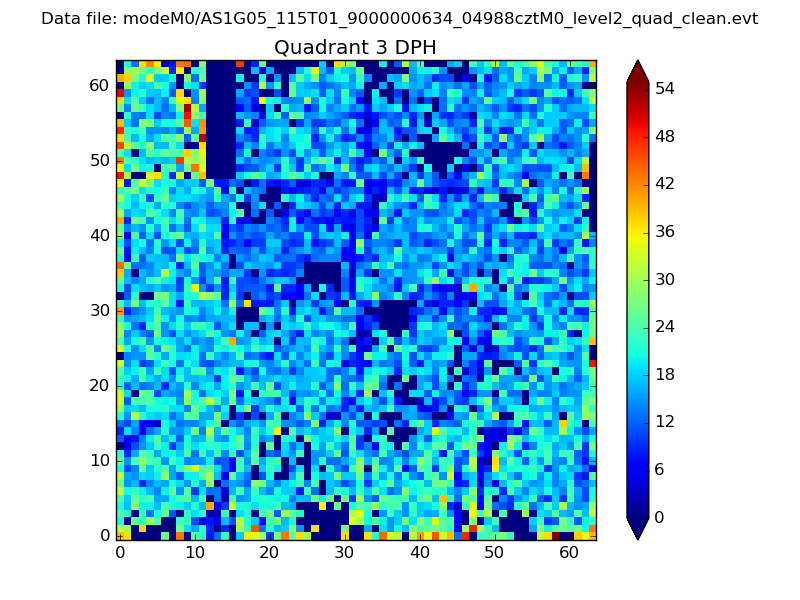 |
 |
Quadrant C |
| Plot type | Count rate plots | Images |
|---|---|---|
| Comparison with Poisson distribution Blue bars denote a histogram of data divided into 1 sec bins. Red curve is a Poisson curve with rate = median count rate of data. |
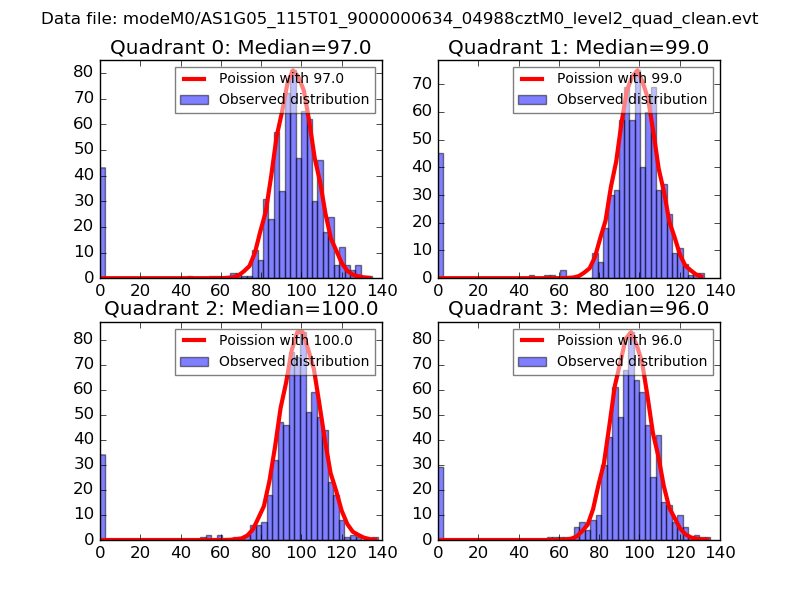 |
 |
| Quadrant-wise count rates Data is divided into 100 sec bins |
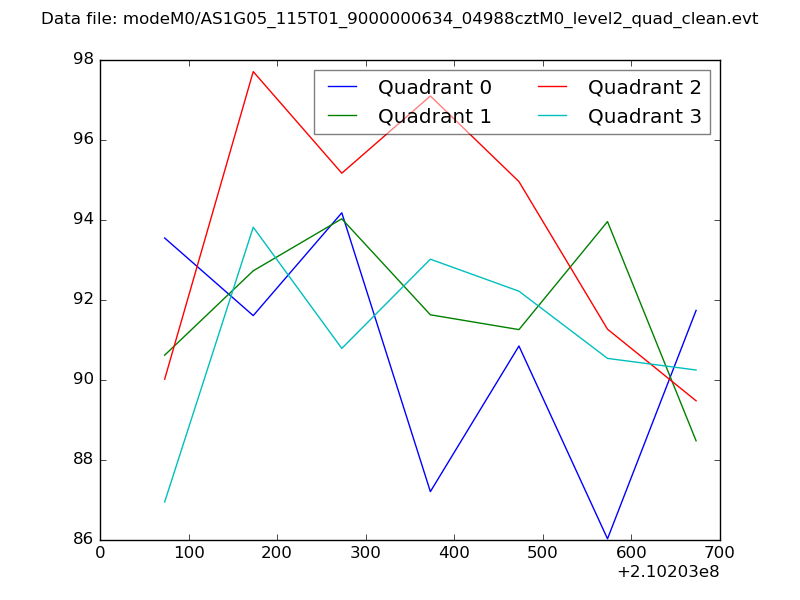 |
|
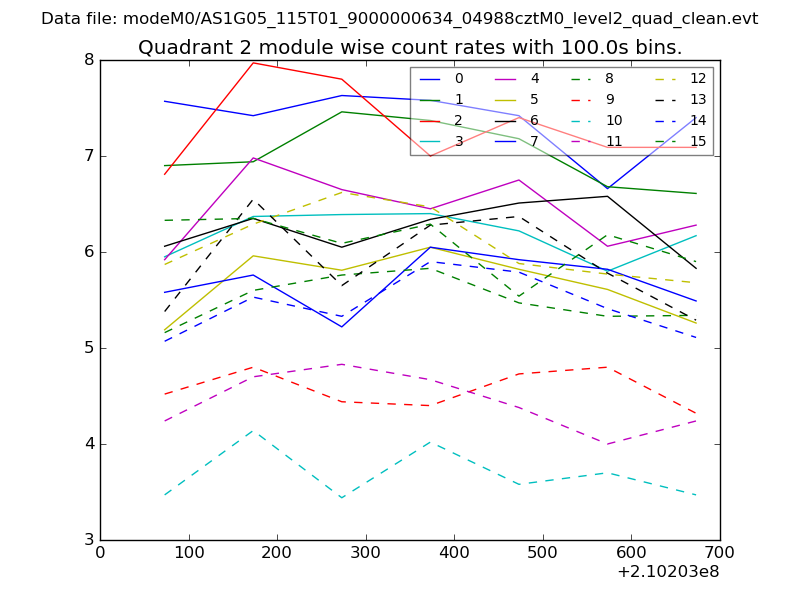
| Module-wise count rates for Quadrant A Data is divided into 100 sec bins |
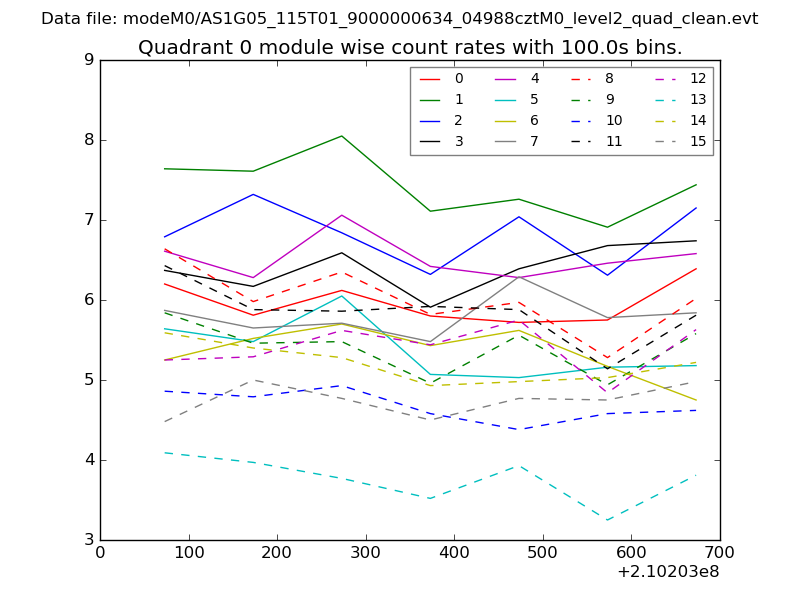 |
 |
| Module-wise count rates for Quadrant B Data is divided into 100 sec bins |
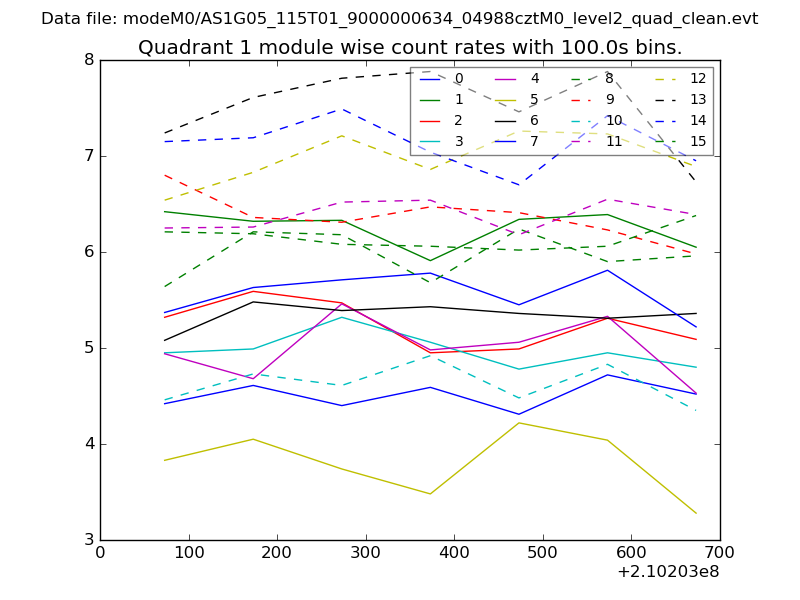 |
 |
| Module-wise count rates for Quadrant C Data is divided into 100 sec bins |
 |
 |
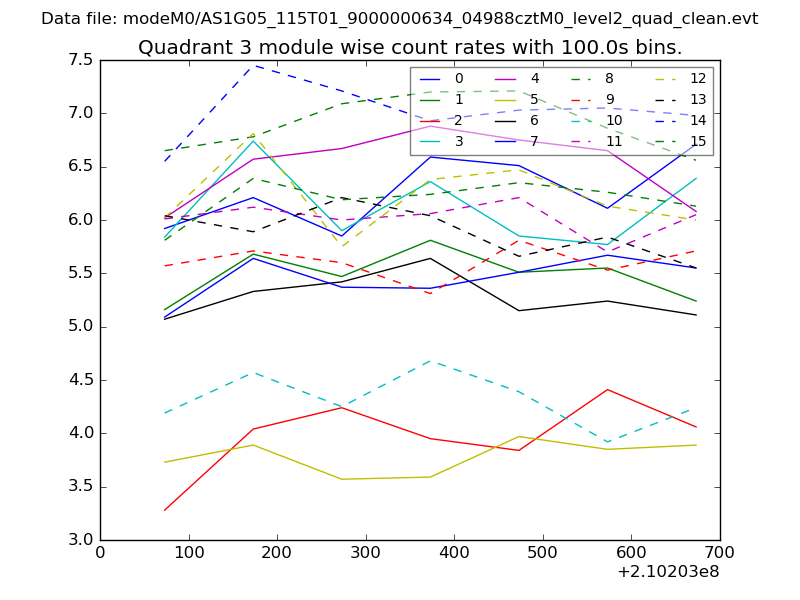
| Module-wise count rates for Quadrant D Data is divided into 100 sec bins |
 |
 |
| Parameter | Plot |
|---|---|
| CZT HV Monitor | 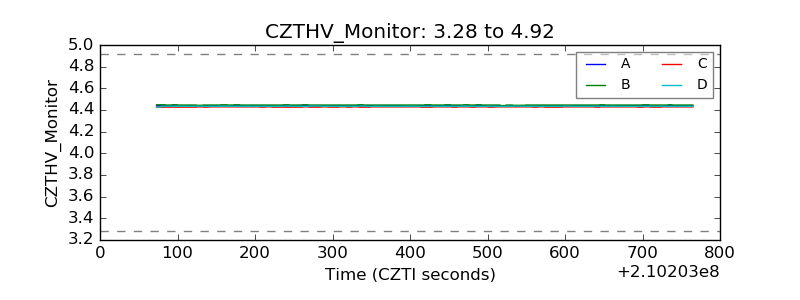 |
| D_VDD | 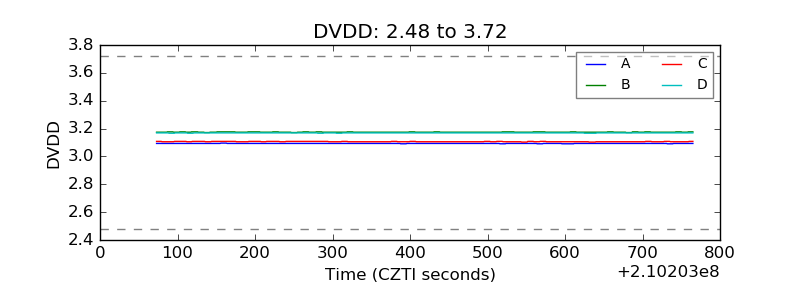 |
| Temperature 1 | 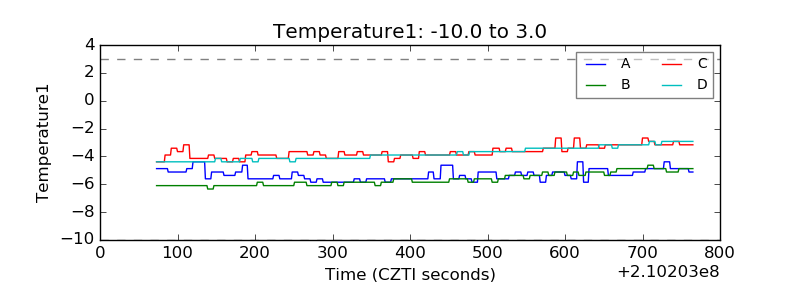 |
| Veto HV Monitor |  |
| Veto LLD | 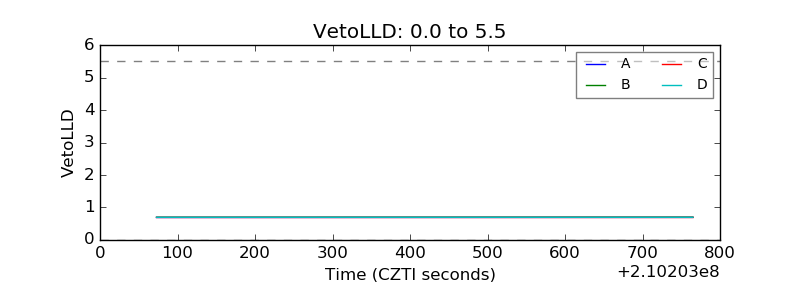 |
| Alpha Counter | 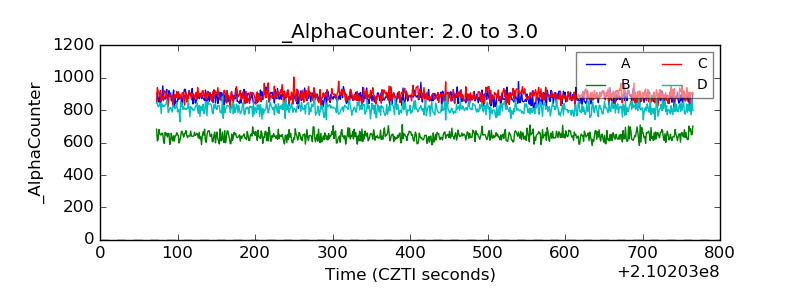 |
| _CPM_Rate | 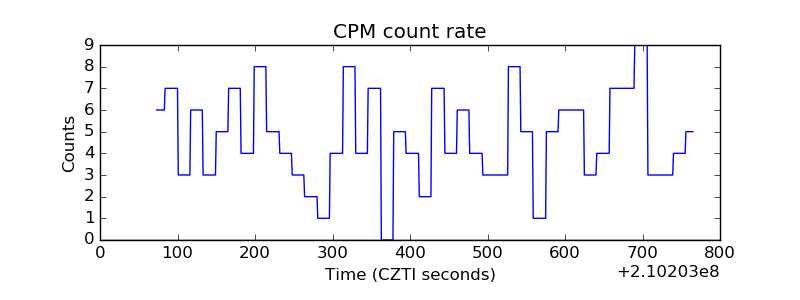 |
| CZT Counter | 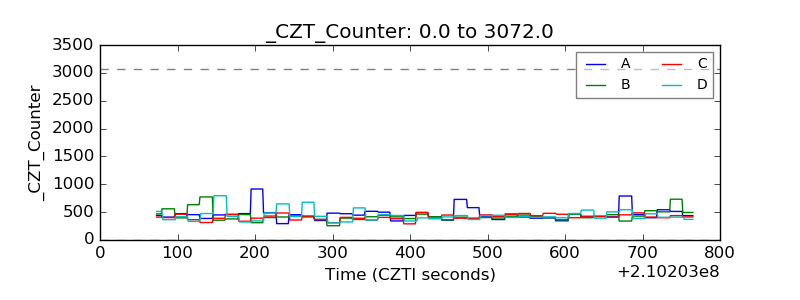 |
| +2.5 Volts monitor |  |
| +5 Volts monitor |  |
| _ROLL_ROT | 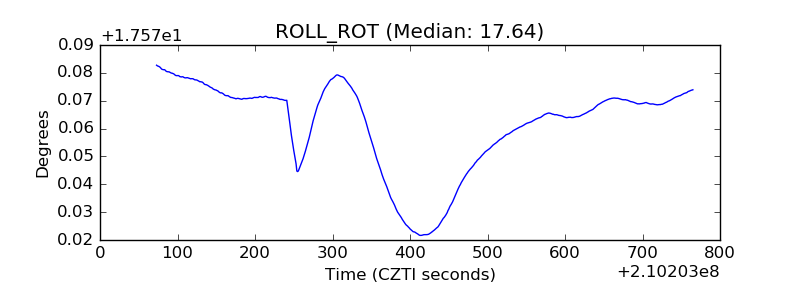 |
| _Roll_DEC | 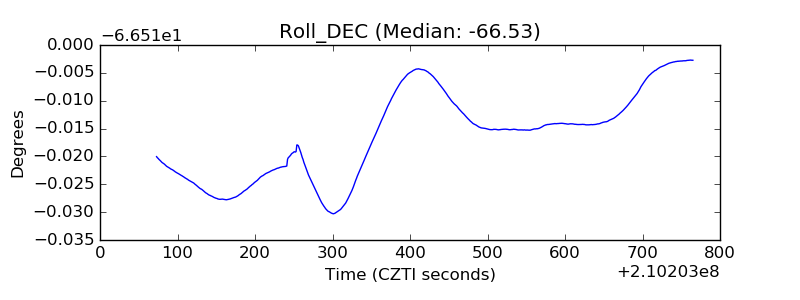 |
| _Roll_RA |  |
| Veto Counter | 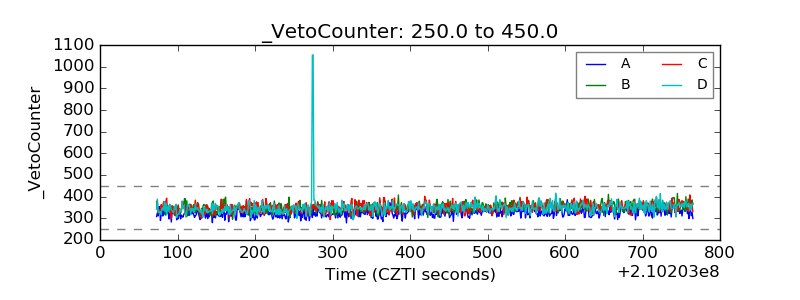 |