| Param | Original file | Final file |
|---|---|---|
| Filename | modeM0/AS1G05_115T01_9000000634_04990cztM0_level2.evt | modeM0/AS1G05_115T01_9000000634_04990cztM0_level2_quad_clean.evt |
| Size (bytes) | 1,037,851,200 | 184,489,920 |
| Size | 989.8 MB | 175.9 MB |
| Events in quadrant A | 6,893,506 | 1,135,013 |
| Events in quadrant B | 7,475,225 | 1,148,293 |
| Events in quadrant C | 6,659,505 | 1,153,140 |
| Events in quadrant D | 9,370,776 | 1,098,615 |
| Mode M9 | |||
|---|---|---|---|
| Quadrant | BADHDUFLAG | Total packets | Discarded packets |
| A | 0 | 19 | 0 |
| B | 0 | 19 | 0 |
| C | 0 | 19 | 0 |
| D | 0 | 19 | 0 |
| Mode M0 | |||
|---|---|---|---|
| Quadrant | BADHDUFLAG | Total packets | Discarded packets |
| A | 0 | 31255 | 4 |
| B | 0 | 32538 | 3 |
| C | 0 | 30762 | 3 |
| D | 0 | 38897 | 3 |
| Mode SS | |||
|---|---|---|---|
| Quadrant | BADHDUFLAG | Total packets | Discarded packets |
| A | 0 | 310 | 0 |
| B | 0 | 310 | 0 |
| C | 0 | 310 | 0 |
| D | 0 | 310 | 0 |
| Quadrant | Total seconds | Saturated seconds | Saturation percentage |
|---|---|---|---|
| A | 15256 | 73 | 0.478500% |
| B | 15256 | 146 | 0.957001% |
| C | 15256 | 45 | 0.294966% |
| D | 15256 | 652 | 4.273728% |
Noise dominated data is calculated using 1-second bins in cleaned event files. If a bin has >2000 counts, and if more than 50% of those come from <1% of pixels, then it is considered to be noise-dominated and hence unusable.
| Quadrant | # 1 sec bins | Bins with >0 counts | Bins with >2000 counts | High rate bins dominated by noise | Noise dominated (total time) | Noise dominated (detector-on time) | Marked lightcurve |
|---|---|---|---|---|---|---|---|
| A | 17075 | 15255 | 11 | 11 | 0.06% | 0.07% | 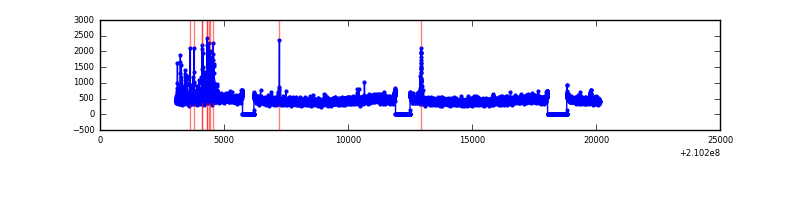 |
| B | 17075 | 15255 | 30 | 30 | 0.18% | 0.20% | 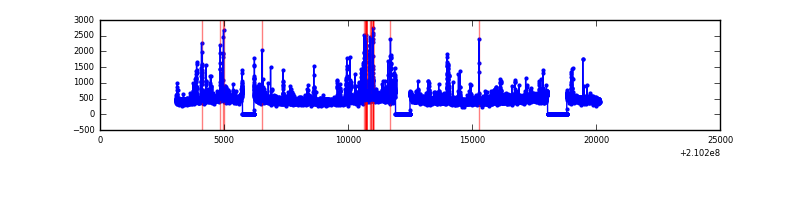 |
| C | 17075 | 15256 | 0 | 0 | 0.00% | 0.00% | 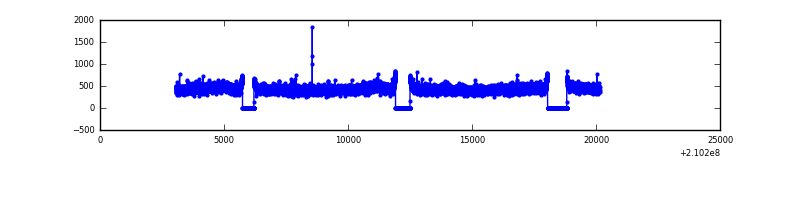 |
| D | 17075 | 15255 | 447 | 447 | 2.62% | 2.93% | 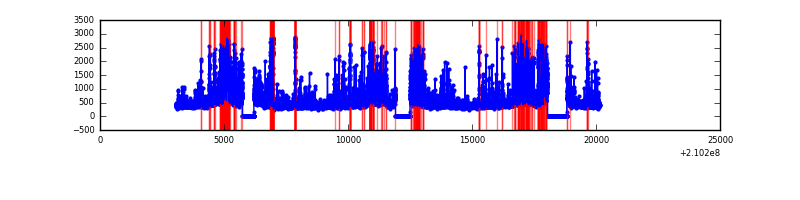 |
Top three noisy pixels from each quadrant. If the there are fewer than three noisy pixels in the level2.evt file, extra rows are filled as -1
| Pixel properties | Quadrant properties | ||||||
|---|---|---|---|---|---|---|---|
| Quadrant | DetID | PixID | Counts | Sigma | Mean | Median | Sigma |
| A | 8 | 15 | 156445 | 438.84 | 1731 | 1693 | 352.6 |
| A | 0 | 50 | 51491 | 141.22 | 1731 | 1693 | 352.6 |
| A | 12 | 194 | 17386 | 44.5 | 1731 | 1693 | 352.6 |
| B | 0 | 219 | 443700 | 1315.09 | 1754 | 1707 | 336.1 |
| B | 8 | 3 | 124844 | 366.38 | 1754 | 1707 | 336.1 |
| B | 4 | 48 | 51115 | 147.01 | 1754 | 1707 | 336.1 |
| C | 13 | 61 | 14058 | 31.51 | 1702 | 1707 | 392.0 |
| C | 9 | 54 | 10773 | 23.13 | 1702 | 1707 | 392.0 |
| C | 12 | 4 | 6095 | 11.19 | 1702 | 1707 | 392.0 |
| D | 2 | 33 | 1037141 | 2532.08 | 1675 | 1623 | 409.0 |
| D | 13 | 235 | 718030 | 1751.78 | 1675 | 1623 | 409.0 |
| D | 2 | 136 | 288702 | 701.97 | 1675 | 1623 | 409.0 |
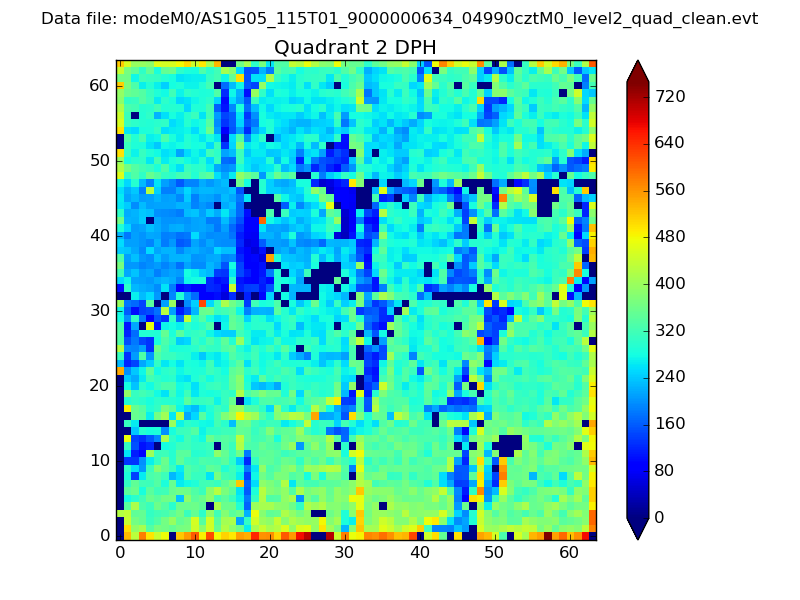
Histogram calculated using DETX and DETY for each event in the final _common_clean file
| Quadrant A |  |
 |
Quadrant B |
|---|---|---|---|
| Quadrant D | 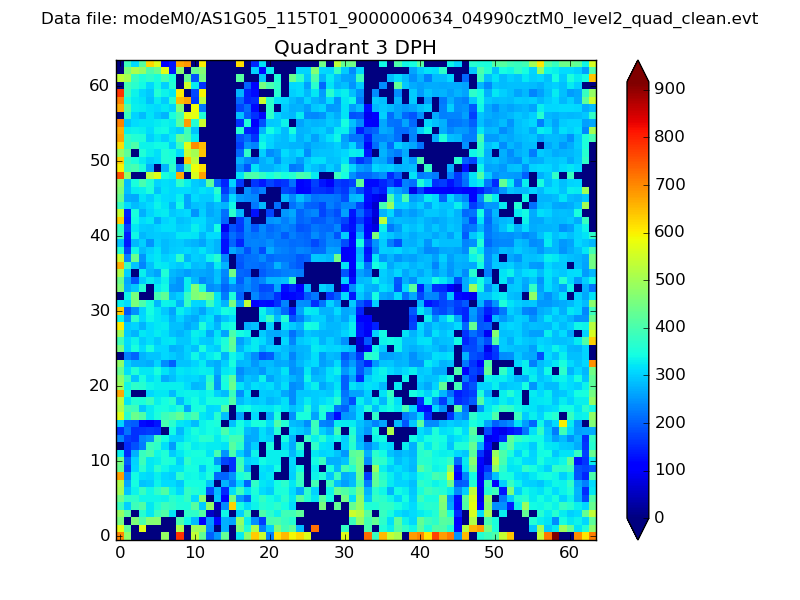 |
 |
Quadrant C |
| Plot type | Count rate plots | Images |
|---|---|---|
| Comparison with Poisson distribution Blue bars denote a histogram of data divided into 1 sec bins. Red curve is a Poisson curve with rate = median count rate of data. |
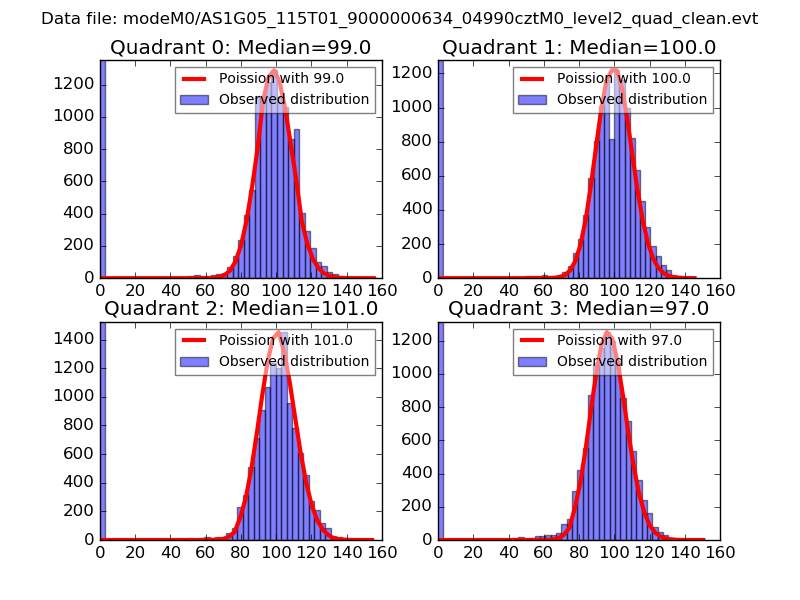 |
 |
| Quadrant-wise count rates Data is divided into 100 sec bins |
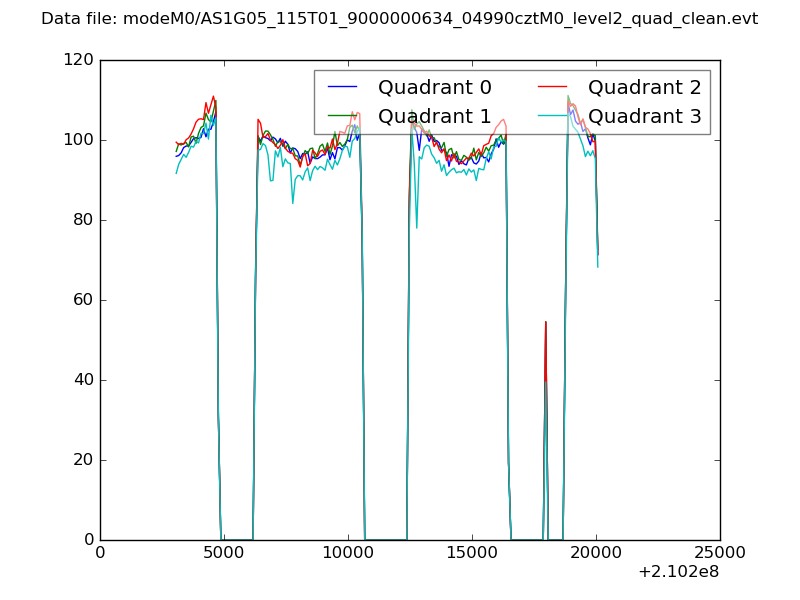 |
|
| Module-wise count rates for Quadrant A Data is divided into 100 sec bins |
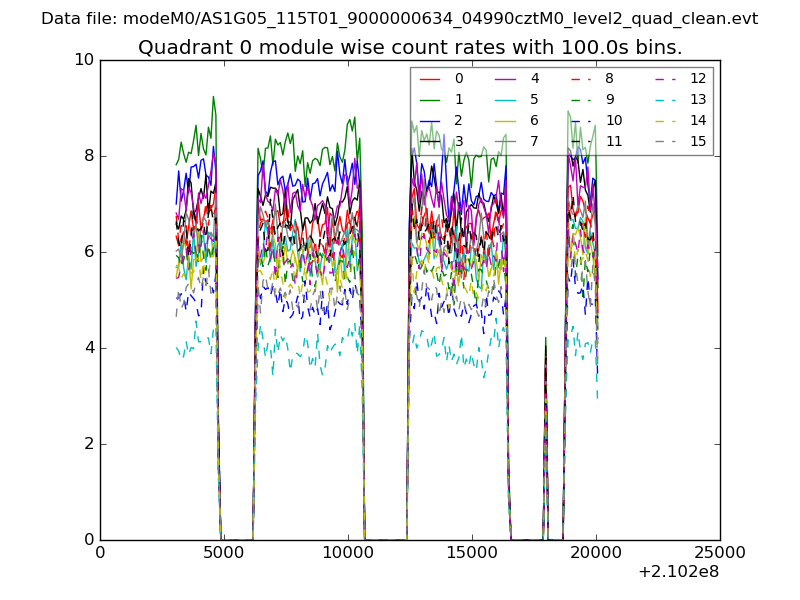 |
 |
| Module-wise count rates for Quadrant B Data is divided into 100 sec bins |
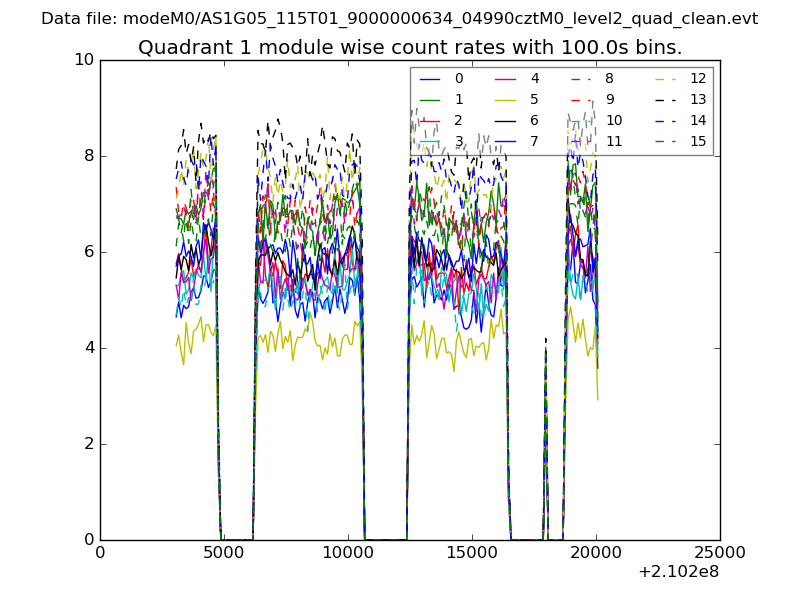 |
 |
| Module-wise count rates for Quadrant C Data is divided into 100 sec bins |
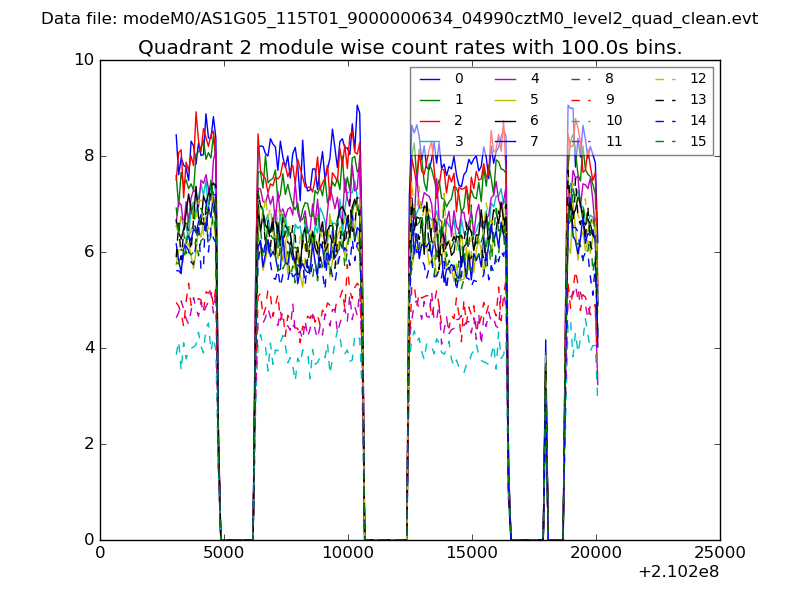 |
 |
| Module-wise count rates for Quadrant D Data is divided into 100 sec bins |
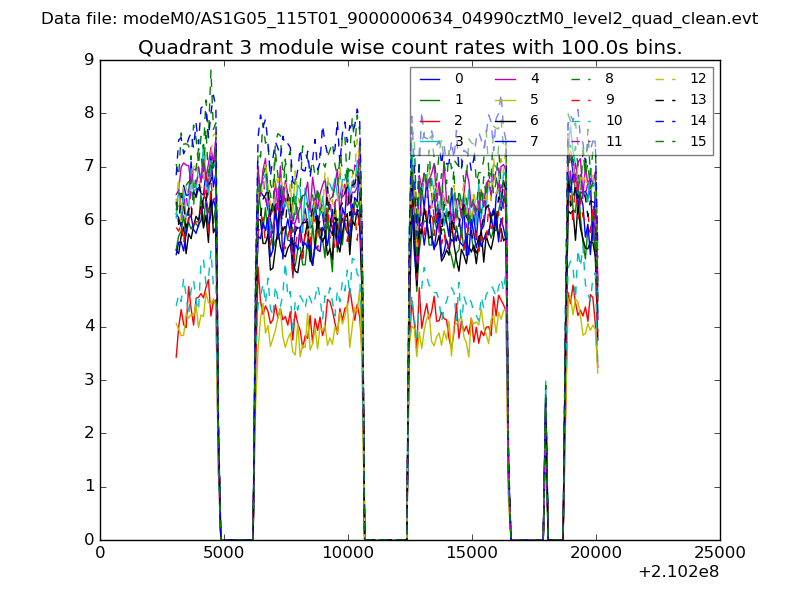 |
 |
| Parameter | Plot |
|---|---|
| CZT HV Monitor | 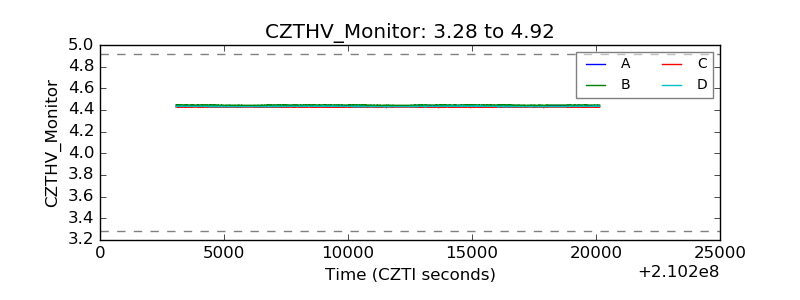 |
| D_VDD | 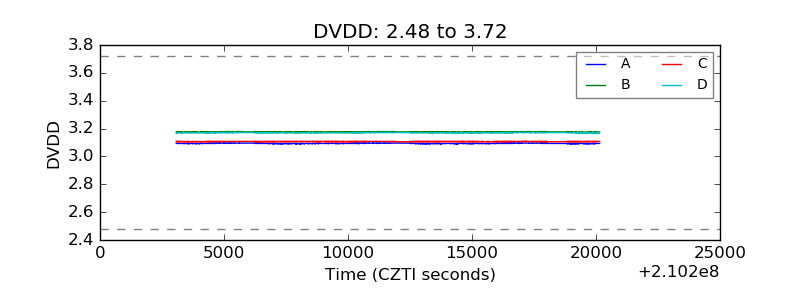 |
| Temperature 1 |  |
| Veto HV Monitor | 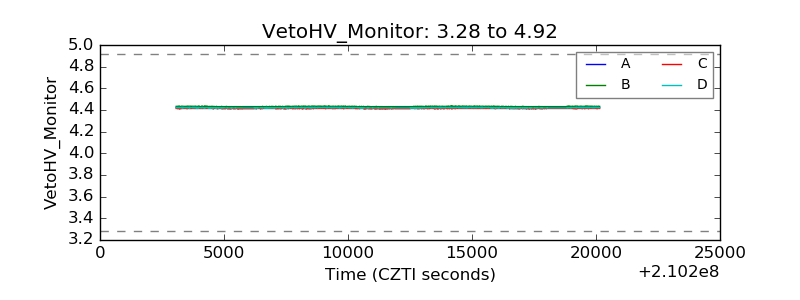 |
| Veto LLD | 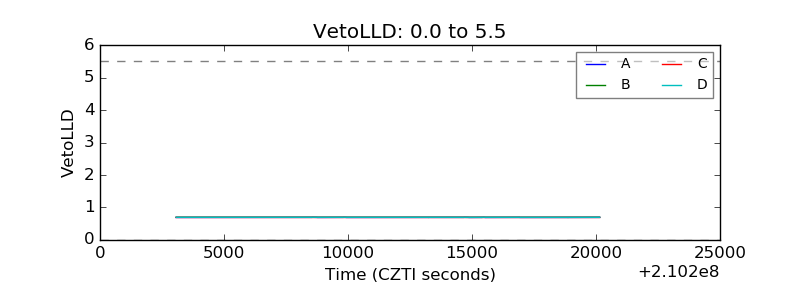 |
| Alpha Counter | 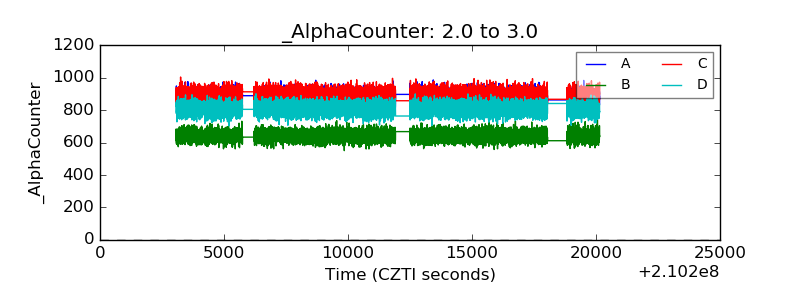 |
| _CPM_Rate | 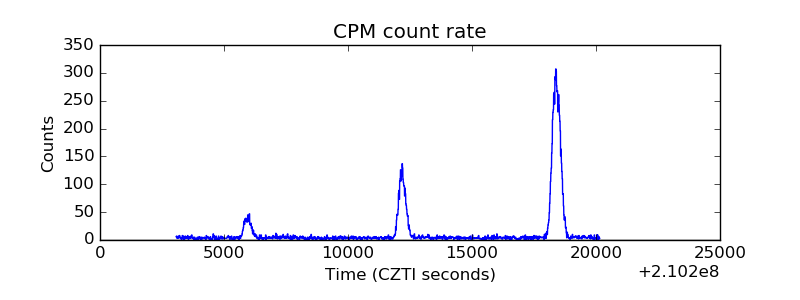 |
| CZT Counter | 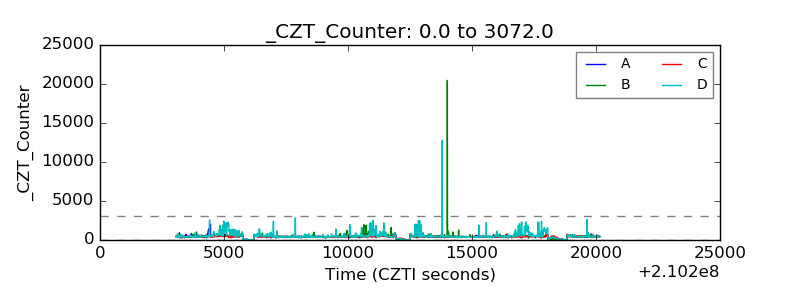 |
| +2.5 Volts monitor |  |
| +5 Volts monitor | 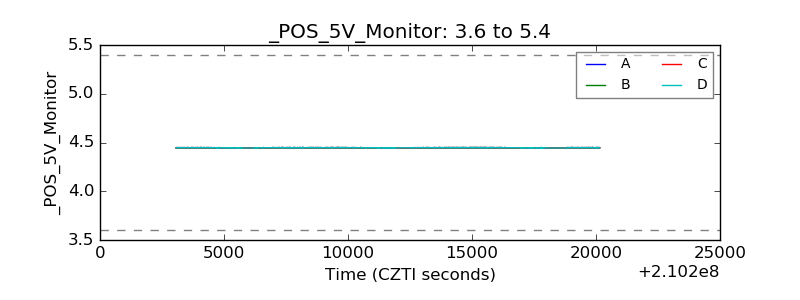 |
| _ROLL_ROT | 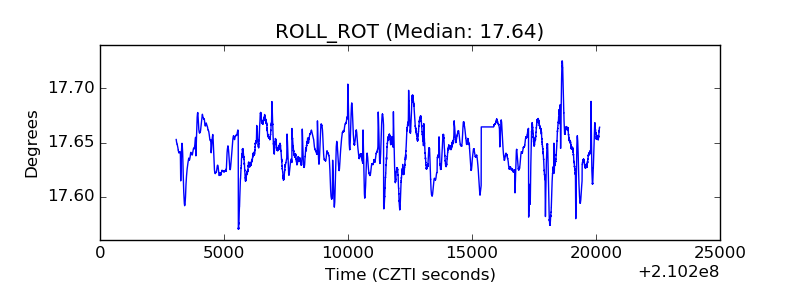 |
| _Roll_DEC | 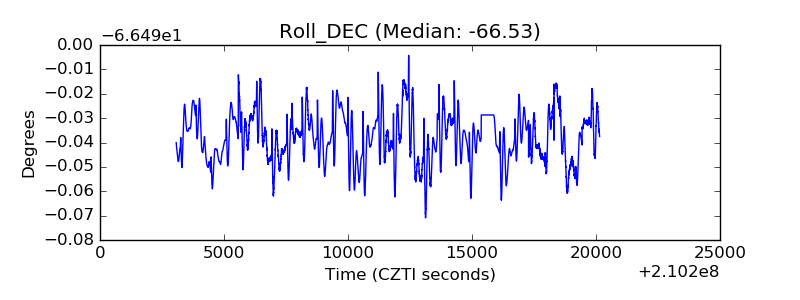 |
| _Roll_RA | 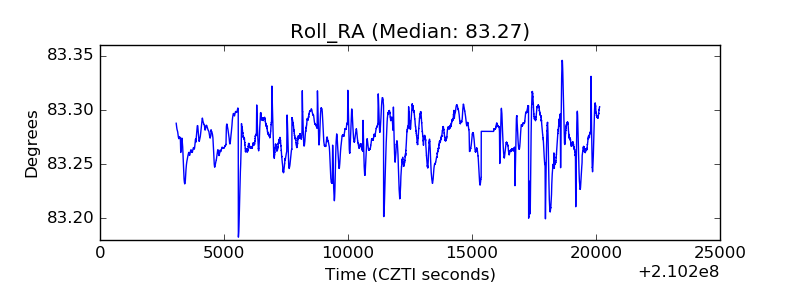 |
| Veto Counter | 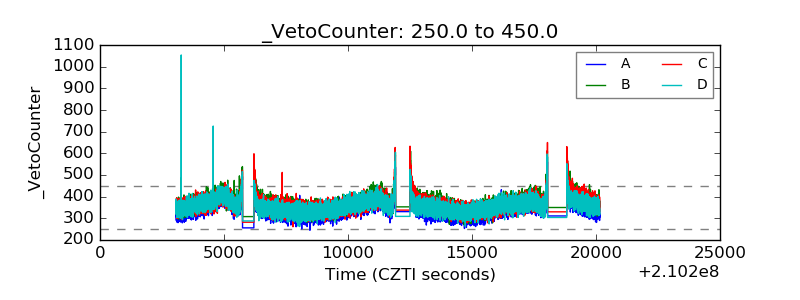 |