| Param | Original file | Final file |
|---|---|---|
| Filename | modeM0/AS1G05_115T01_9000000634_04994cztM0_level2.evt | modeM0/AS1G05_115T01_9000000634_04994cztM0_level2_quad_clean.evt |
| Size (bytes) | 464,765,760 | 74,934,720 |
| Size | 443.2 MB | 71.5 MB |
| Events in quadrant A | 2,985,429 | 464,190 |
| Events in quadrant B | 3,329,413 | 469,757 |
| Events in quadrant C | 2,832,708 | 466,322 |
| Events in quadrant D | 4,512,824 | 442,057 |
| Mode M9 | |||
|---|---|---|---|
| Quadrant | BADHDUFLAG | Total packets | Discarded packets |
| A | 0 | 12 | 0 |
| B | 0 | 12 | 0 |
| C | 0 | 12 | 0 |
| D | 0 | 12 | 0 |
| Mode M0 | |||
|---|---|---|---|
| Quadrant | BADHDUFLAG | Total packets | Discarded packets |
| A | 0 | 12771 | 2 |
| B | 0 | 13766 | 1 |
| C | 0 | 12573 | 1 |
| D | 0 | 17502 | 1 |
| Mode SS | |||
|---|---|---|---|
| Quadrant | BADHDUFLAG | Total packets | Discarded packets |
| A | 0 | 124 | 0 |
| B | 0 | 124 | 0 |
| C | 0 | 124 | 0 |
| D | 0 | 124 | 0 |
| Quadrant | Total seconds | Saturated seconds | Saturation percentage |
|---|---|---|---|
| A | 6111 | 96 | 1.570938% |
| B | 6111 | 90 | 1.472754% |
| C | 6111 | 63 | 1.030928% |
| D | 6111 | 472 | 7.723777% |
Noise dominated data is calculated using 1-second bins in cleaned event files. If a bin has >2000 counts, and if more than 50% of those come from <1% of pixels, then it is considered to be noise-dominated and hence unusable.
| Quadrant | # 1 sec bins | Bins with >0 counts | Bins with >2000 counts | High rate bins dominated by noise | Noise dominated (total time) | Noise dominated (detector-on time) | Marked lightcurve |
|---|---|---|---|---|---|---|---|
| A | 7356 | 6112 | 1 | 1 | 0.01% | 0.02% | 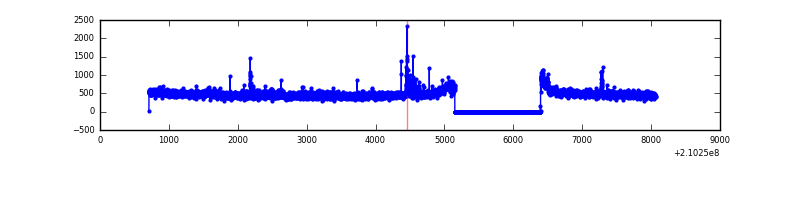 |
| B | 7356 | 6112 | 4 | 4 | 0.05% | 0.07% | 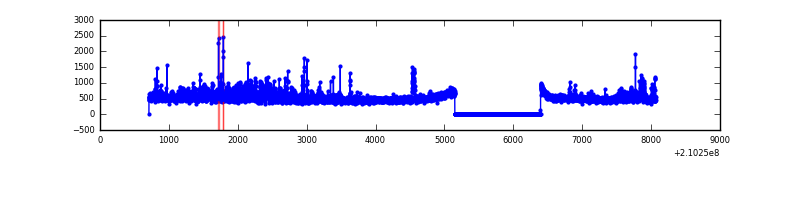 |
| C | 7356 | 6112 | 3 | 3 | 0.04% | 0.05% | 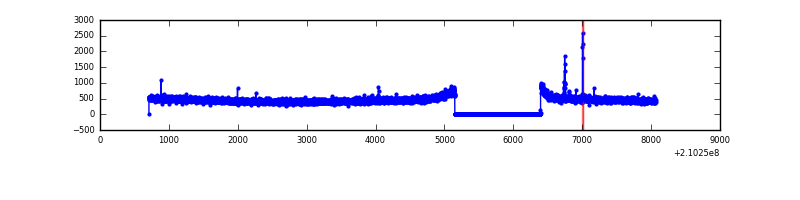 |
| D | 7356 | 6112 | 386 | 386 | 5.25% | 6.32% | 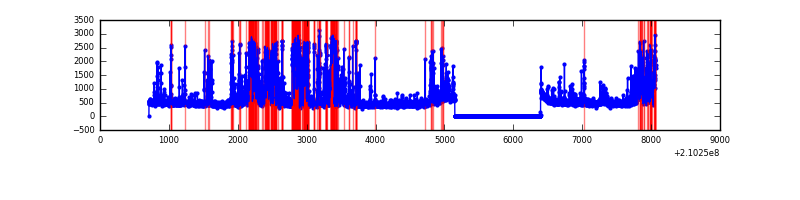 |
Top three noisy pixels from each quadrant. If the there are fewer than three noisy pixels in the level2.evt file, extra rows are filled as -1
| Pixel properties | Quadrant properties | ||||||
|---|---|---|---|---|---|---|---|
| Quadrant | DetID | PixID | Counts | Sigma | Mean | Median | Sigma |
| A | 13 | 251 | 63035 | 415.19 | 745 | 729 | 150.1 |
| A | 4 | 2 | 39539 | 258.62 | 745 | 729 | 150.1 |
| A | 15 | 234 | 10343 | 64.06 | 745 | 729 | 150.1 |
| B | 15 | 204 | 287149 | 2061.5 | 744 | 727 | 138.9 |
| B | 0 | 219 | 132145 | 945.87 | 744 | 727 | 138.9 |
| B | 4 | 48 | 22128 | 154.03 | 744 | 727 | 138.9 |
| C | 1 | 16 | 22466 | 132.74 | 719 | 723 | 163.8 |
| C | 13 | 61 | 5964 | 32.0 | 719 | 723 | 163.8 |
| C | 8 | 222 | 2274 | 9.47 | 719 | 723 | 163.8 |
| D | 2 | 33 | 1052048 | 6043.65 | 714 | 692 | 174.0 |
| D | 2 | 136 | 142636 | 815.96 | 714 | 692 | 174.0 |
| D | 2 | 63 | 131212 | 750.29 | 714 | 692 | 174.0 |
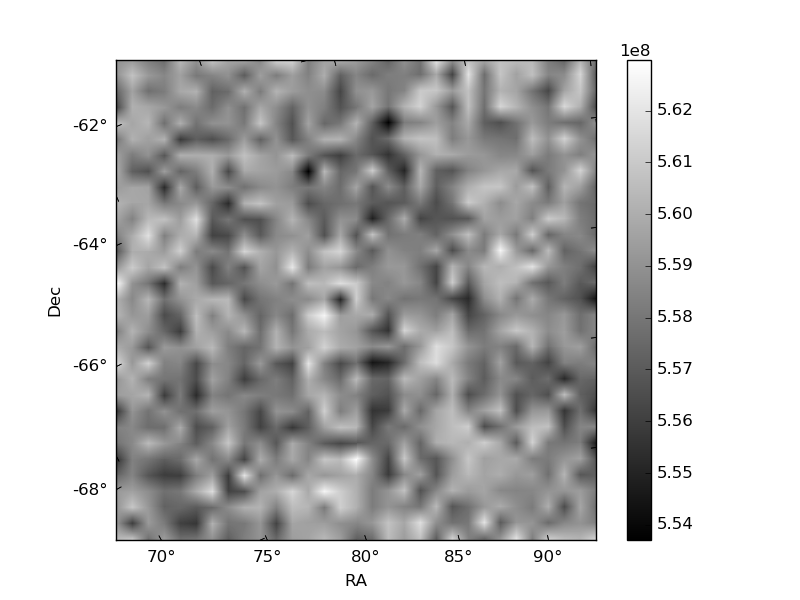
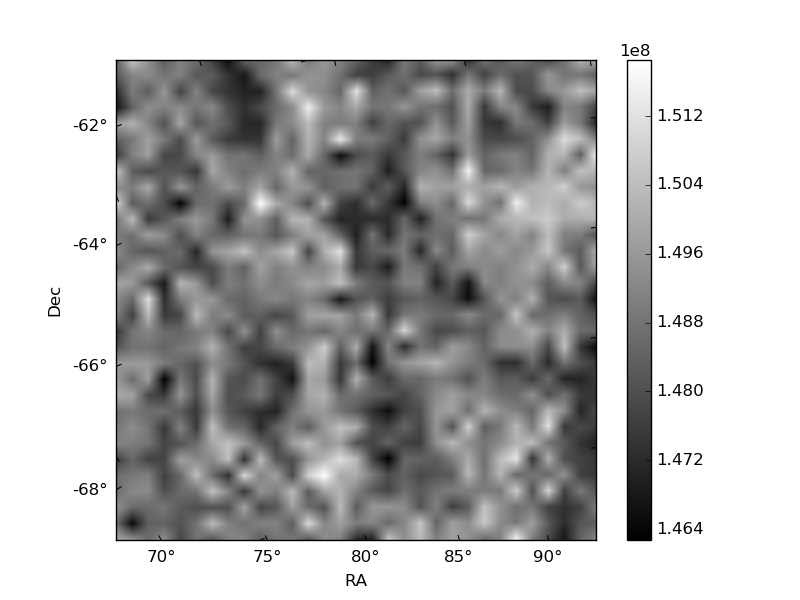
Histogram calculated using DETX and DETY for each event in the final _common_clean file
| Quadrant A | 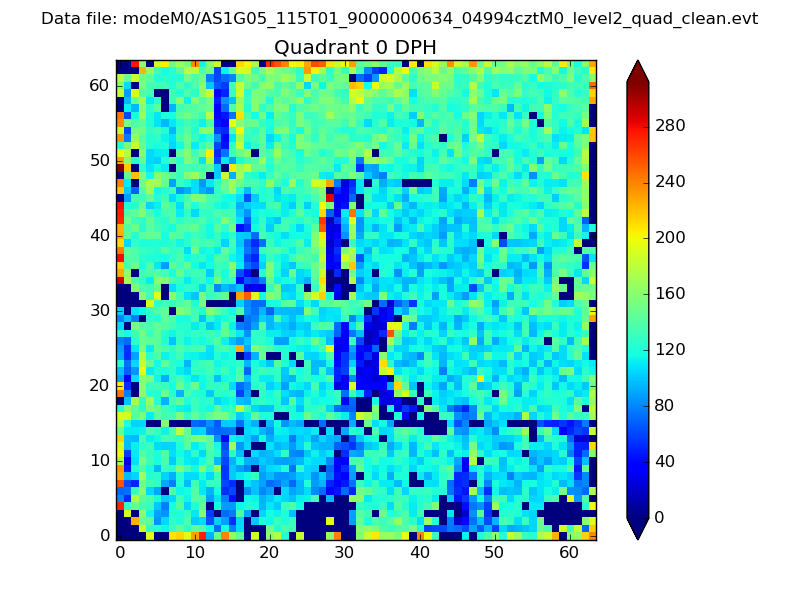 |
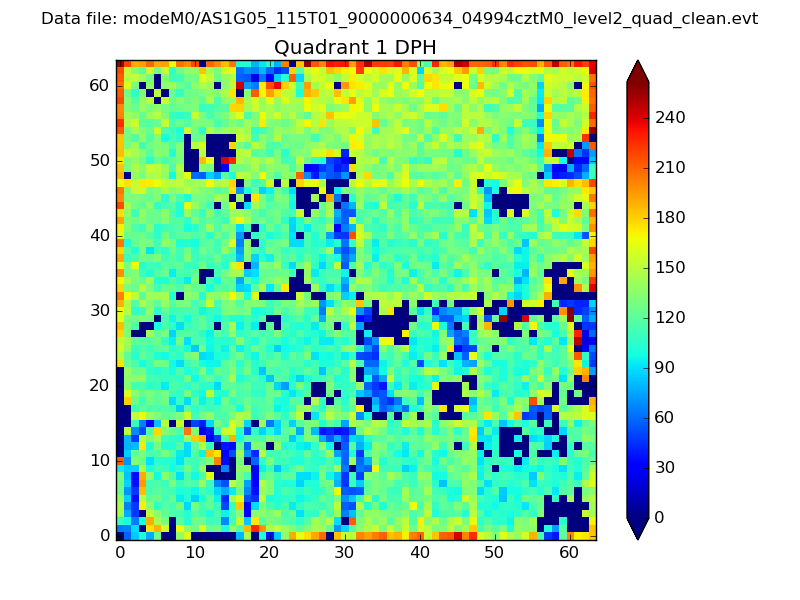 |
Quadrant B |
|---|---|---|---|
| Quadrant D |  |
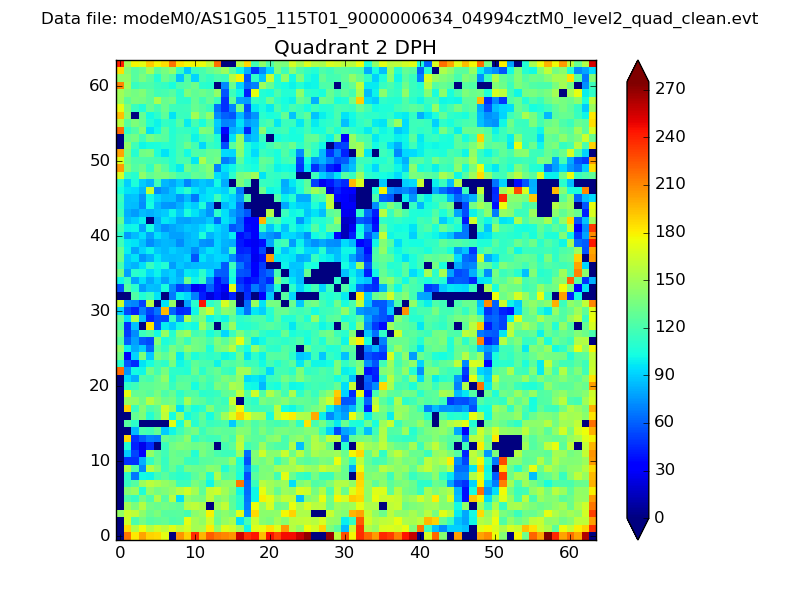 |
Quadrant C |
| Plot type | Count rate plots | Images |
|---|---|---|
| Comparison with Poisson distribution Blue bars denote a histogram of data divided into 1 sec bins. Red curve is a Poisson curve with rate = median count rate of data. |
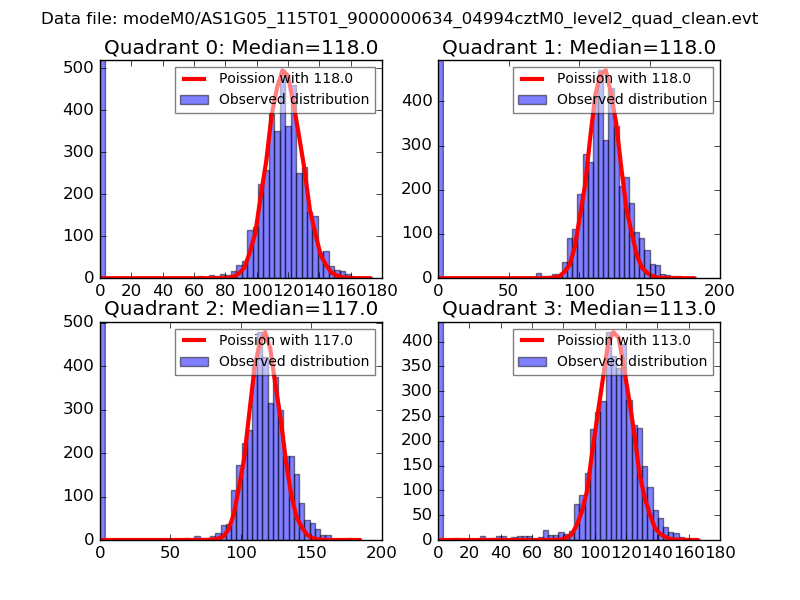 |
 |
| Quadrant-wise count rates Data is divided into 100 sec bins |
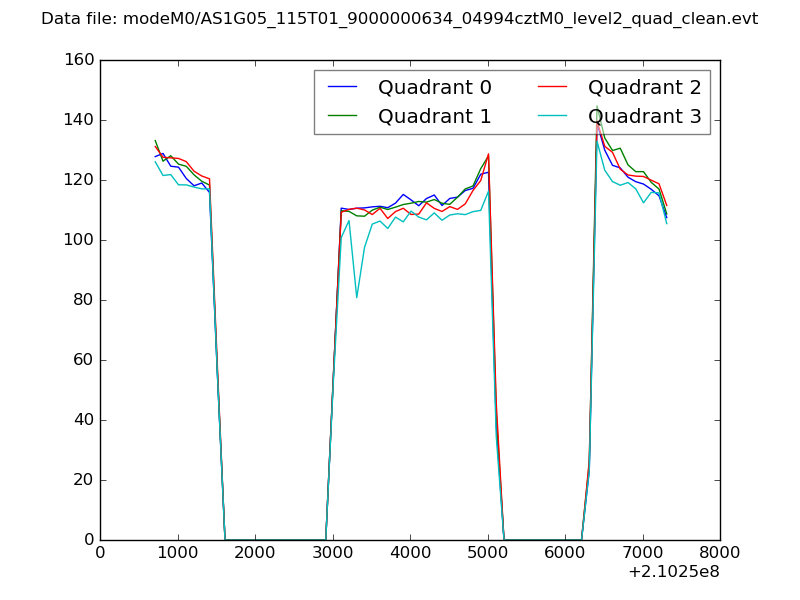 |
|
| Module-wise count rates for Quadrant A Data is divided into 100 sec bins |
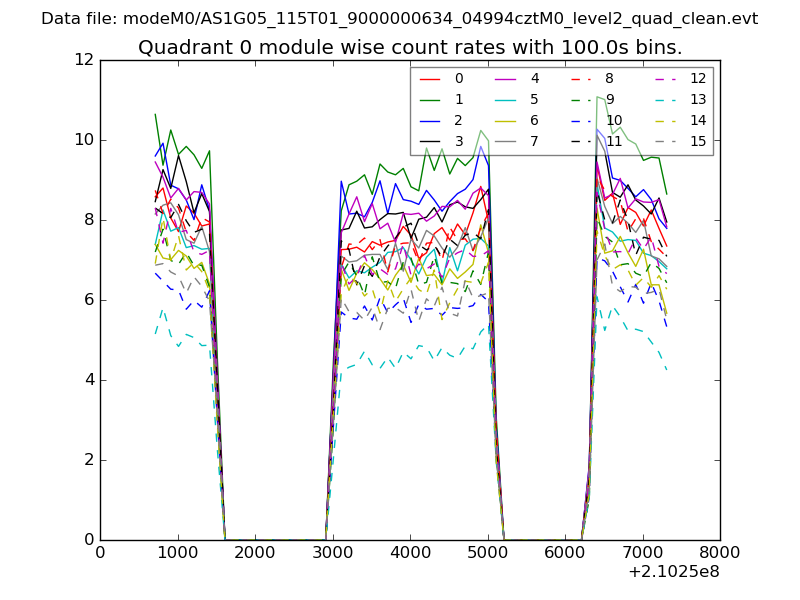 |
 |
| Module-wise count rates for Quadrant B Data is divided into 100 sec bins |
 |
 |
| Module-wise count rates for Quadrant C Data is divided into 100 sec bins |
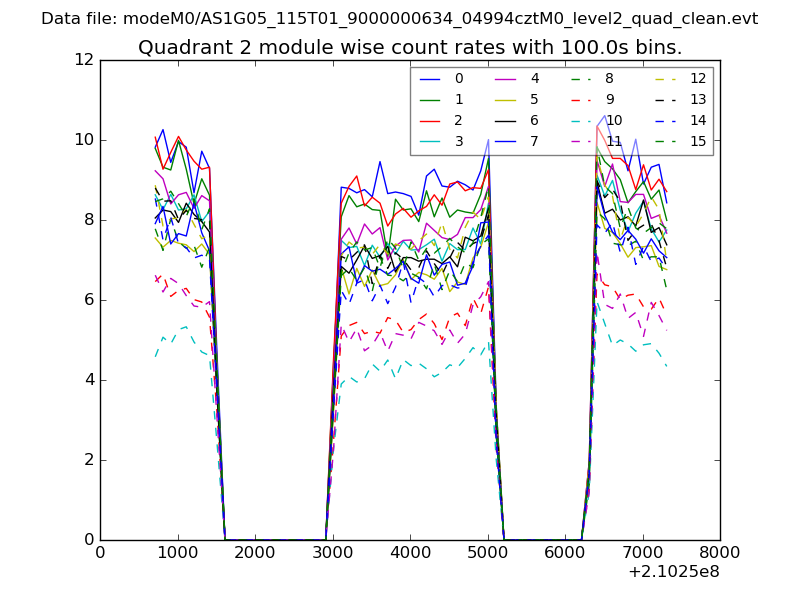 |
 |
| Module-wise count rates for Quadrant D Data is divided into 100 sec bins |
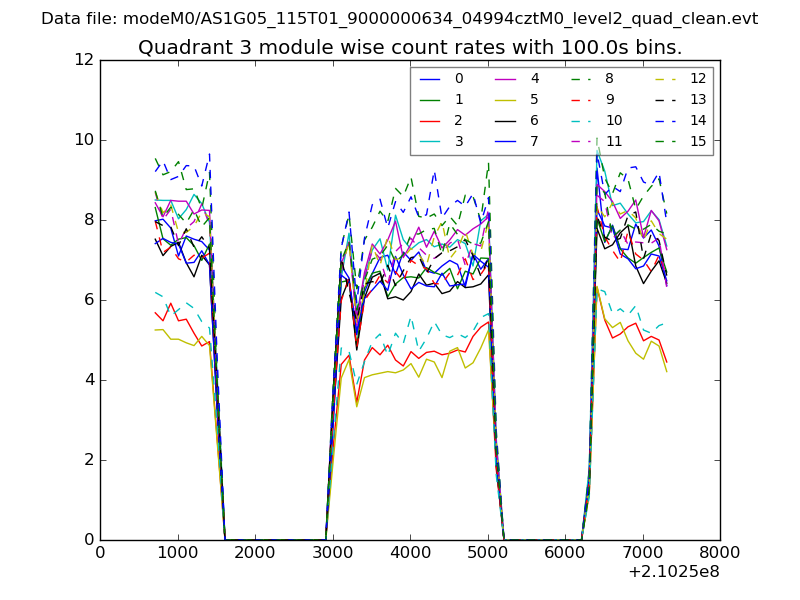 |
 |
| Parameter | Plot |
|---|---|
| CZT HV Monitor |  |
| D_VDD | 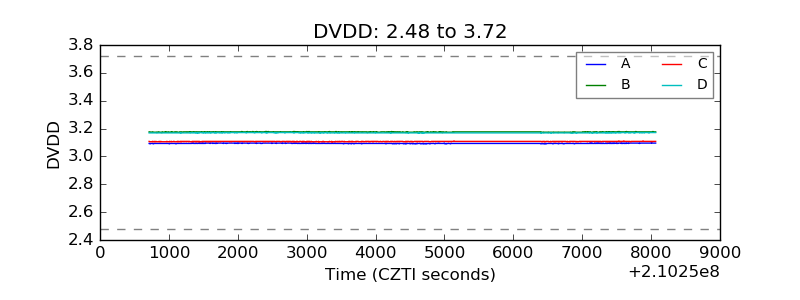 |
| Temperature 1 | 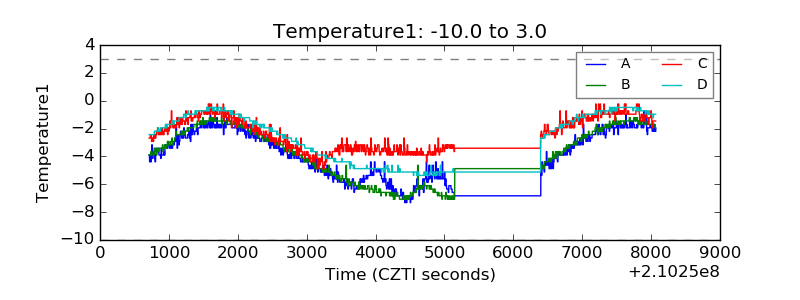 |
| Veto HV Monitor | 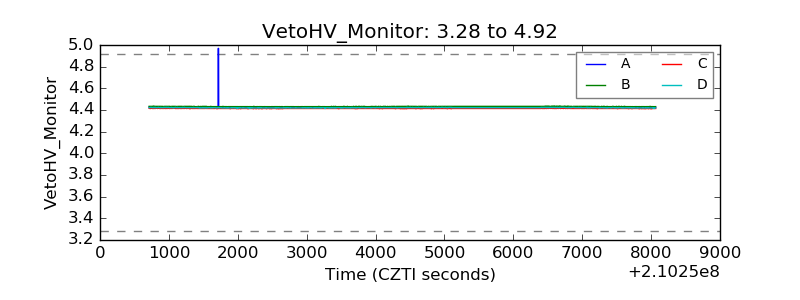 |
| Veto LLD | 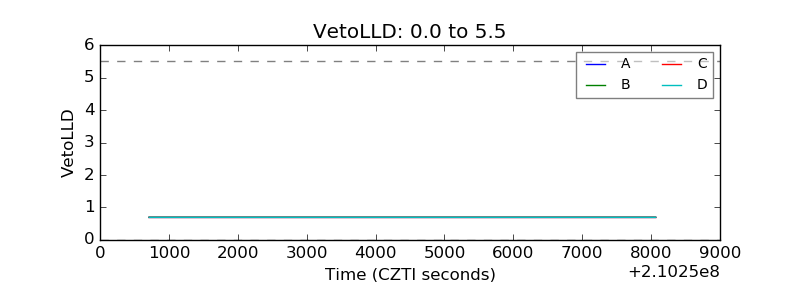 |
| Alpha Counter | 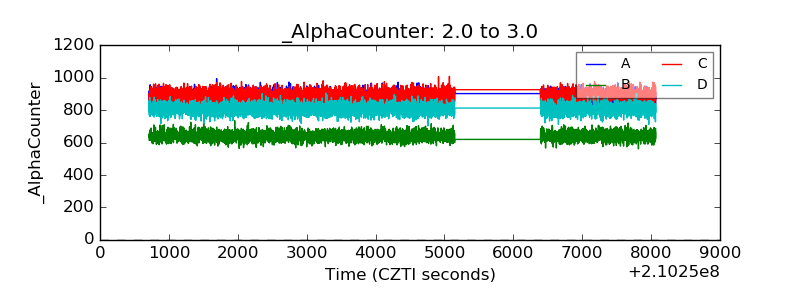 |
| _CPM_Rate | 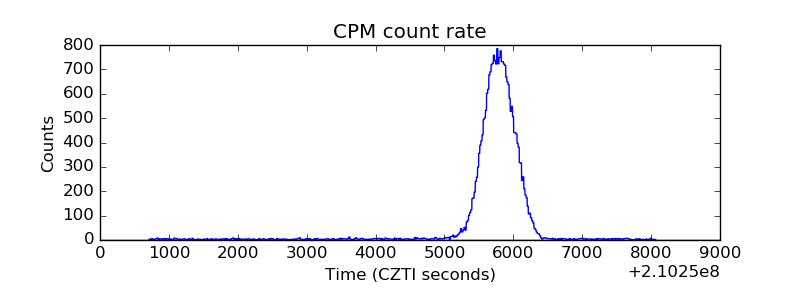 |
| CZT Counter | 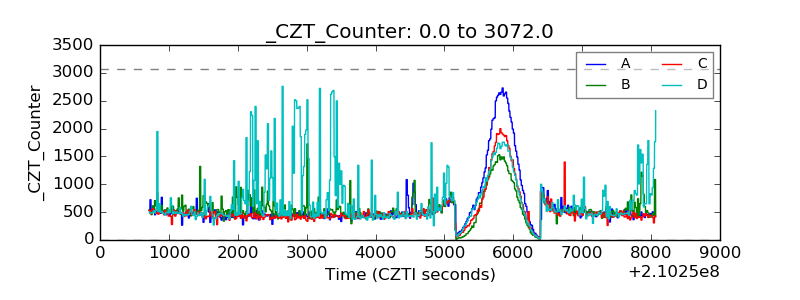 |
| +2.5 Volts monitor |  |
| +5 Volts monitor |  |
| _ROLL_ROT | 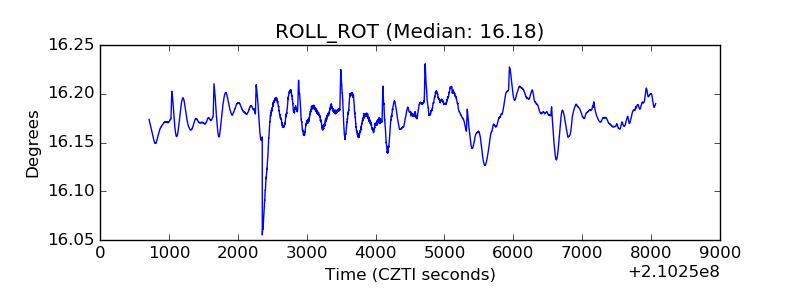 |
| _Roll_DEC | 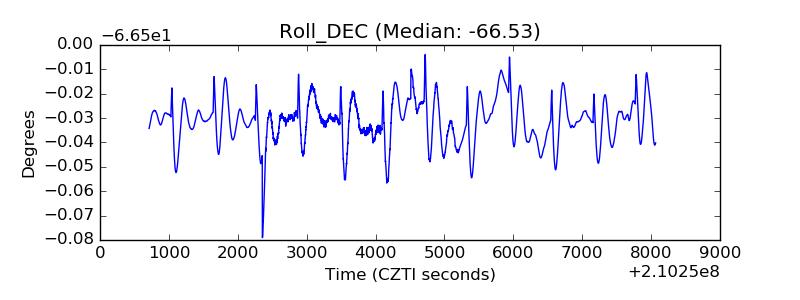 |
| _Roll_RA | 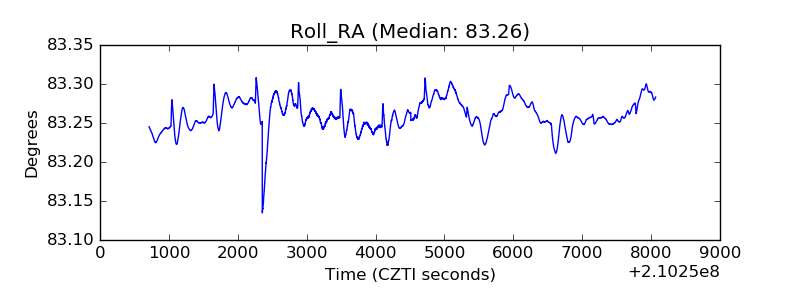 |
| Veto Counter | 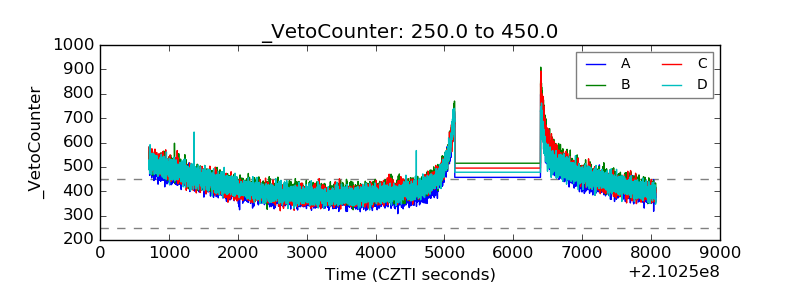 |