| Param | Original file | Final file |
|---|---|---|
| Filename | modeM0/AS1G05_115T01_9000000634_04995cztM0_level2.evt | modeM0/AS1G05_115T01_9000000634_04995cztM0_level2_quad_clean.evt |
| Size (bytes) | 442,077,120 | 65,612,160 |
| Size | 421.6 MB | 62.6 MB |
| Events in quadrant A | 2,816,501 | 397,120 |
| Events in quadrant B | 2,970,400 | 398,181 |
| Events in quadrant C | 2,667,816 | 397,109 |
| Events in quadrant D | 4,527,351 | 376,400 |
| Mode M9 | |||
|---|---|---|---|
| Quadrant | BADHDUFLAG | Total packets | Discarded packets |
| A | 0 | 11 | 0 |
| B | 0 | 11 | 0 |
| C | 0 | 11 | 0 |
| D | 0 | 11 | 0 |
| Mode M0 | |||
|---|---|---|---|
| Quadrant | BADHDUFLAG | Total packets | Discarded packets |
| A | 0 | 12406 | 2 |
| B | 0 | 12727 | 1 |
| C | 0 | 12193 | 1 |
| D | 0 | 17589 | 1 |
| Mode SS | |||
|---|---|---|---|
| Quadrant | BADHDUFLAG | Total packets | Discarded packets |
| A | 0 | 122 | 0 |
| B | 0 | 122 | 0 |
| C | 0 | 122 | 0 |
| D | 0 | 122 | 0 |
| Quadrant | Total seconds | Saturated seconds | Saturation percentage |
|---|---|---|---|
| A | 5977 | 90 | 1.505772% |
| B | 5977 | 84 | 1.405387% |
| C | 5977 | 53 | 0.886732% |
| D | 5977 | 394 | 6.591936% |
Noise dominated data is calculated using 1-second bins in cleaned event files. If a bin has >2000 counts, and if more than 50% of those come from <1% of pixels, then it is considered to be noise-dominated and hence unusable.
| Quadrant | # 1 sec bins | Bins with >0 counts | Bins with >2000 counts | High rate bins dominated by noise | Noise dominated (total time) | Noise dominated (detector-on time) | Marked lightcurve |
|---|---|---|---|---|---|---|---|
| A | 7082 | 5978 | 5 | 5 | 0.07% | 0.08% | 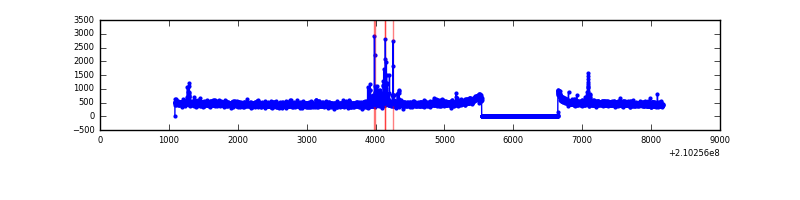 |
| B | 7082 | 5978 | 4 | 4 | 0.06% | 0.07% | 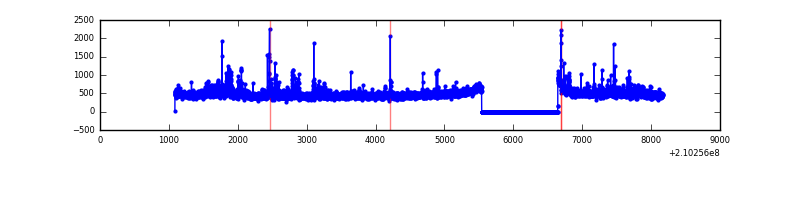 |
| C | 7082 | 5978 | 0 | 0 | 0.00% | 0.00% | 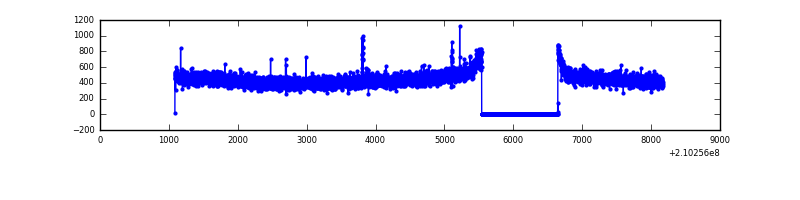 |
| D | 7082 | 5978 | 322 | 322 | 4.55% | 5.39% | 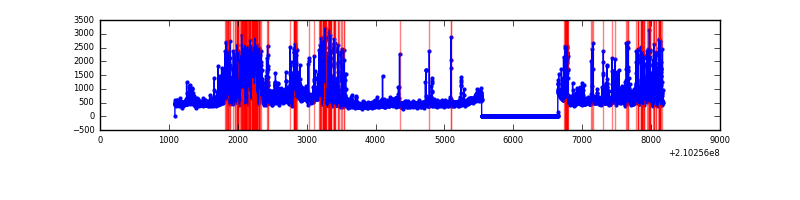 |
Top three noisy pixels from each quadrant. If the there are fewer than three noisy pixels in the level2.evt file, extra rows are filled as -1
| Pixel properties | Quadrant properties | ||||||
|---|---|---|---|---|---|---|---|
| Quadrant | DetID | PixID | Counts | Sigma | Mean | Median | Sigma |
| A | 4 | 2 | 66652 | 464.94 | 700 | 683 | 141.9 |
| A | 13 | 251 | 26950 | 185.13 | 700 | 683 | 141.9 |
| A | 0 | 50 | 12487 | 83.19 | 700 | 683 | 141.9 |
| B | 0 | 219 | 131302 | 991.09 | 704 | 686 | 131.8 |
| B | 15 | 204 | 81808 | 615.54 | 704 | 686 | 131.8 |
| B | 15 | 54 | 24522 | 180.86 | 704 | 686 | 131.8 |
| C | 8 | 222 | 9052 | 54.07 | 680 | 683 | 154.8 |
| C | 13 | 61 | 5747 | 32.72 | 680 | 683 | 154.8 |
| C | 1 | 16 | 4847 | 26.9 | 680 | 683 | 154.8 |
| D | 2 | 136 | 477171 | 2920.99 | 671 | 650 | 163.1 |
| D | 2 | 33 | 442420 | 2707.98 | 671 | 650 | 163.1 |
| D | 13 | 53 | 354469 | 2168.85 | 671 | 650 | 163.1 |
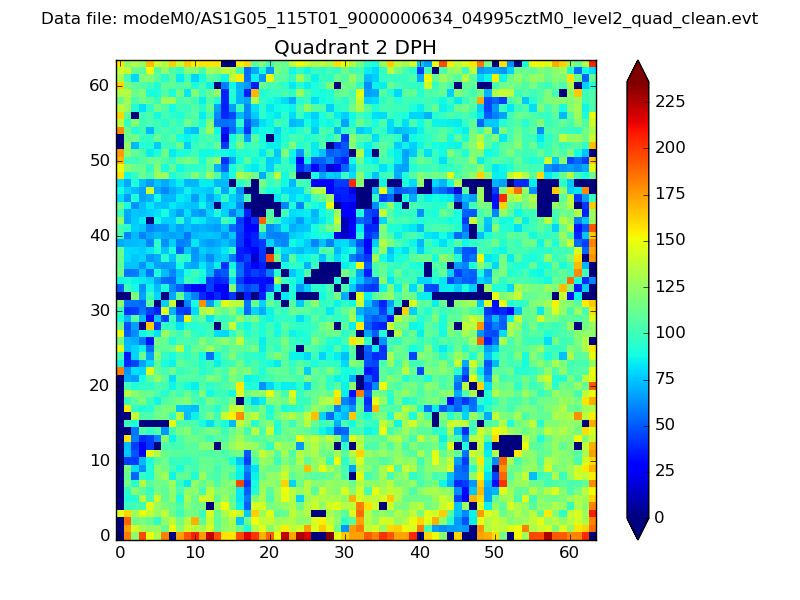
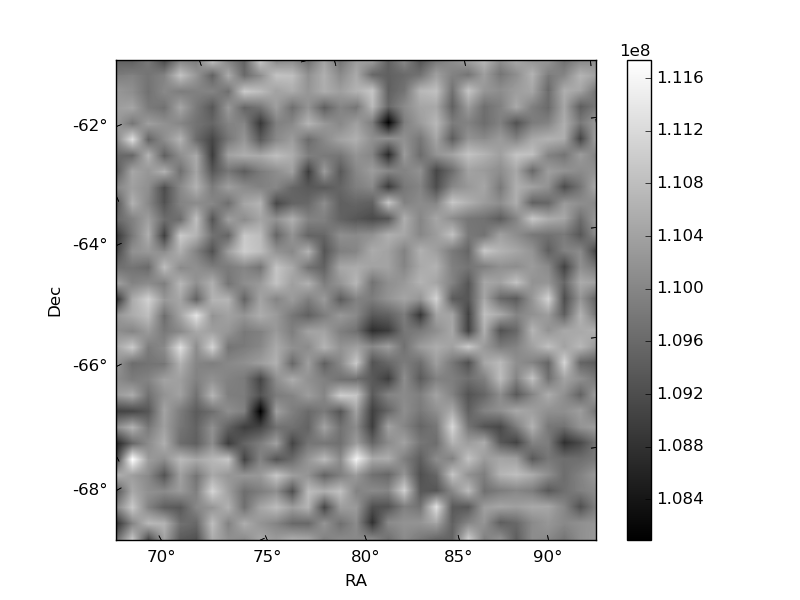
Histogram calculated using DETX and DETY for each event in the final _common_clean file
| Quadrant A | 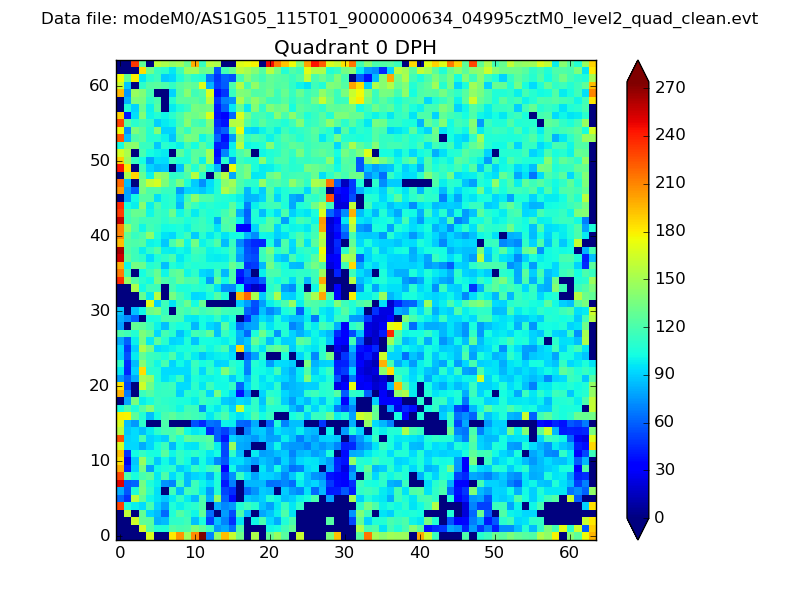 |
 |
Quadrant B |
|---|---|---|---|
| Quadrant D |  |
 |
Quadrant C |
| Plot type | Count rate plots | Images |
|---|---|---|
| Comparison with Poisson distribution Blue bars denote a histogram of data divided into 1 sec bins. Red curve is a Poisson curve with rate = median count rate of data. |
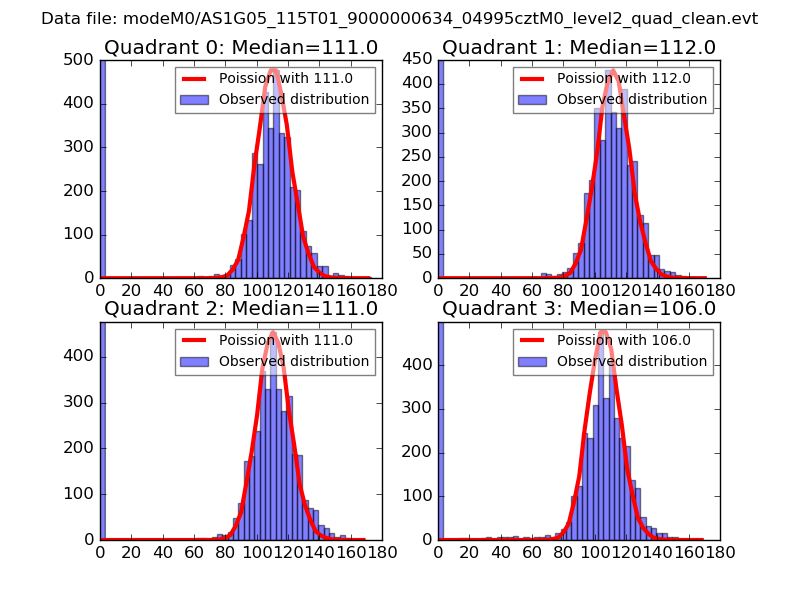 |
 |
| Quadrant-wise count rates Data is divided into 100 sec bins |
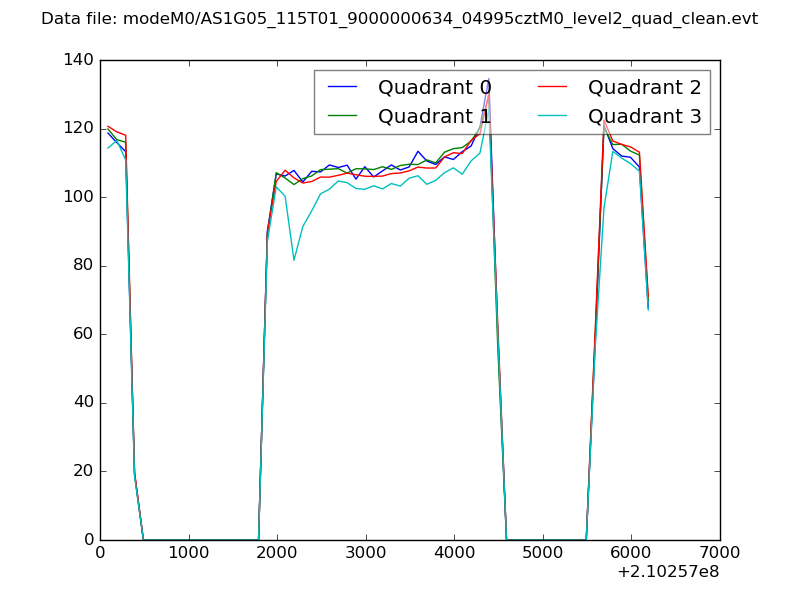 |
|
| Module-wise count rates for Quadrant A Data is divided into 100 sec bins |
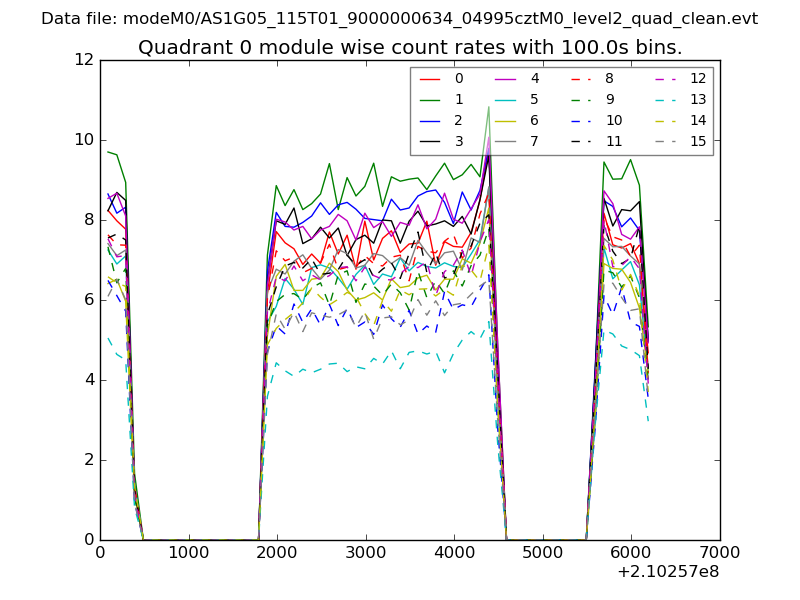 |
 |
| Module-wise count rates for Quadrant B Data is divided into 100 sec bins |
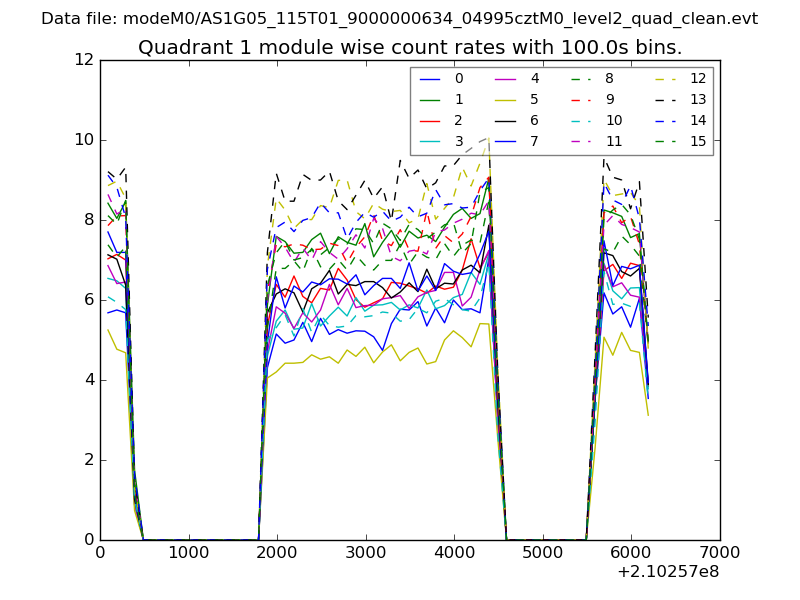 |
 |
| Module-wise count rates for Quadrant C Data is divided into 100 sec bins |
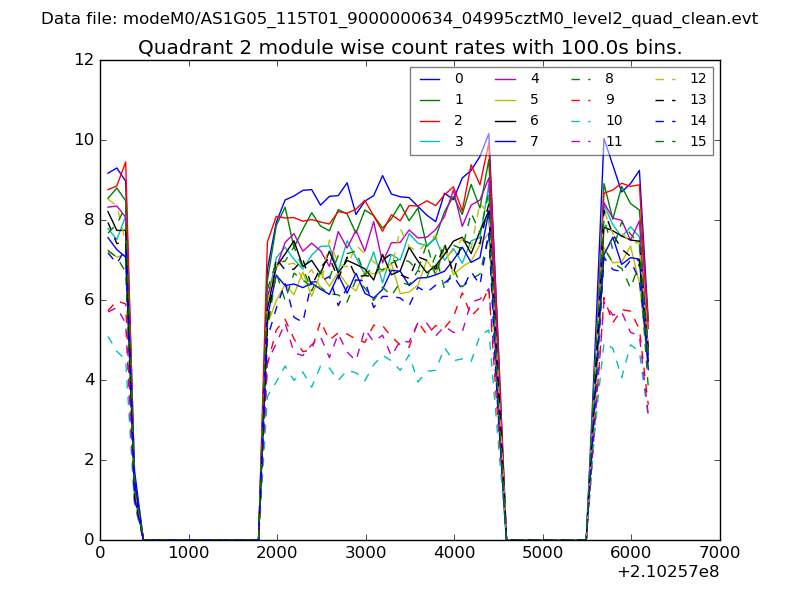 |
 |
| Module-wise count rates for Quadrant D Data is divided into 100 sec bins |
 |
 |
| Parameter | Plot |
|---|---|
| CZT HV Monitor | 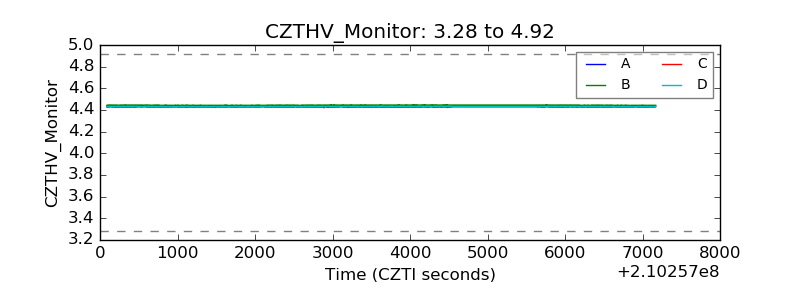 |
| D_VDD | 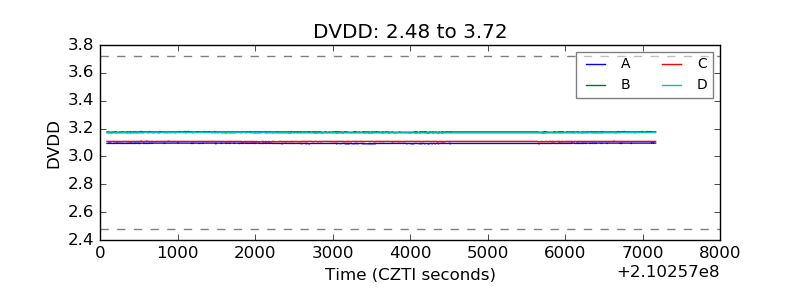 |
| Temperature 1 | 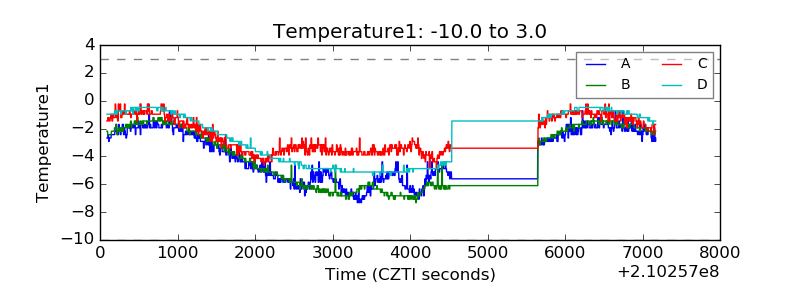 |
| Veto HV Monitor | 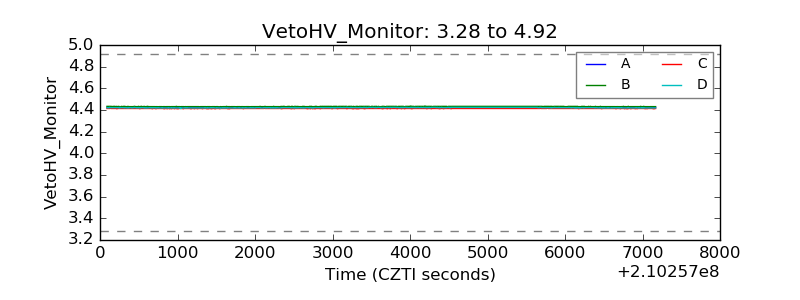 |
| Veto LLD | 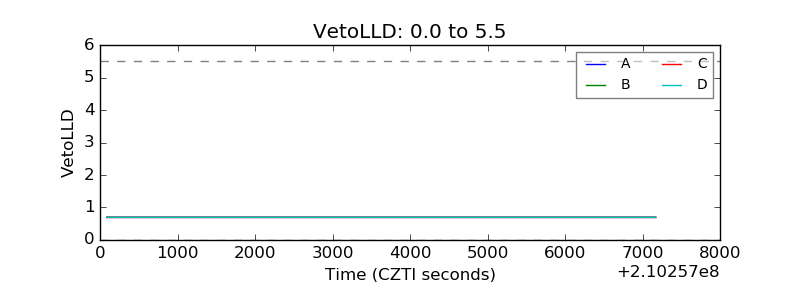 |
| Alpha Counter | 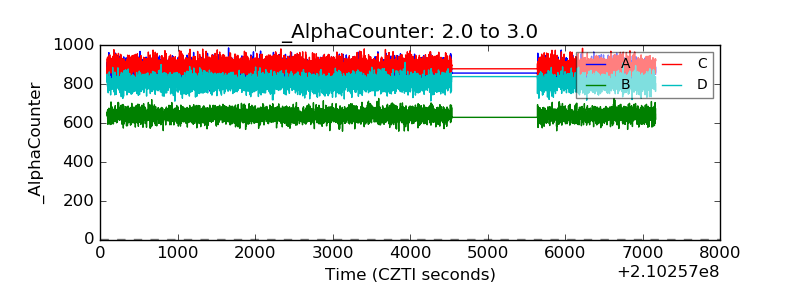 |
| _CPM_Rate | 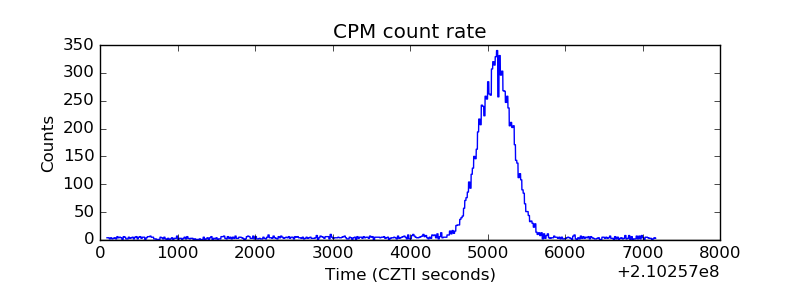 |
| CZT Counter | 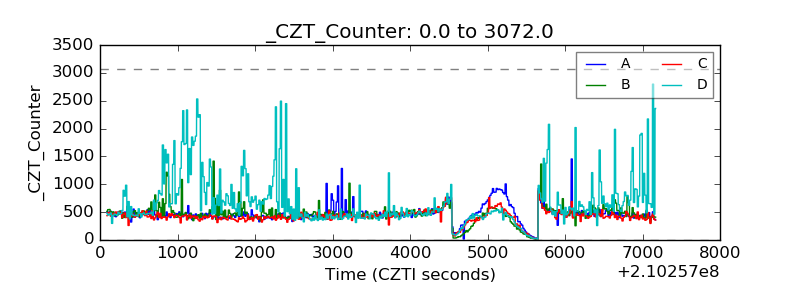 |
| +2.5 Volts monitor |  |
| +5 Volts monitor |  |
| _ROLL_ROT | 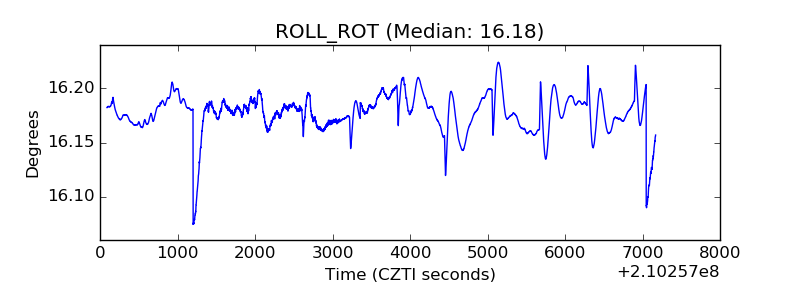 |
| _Roll_DEC | 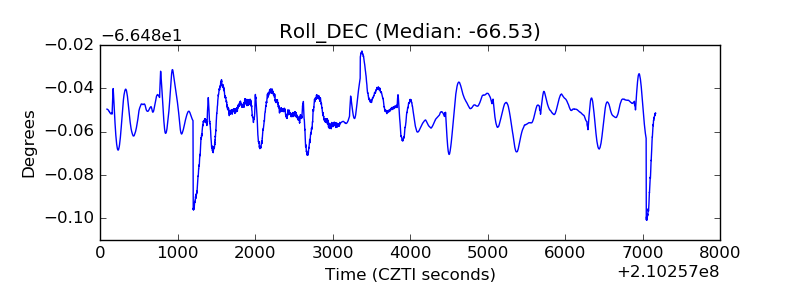 |
| _Roll_RA |  |
| Veto Counter | 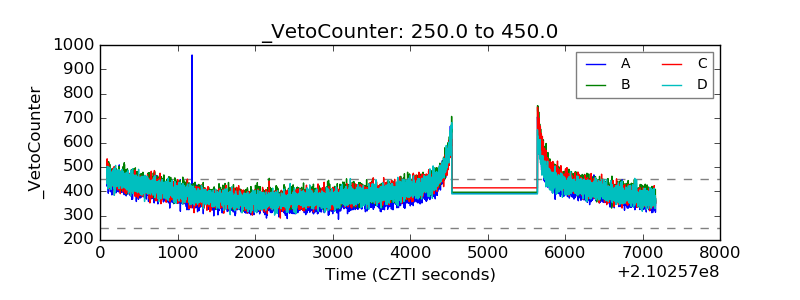 |