| Param | Original file | Final file |
|---|---|---|
| Filename | modeM0/AS1G05_115T01_9000000634_04996cztM0_level2.evt | modeM0/AS1G05_115T01_9000000634_04996cztM0_level2_quad_clean.evt |
| Size (bytes) | 479,148,480 | 74,520,000 |
| Size | 457.0 MB | 71.1 MB |
| Events in quadrant A | 3,127,450 | 450,629 |
| Events in quadrant B | 3,572,795 | 447,789 |
| Events in quadrant C | 3,027,041 | 448,476 |
| Events in quadrant D | 4,318,100 | 431,995 |
| Mode M9 | |||
|---|---|---|---|
| Quadrant | BADHDUFLAG | Total packets | Discarded packets |
| A | 0 | 8 | 0 |
| B | 0 | 8 | 0 |
| C | 0 | 8 | 0 |
| D | 0 | 8 | 0 |
| Mode M0 | |||
|---|---|---|---|
| Quadrant | BADHDUFLAG | Total packets | Discarded packets |
| A | 0 | 14072 | 2 |
| B | 0 | 15133 | 1 |
| C | 0 | 13974 | 1 |
| D | 0 | 17522 | 1 |
| Mode SS | |||
|---|---|---|---|
| Quadrant | BADHDUFLAG | Total packets | Discarded packets |
| A | 0 | 138 | 0 |
| B | 0 | 138 | 0 |
| C | 0 | 138 | 0 |
| D | 0 | 138 | 0 |
| Quadrant | Total seconds | Saturated seconds | Saturation percentage |
|---|---|---|---|
| A | 6858 | 59 | 0.860309% |
| B | 6858 | 97 | 1.414407% |
| C | 6858 | 30 | 0.437445% |
| D | 6858 | 230 | 3.353747% |
Noise dominated data is calculated using 1-second bins in cleaned event files. If a bin has >2000 counts, and if more than 50% of those come from <1% of pixels, then it is considered to be noise-dominated and hence unusable.
| Quadrant | # 1 sec bins | Bins with >0 counts | Bins with >2000 counts | High rate bins dominated by noise | Noise dominated (total time) | Noise dominated (detector-on time) | Marked lightcurve |
|---|---|---|---|---|---|---|---|
| A | 7643 | 6859 | 0 | 0 | 0.00% | 0.00% | 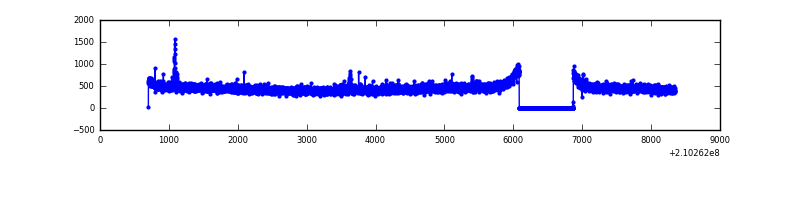 |
| B | 7643 | 6859 | 12 | 12 | 0.16% | 0.17% | 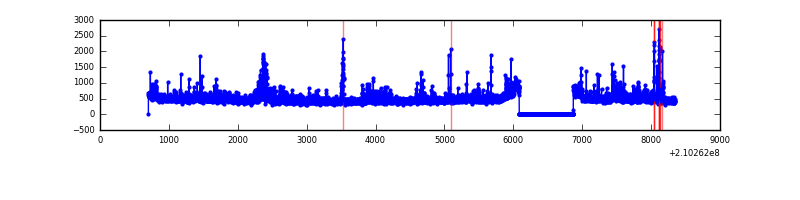 |
| C | 7643 | 6859 | 0 | 0 | 0.00% | 0.00% | 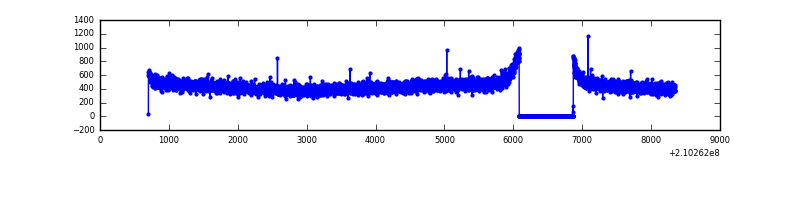 |
| D | 7643 | 6859 | 158 | 158 | 2.07% | 2.30% | 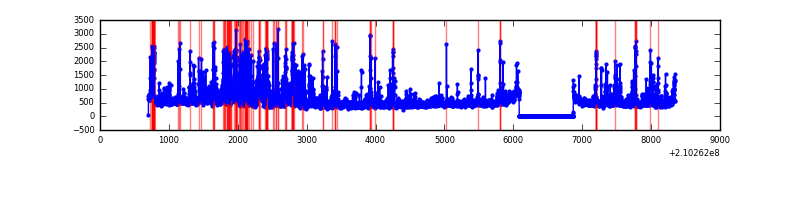 |
Top three noisy pixels from each quadrant. If the there are fewer than three noisy pixels in the level2.evt file, extra rows are filled as -1
| Pixel properties | Quadrant properties | ||||||
|---|---|---|---|---|---|---|---|
| Quadrant | DetID | PixID | Counts | Sigma | Mean | Median | Sigma |
| A | 13 | 251 | 39177 | 236.66 | 796 | 776 | 162.3 |
| A | 0 | 50 | 13244 | 76.84 | 796 | 776 | 162.3 |
| A | 0 | 226 | 8007 | 44.56 | 796 | 776 | 162.3 |
| B | 4 | 80 | 129139 | 847.49 | 800 | 780 | 151.5 |
| B | 15 | 204 | 114552 | 751.17 | 800 | 780 | 151.5 |
| B | 0 | 219 | 99697 | 653.1 | 800 | 780 | 151.5 |
| C | 13 | 61 | 6489 | 32.03 | 774 | 776 | 178.4 |
| C | 12 | 4 | 4397 | 20.3 | 774 | 776 | 178.4 |
| C | 3 | 202 | 1968 | 6.68 | 774 | 776 | 178.4 |
| D | 4 | 95 | 393359 | 2064.44 | 772 | 746 | 190.2 |
| D | 2 | 136 | 314916 | 1651.97 | 772 | 746 | 190.2 |
| D | 12 | 227 | 143071 | 748.37 | 772 | 746 | 190.2 |
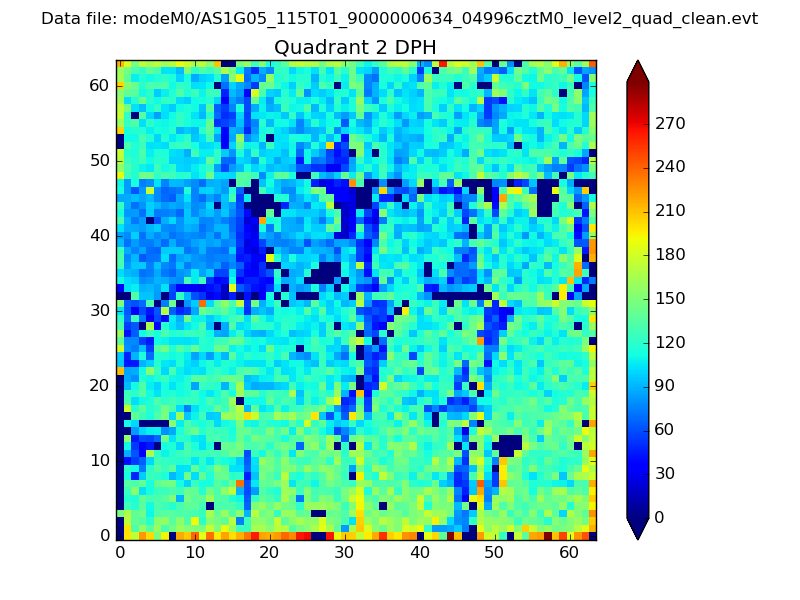
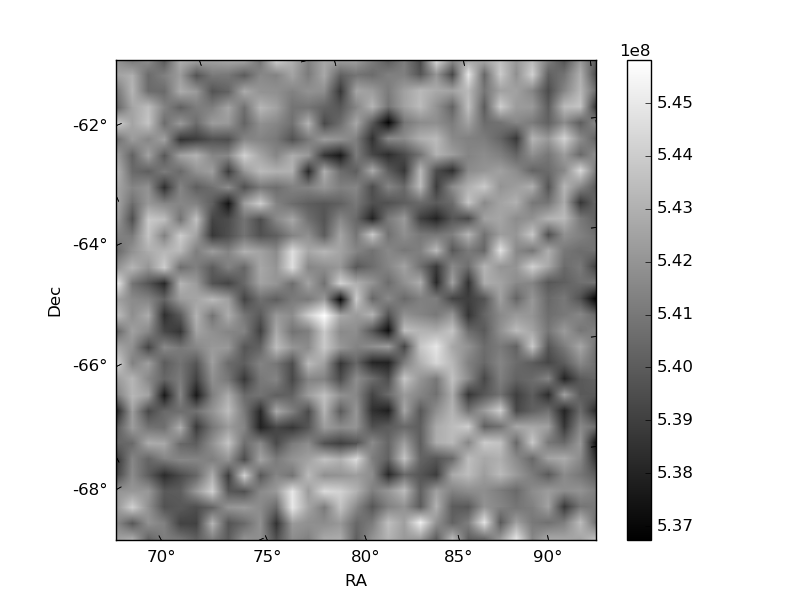
Histogram calculated using DETX and DETY for each event in the final _common_clean file
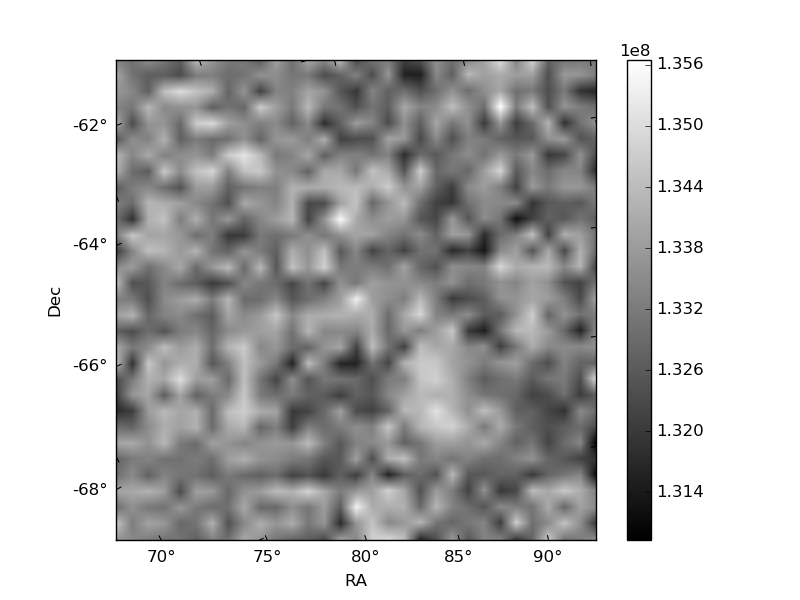
| Quadrant A | 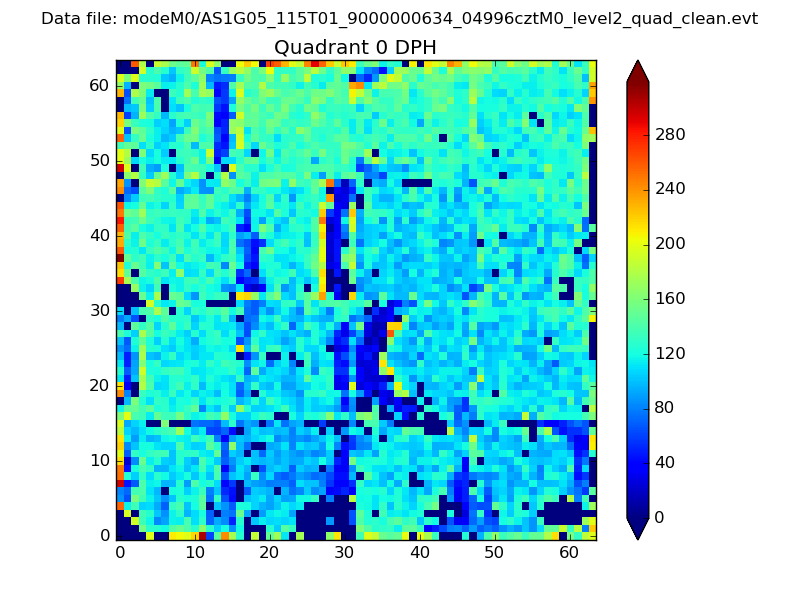 |
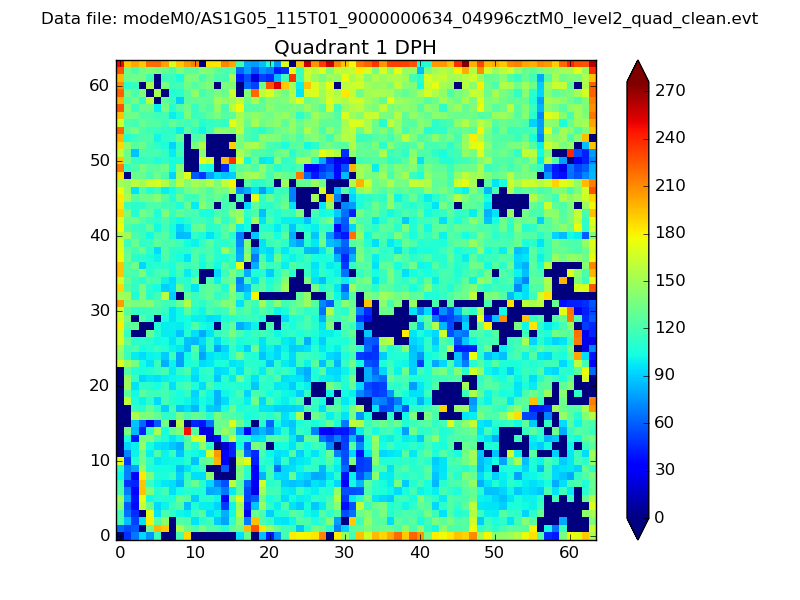 |
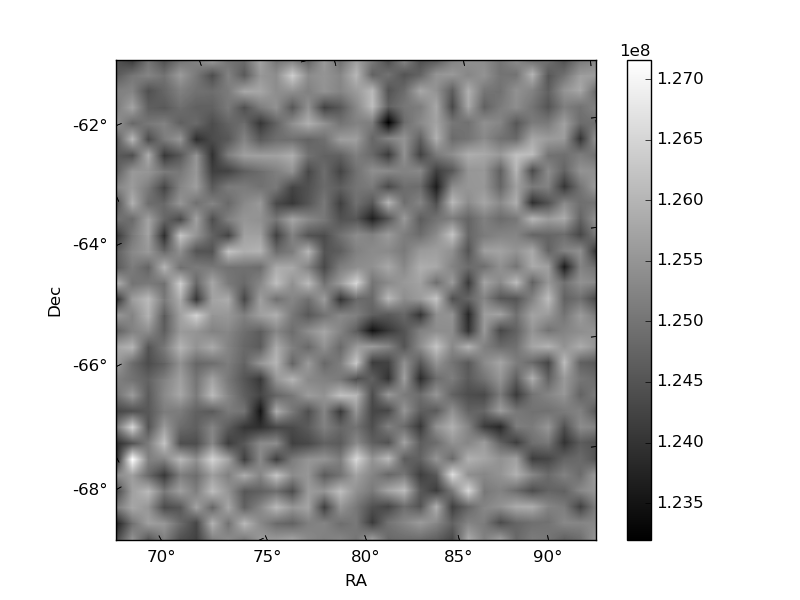
Quadrant B |
|---|---|---|---|
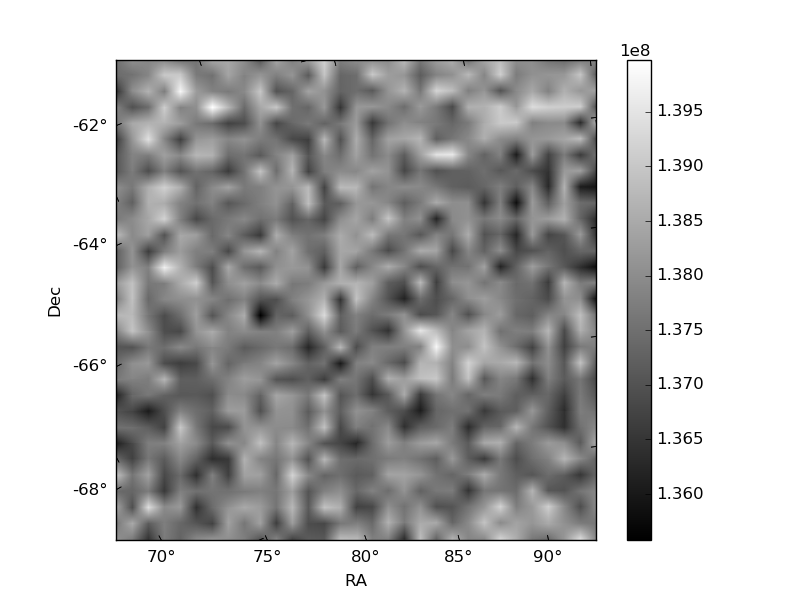
| Quadrant D | 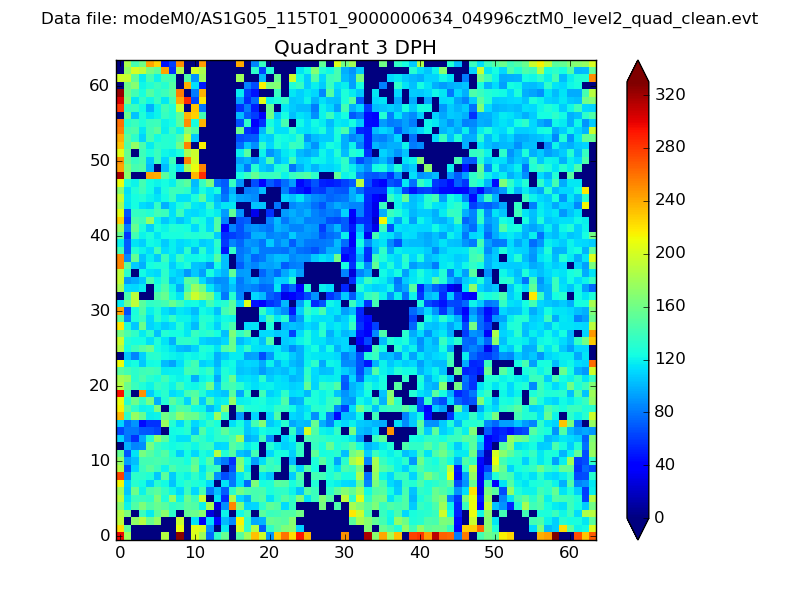 |
 |
Quadrant C |
| Plot type | Count rate plots | Images |
|---|---|---|
| Comparison with Poisson distribution Blue bars denote a histogram of data divided into 1 sec bins. Red curve is a Poisson curve with rate = median count rate of data. |
 |
 |
| Quadrant-wise count rates Data is divided into 100 sec bins |
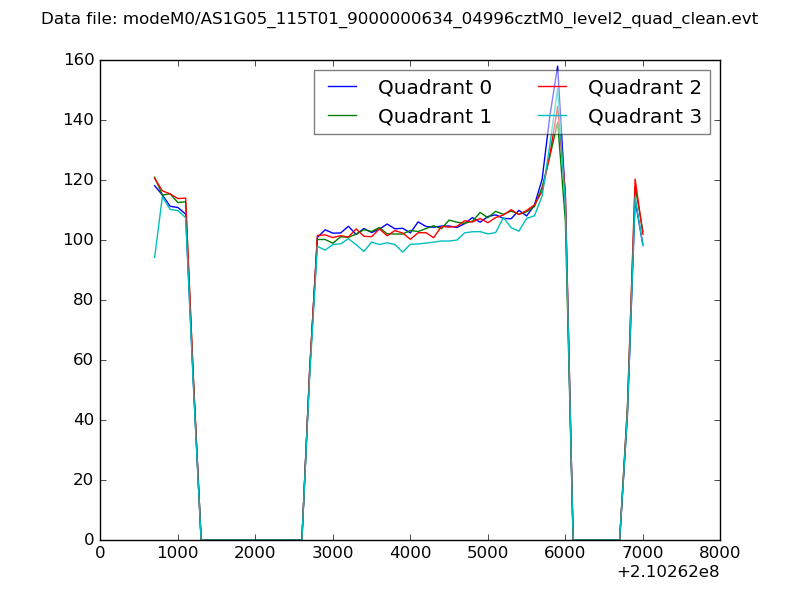 |
|
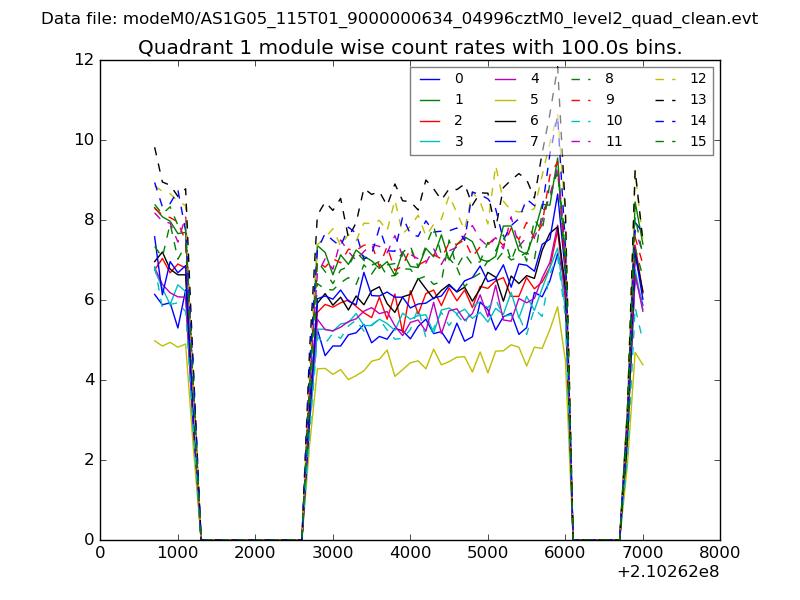
| Module-wise count rates for Quadrant A Data is divided into 100 sec bins |
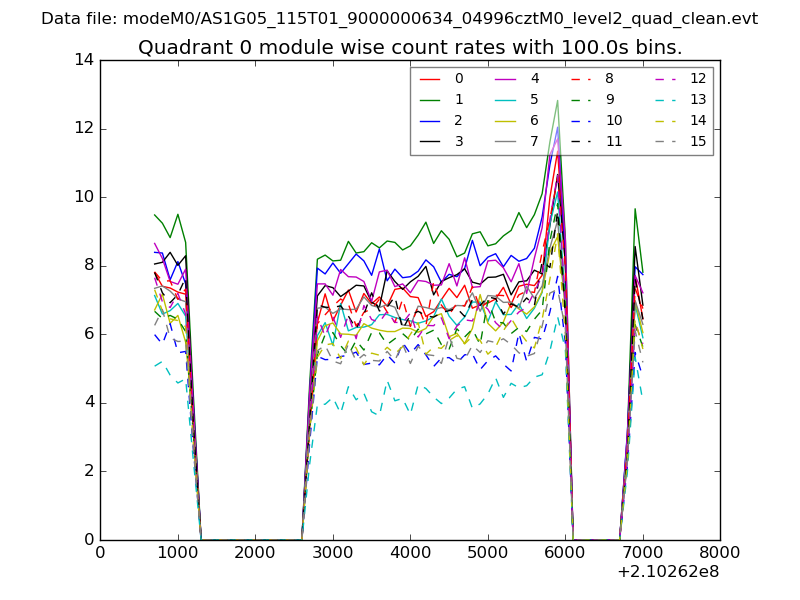 |
 |
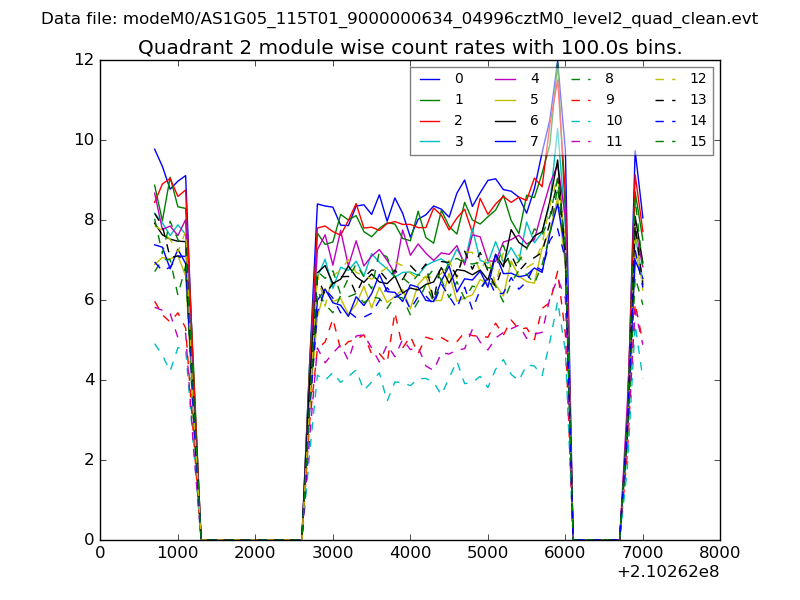
| Module-wise count rates for Quadrant B Data is divided into 100 sec bins |
 |
 |
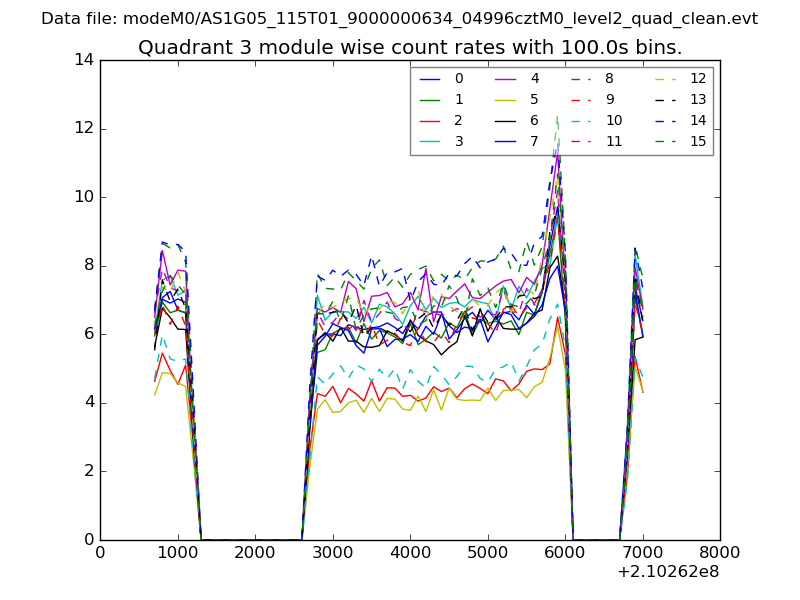
| Module-wise count rates for Quadrant C Data is divided into 100 sec bins |
 |
 |
| Module-wise count rates for Quadrant D Data is divided into 100 sec bins |
 |
 |
| Parameter | Plot |
|---|---|
| CZT HV Monitor | 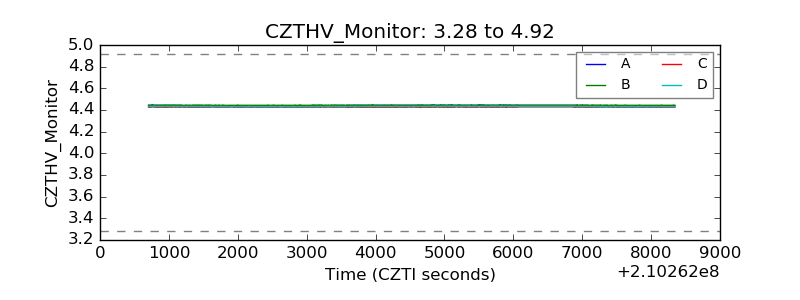 |
| D_VDD |  |
| Temperature 1 | 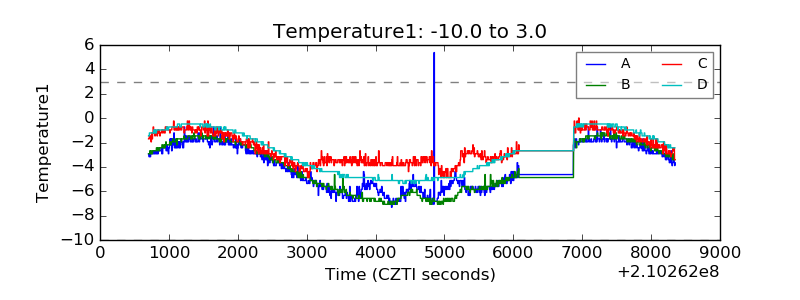 |
| Veto HV Monitor |  |
| Veto LLD | 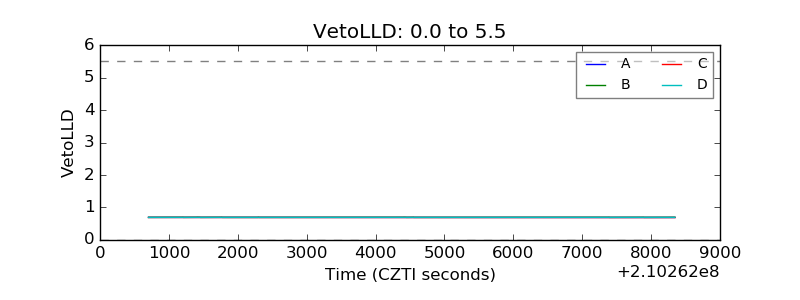 |
| Alpha Counter | 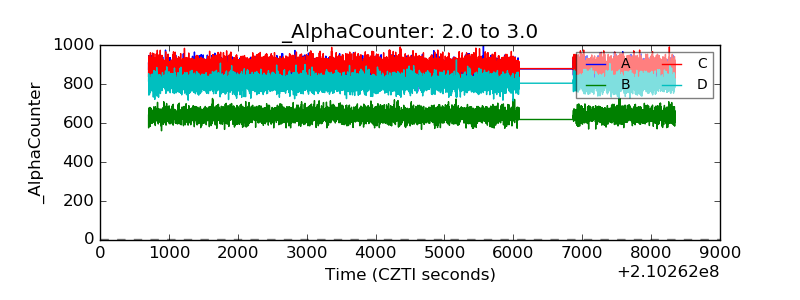 |
| _CPM_Rate | 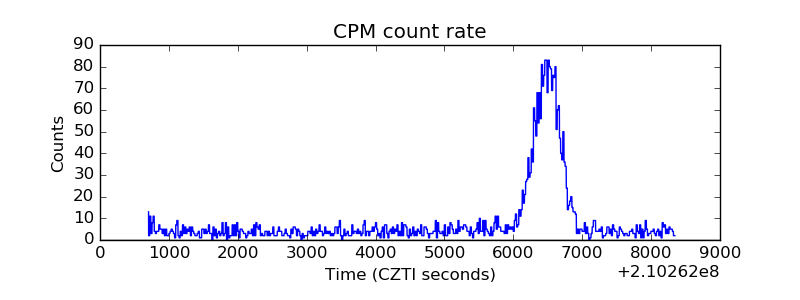 |
| CZT Counter | 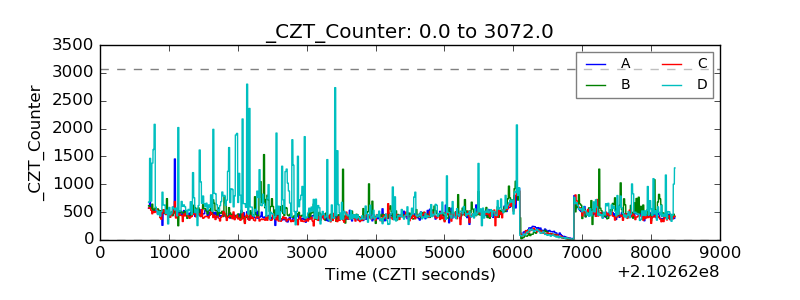 |
| +2.5 Volts monitor |  |
| +5 Volts monitor |  |
| _ROLL_ROT | 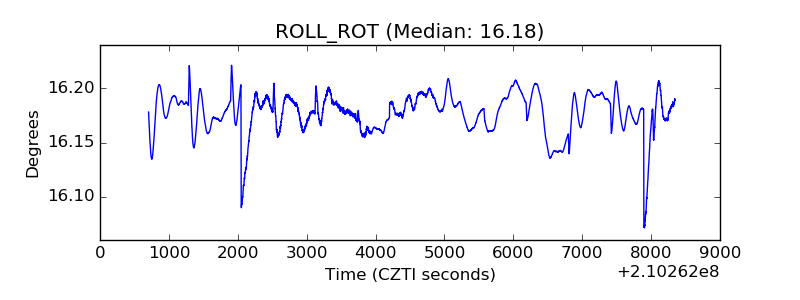 |
| _Roll_DEC | 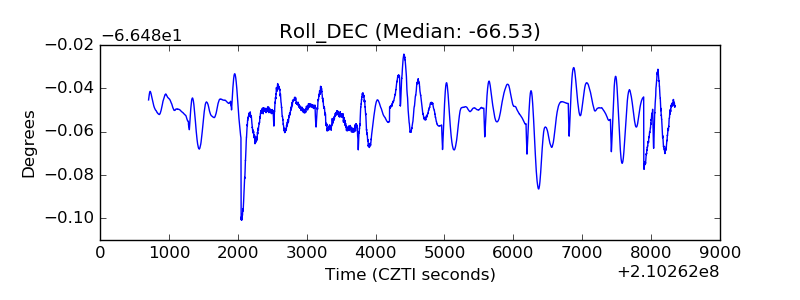 |
| _Roll_RA | 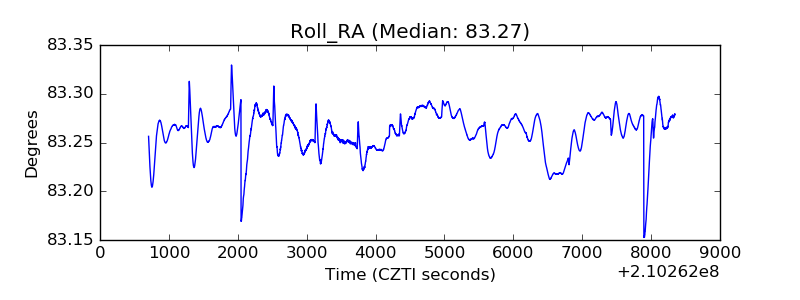 |
| Veto Counter | 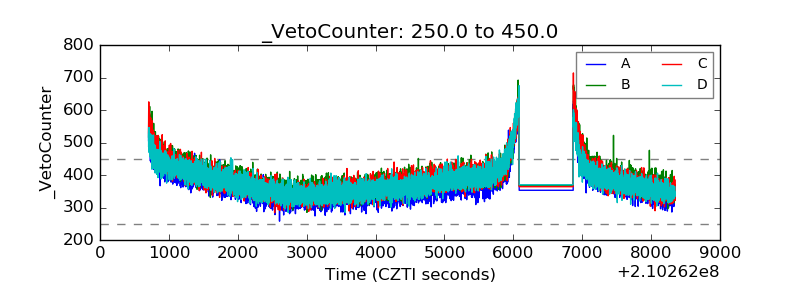 |