| Param | Original file | Final file |
|---|---|---|
| Filename | modeM0/AS1G05_115T01_9000000634_04997cztM0_level2.evt | modeM0/AS1G05_115T01_9000000634_04997cztM0_level2_quad_clean.evt |
| Size (bytes) | 510,298,560 | 76,789,440 |
| Size | 486.7 MB | 73.2 MB |
| Events in quadrant A | 3,332,109 | 458,248 |
| Events in quadrant B | 3,729,379 | 457,743 |
| Events in quadrant C | 3,200,545 | 459,908 |
| Events in quadrant D | 4,695,940 | 440,599 |
| Mode M9 | |||
|---|---|---|---|
| Quadrant | BADHDUFLAG | Total packets | Discarded packets |
| A | 0 | 3 | 0 |
| B | 0 | 3 | 0 |
| C | 0 | 3 | 0 |
| D | 0 | 3 | 0 |
| Mode M0 | |||
|---|---|---|---|
| Quadrant | BADHDUFLAG | Total packets | Discarded packets |
| A | 0 | 15104 | 13 |
| B | 0 | 16100 | 19 |
| C | 0 | 14952 | 9 |
| D | 0 | 19003 | 30 |
| Mode SS | |||
|---|---|---|---|
| Quadrant | BADHDUFLAG | Total packets | Discarded packets |
| A | 0 | 148 | 0 |
| B | 0 | 148 | 0 |
| C | 0 | 148 | 0 |
| D | 0 | 148 | 0 |
| Quadrant | Total seconds | Saturated seconds | Saturation percentage |
|---|---|---|---|
| A | 7307 | 117 | 1.601204% |
| B | 7305 | 168 | 2.299795% |
| C | 7309 | 37 | 0.506225% |
| D | 7306 | 330 | 4.516835% |
Noise dominated data is calculated using 1-second bins in cleaned event files. If a bin has >2000 counts, and if more than 50% of those come from <1% of pixels, then it is considered to be noise-dominated and hence unusable.
| Quadrant | # 1 sec bins | Bins with >0 counts | Bins with >2000 counts | High rate bins dominated by noise | Noise dominated (total time) | Noise dominated (detector-on time) | Marked lightcurve |
|---|---|---|---|---|---|---|---|
| A | 7628 | 7314 | 0 | 0 | 0.00% | 0.00% | 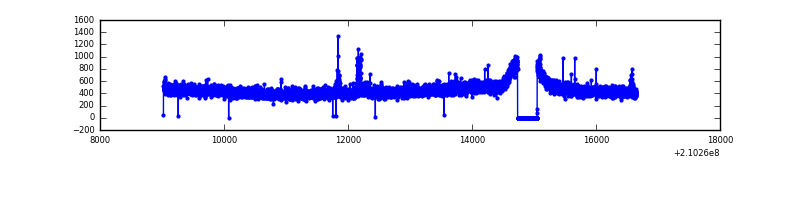 |
| B | 7628 | 7314 | 27 | 27 | 0.35% | 0.37% | 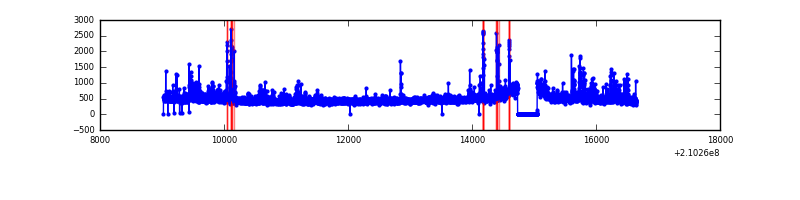 |
| C | 7628 | 7314 | 0 | 0 | 0.00% | 0.00% | 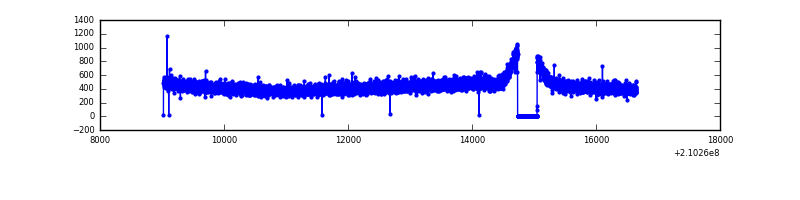 |
| D | 7628 | 7314 | 234 | 234 | 3.07% | 3.20% | 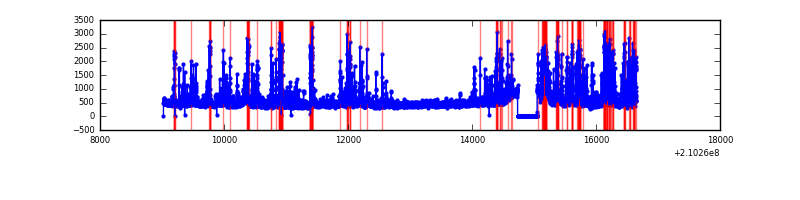 |
Top three noisy pixels from each quadrant. If the there are fewer than three noisy pixels in the level2.evt file, extra rows are filled as -1
| Pixel properties | Quadrant properties | ||||||
|---|---|---|---|---|---|---|---|
| Quadrant | DetID | PixID | Counts | Sigma | Mean | Median | Sigma |
| A | 13 | 251 | 49968 | 282.99 | 843 | 823 | 173.7 |
| A | 0 | 50 | 32176 | 180.54 | 843 | 823 | 173.7 |
| A | 12 | 194 | 8594 | 44.75 | 843 | 823 | 173.7 |
| B | 4 | 80 | 148804 | 912.56 | 847 | 826 | 162.2 |
| B | 0 | 219 | 126597 | 775.61 | 847 | 826 | 162.2 |
| B | 15 | 204 | 65521 | 398.97 | 847 | 826 | 162.2 |
| C | 13 | 61 | 6866 | 31.96 | 818 | 821 | 189.1 |
| C | 12 | 4 | 3490 | 14.11 | 818 | 821 | 189.1 |
| C | 8 | 222 | 2738 | 10.14 | 818 | 821 | 189.1 |
| D | 2 | 33 | 519144 | 2607.59 | 811 | 785 | 198.8 |
| D | 2 | 136 | 248935 | 1248.31 | 811 | 785 | 198.8 |
| D | 13 | 235 | 242719 | 1217.04 | 811 | 785 | 198.8 |
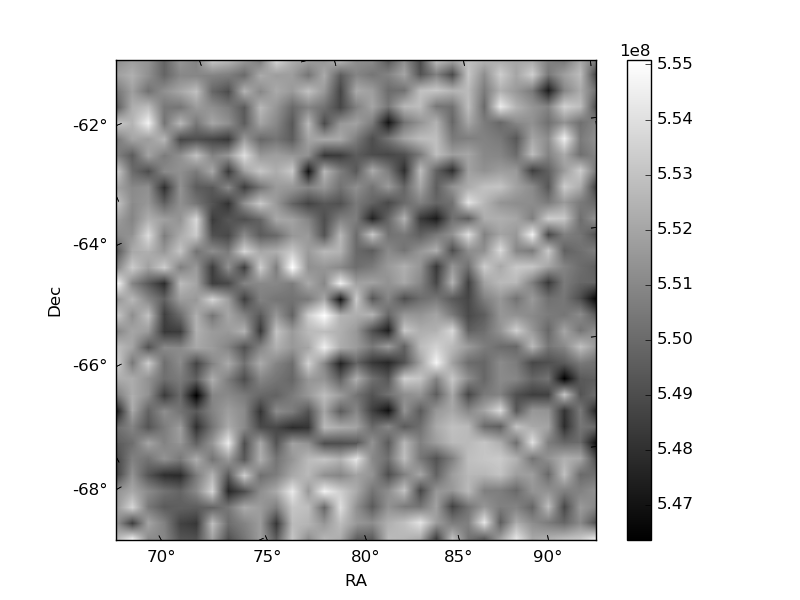
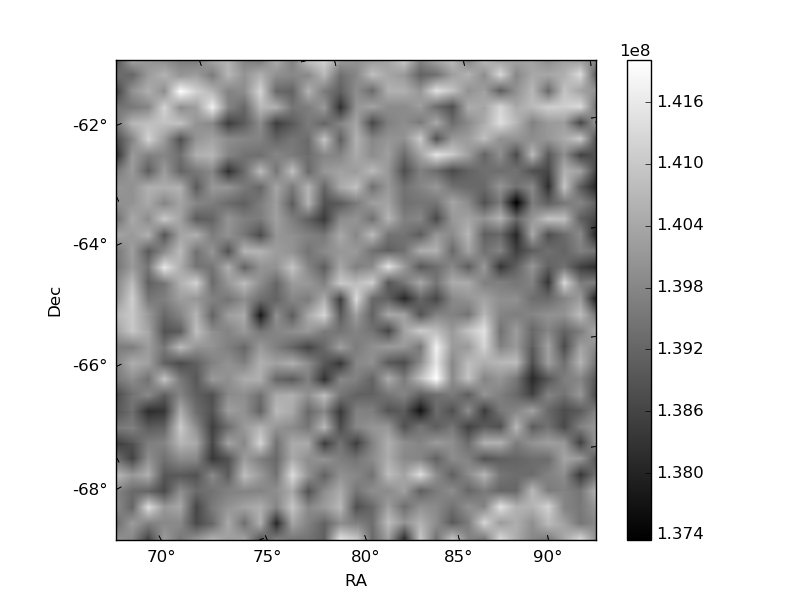
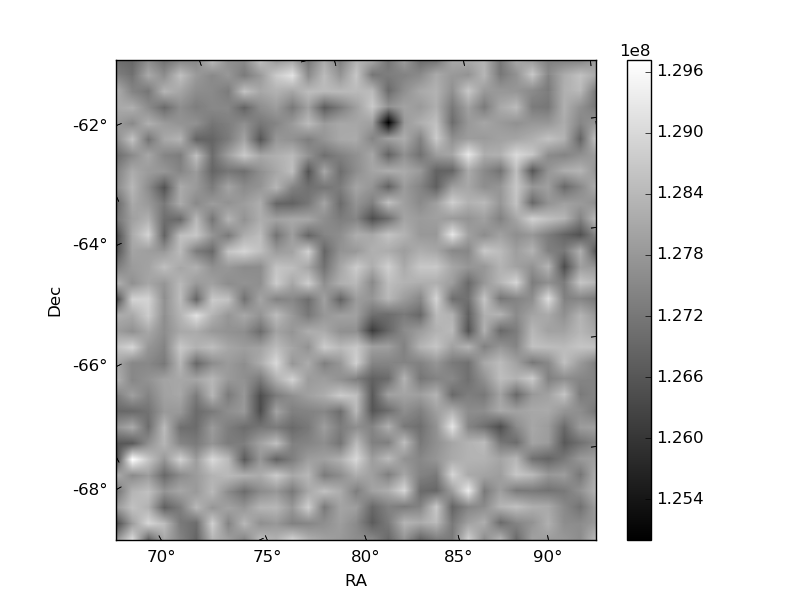
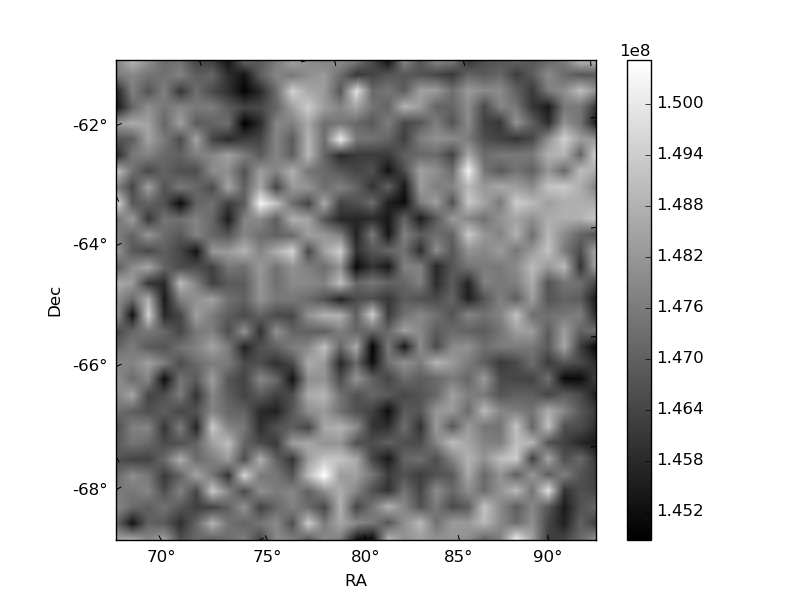
Histogram calculated using DETX and DETY for each event in the final _common_clean file
| Quadrant A | 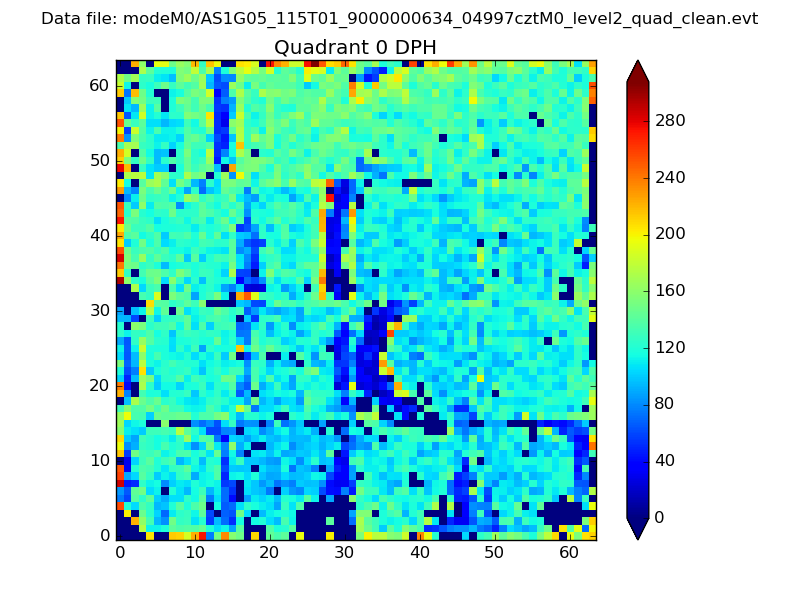 |
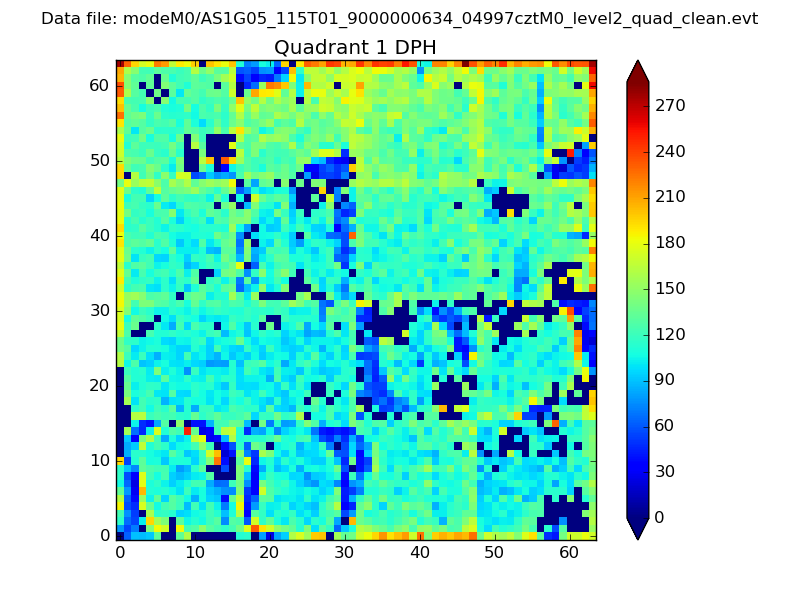 |
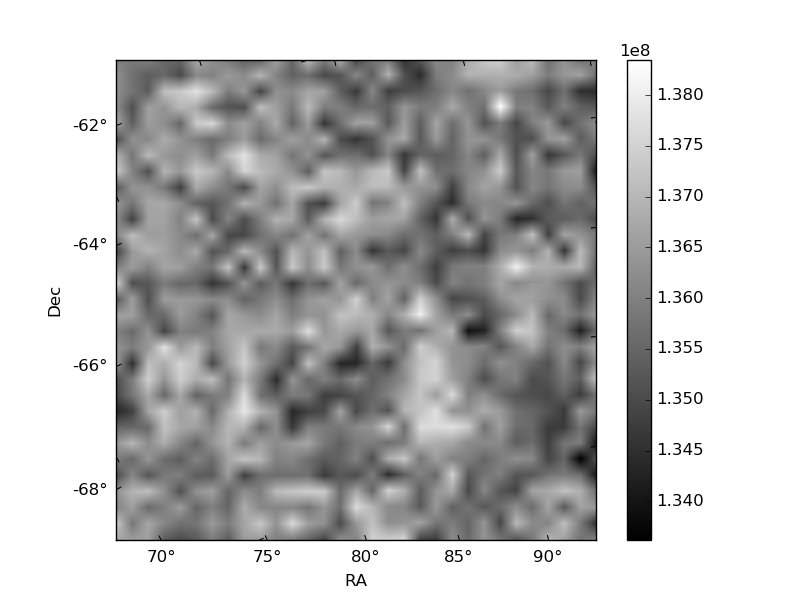
Quadrant B |
|---|---|---|---|
| Quadrant D | 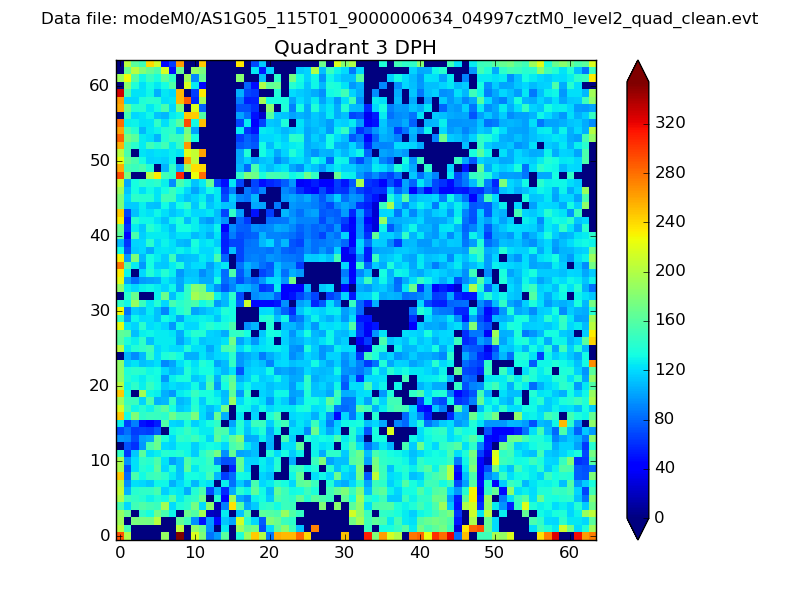 |
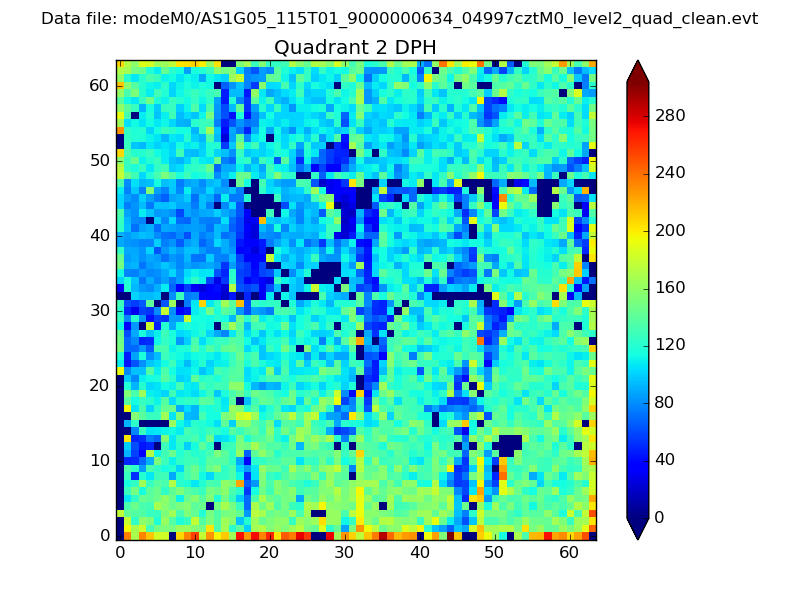 |
Quadrant C |
| Plot type | Count rate plots | Images |
|---|---|---|
| Comparison with Poisson distribution Blue bars denote a histogram of data divided into 1 sec bins. Red curve is a Poisson curve with rate = median count rate of data. |
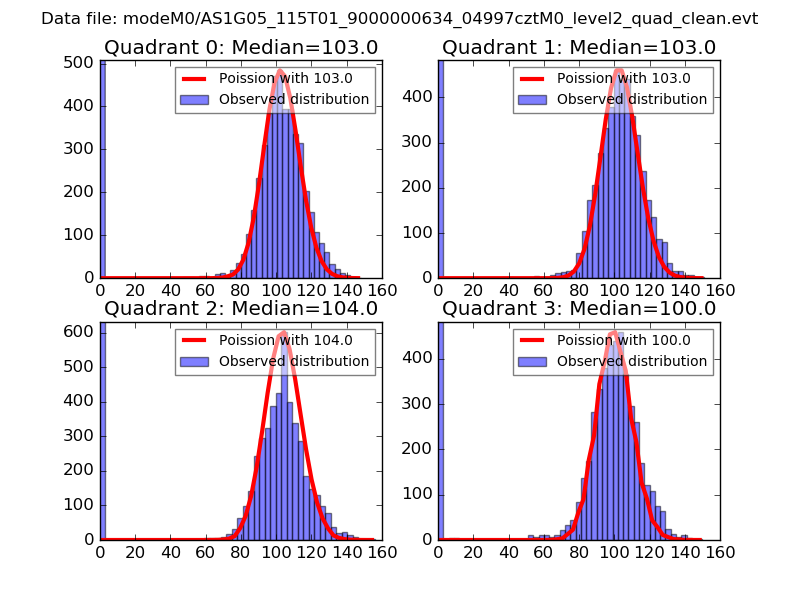 |
 |
| Quadrant-wise count rates Data is divided into 100 sec bins |
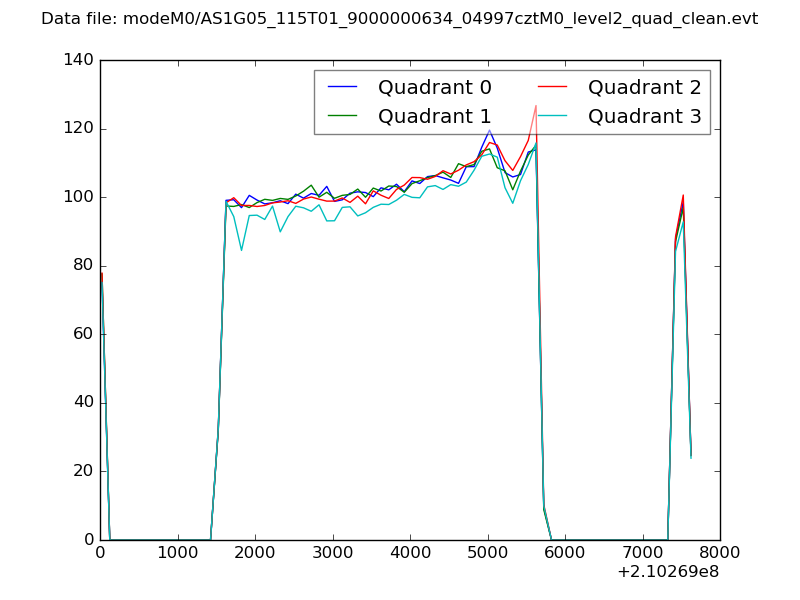 |
|
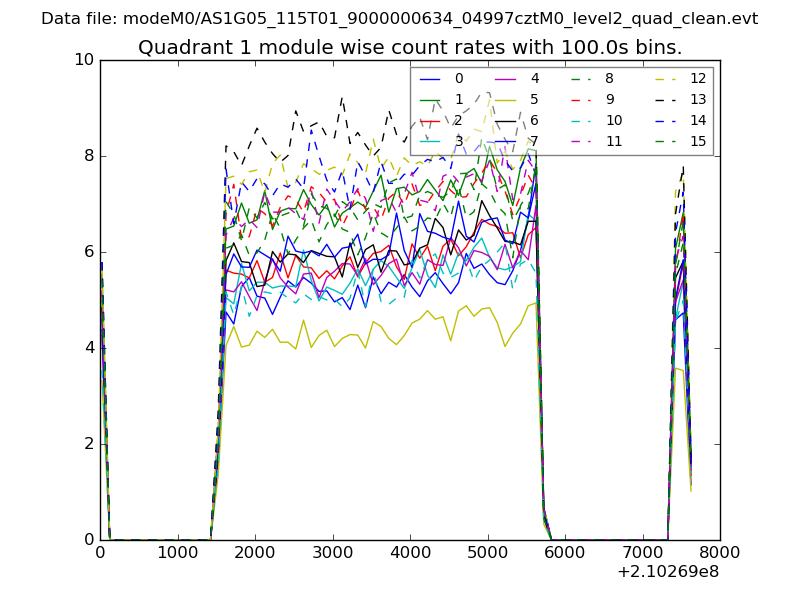
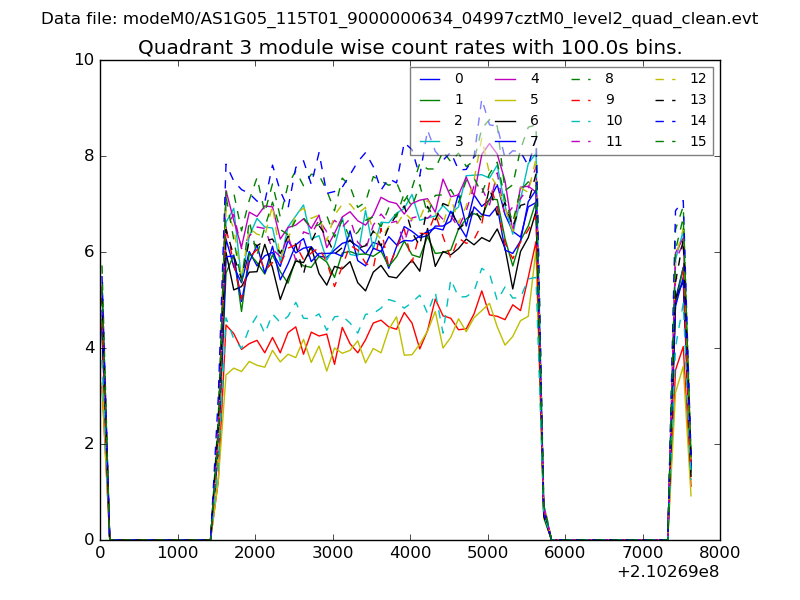
| Module-wise count rates for Quadrant A Data is divided into 100 sec bins |
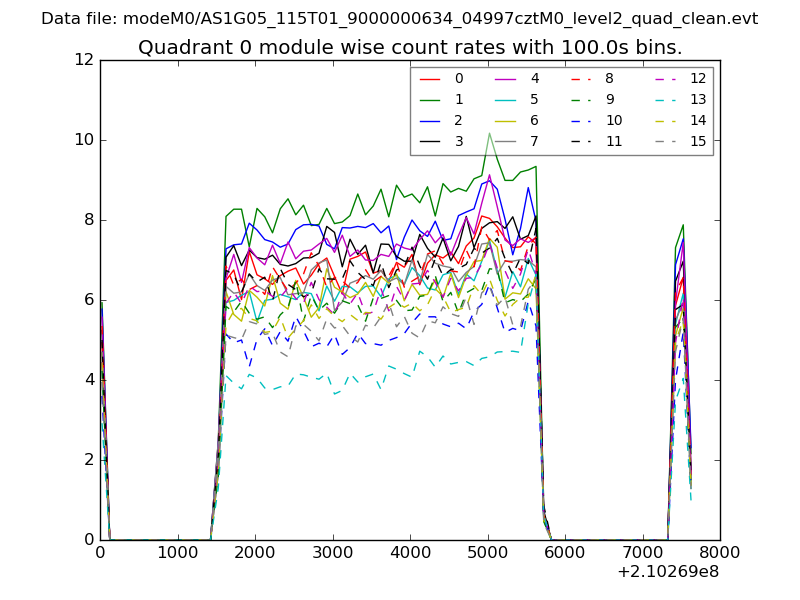 |
 |
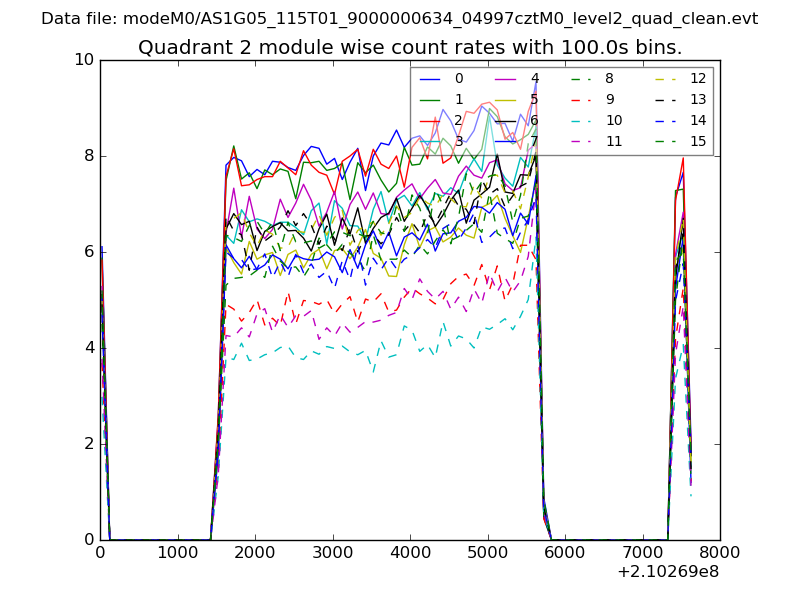
| Module-wise count rates for Quadrant B Data is divided into 100 sec bins |
 |
 |
| Module-wise count rates for Quadrant C Data is divided into 100 sec bins |
 |
 |
| Module-wise count rates for Quadrant D Data is divided into 100 sec bins |
 |
 |
| Parameter | Plot |
|---|---|
| CZT HV Monitor | 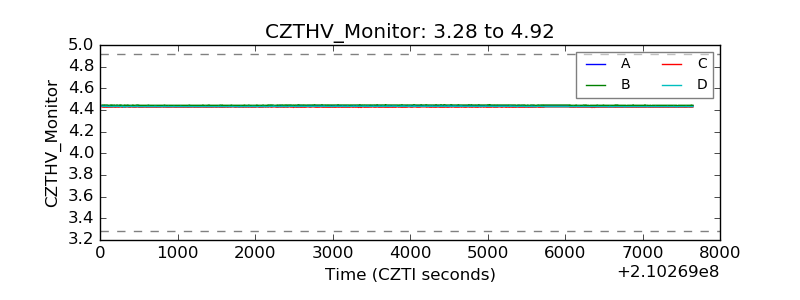 |
| D_VDD | 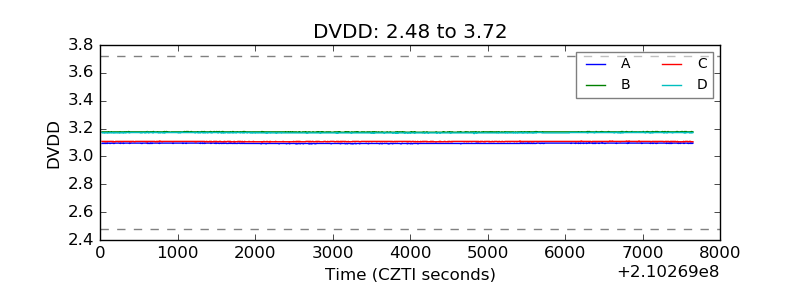 |
| Temperature 1 | 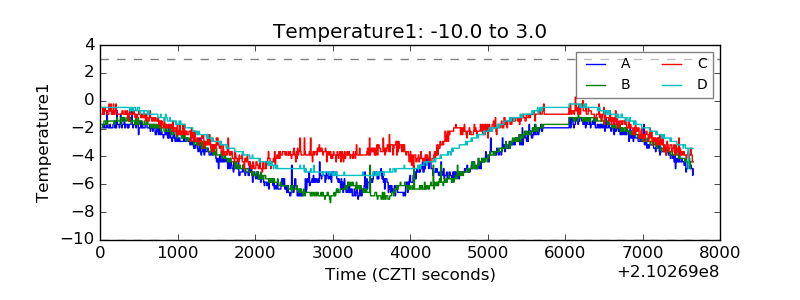 |
| Veto HV Monitor | 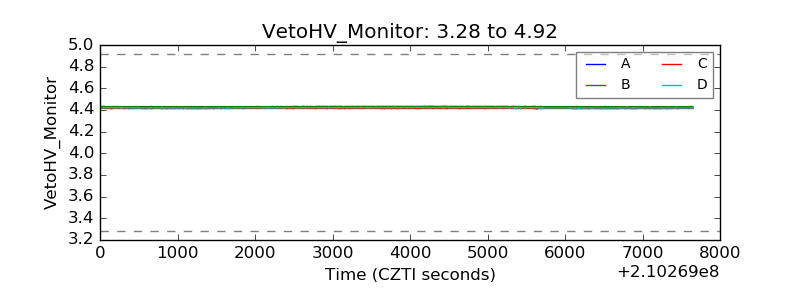 |
| Veto LLD | 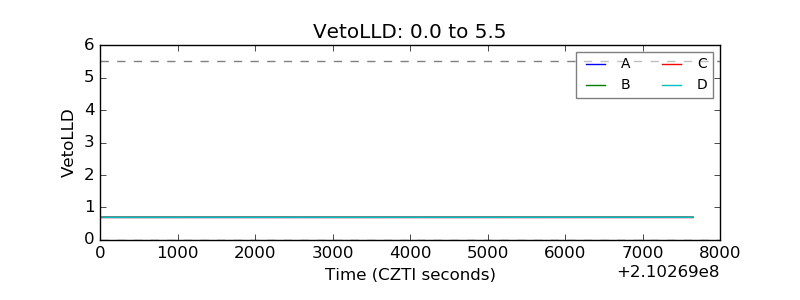 |
| Alpha Counter | 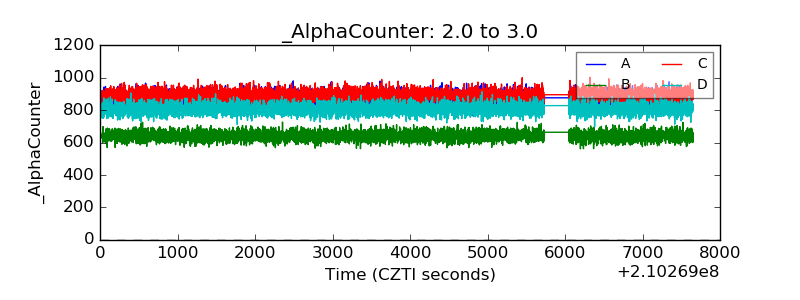 |
| _CPM_Rate | 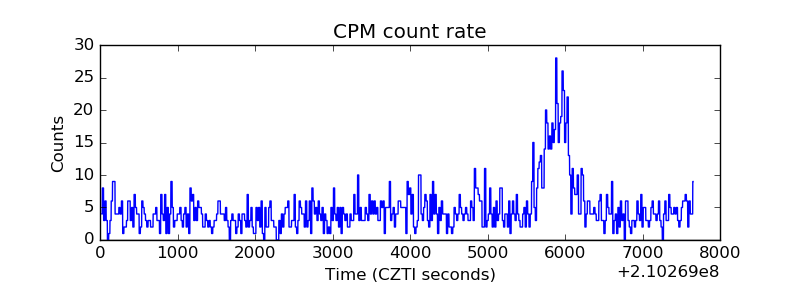 |
| CZT Counter | 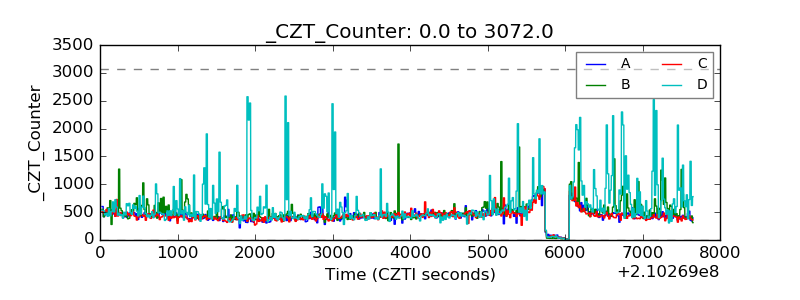 |
| +2.5 Volts monitor | 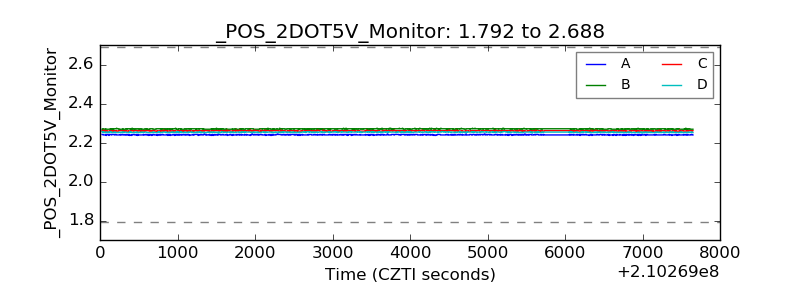 |
| +5 Volts monitor | 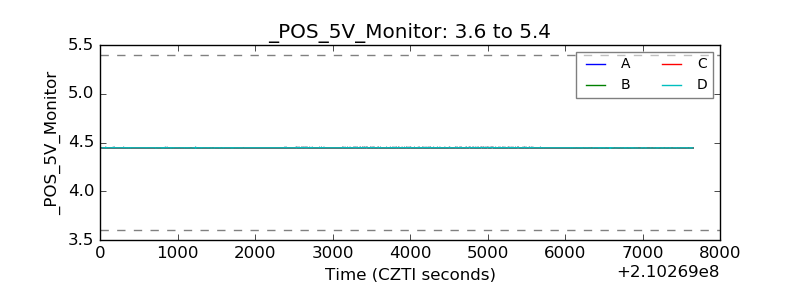 |
| _ROLL_ROT | 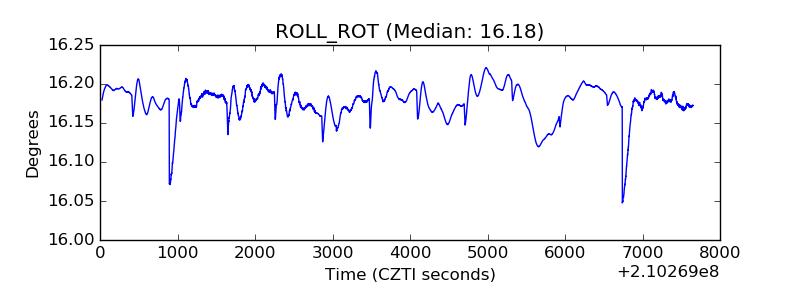 |
| _Roll_DEC | 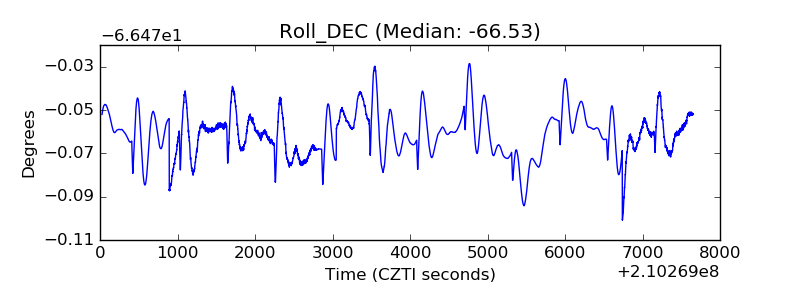 |
| _Roll_RA | 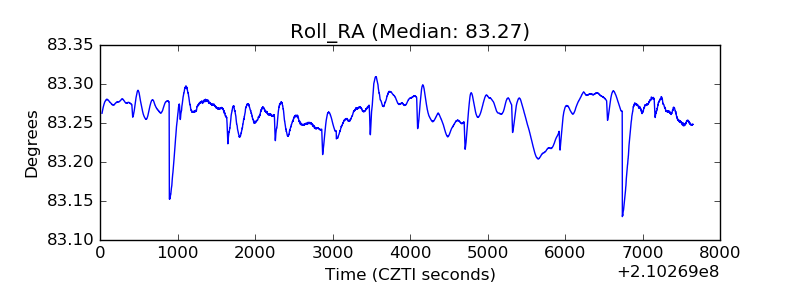 |
| Veto Counter | 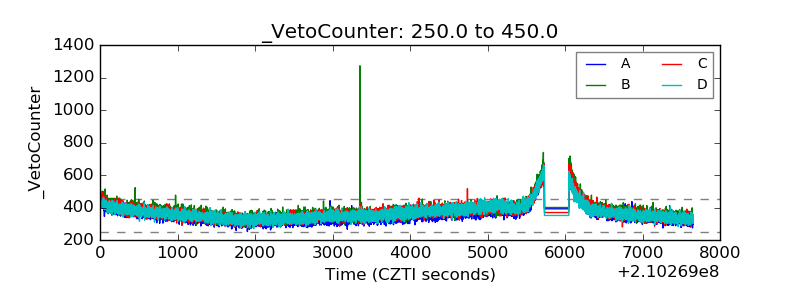 |