| Param | Original file | Final file |
|---|---|---|
| Filename | modeM0/AS1G05_115T01_9000000634_04998cztM0_level2.evt | modeM0/AS1G05_115T01_9000000634_04998cztM0_level2_quad_clean.evt |
| Size (bytes) | 553,927,680 | 84,237,120 |
| Size | 528.3 MB | 80.3 MB |
| Events in quadrant A | 3,470,641 | 510,272 |
| Events in quadrant B | 3,937,007 | 512,997 |
| Events in quadrant C | 3,325,999 | 513,880 |
| Events in quadrant D | 5,526,130 | 484,669 |
| Mode M0 | |||
|---|---|---|---|
| Quadrant | BADHDUFLAG | Total packets | Discarded packets |
| A | 0 | 15769 | 3 |
| B | 0 | 16995 | 2 |
| C | 0 | 15549 | 4 |
| D | 0 | 21719 | 6 |
| Mode SS | |||
|---|---|---|---|
| Quadrant | BADHDUFLAG | Total packets | Discarded packets |
| A | 0 | 152 | 0 |
| B | 0 | 152 | 0 |
| C | 0 | 152 | 0 |
| D | 0 | 152 | 0 |
| Quadrant | Total seconds | Saturated seconds | Saturation percentage |
|---|---|---|---|
| A | 7603 | 115 | 1.512561% |
| B | 7603 | 197 | 2.591082% |
| C | 7602 | 45 | 0.591949% |
| D | 7601 | 425 | 5.591370% |
Noise dominated data is calculated using 1-second bins in cleaned event files. If a bin has >2000 counts, and if more than 50% of those come from <1% of pixels, then it is considered to be noise-dominated and hence unusable.
| Quadrant | # 1 sec bins | Bins with >0 counts | Bins with >2000 counts | High rate bins dominated by noise | Noise dominated (total time) | Noise dominated (detector-on time) | Marked lightcurve |
|---|---|---|---|---|---|---|---|
| A | 7683 | 7605 | 1 | 1 | 0.01% | 0.01% | 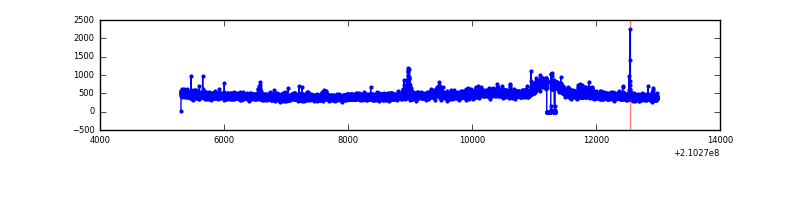 |
| B | 7683 | 7605 | 2 | 2 | 0.03% | 0.03% | 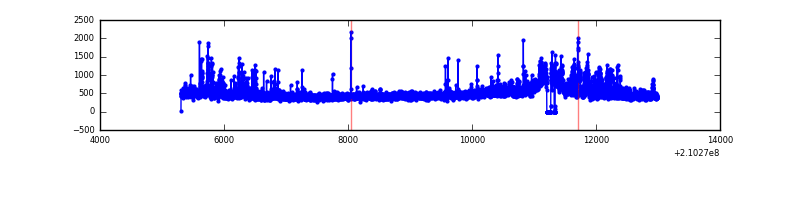 |
| C | 7683 | 7605 | 0 | 0 | 0.00% | 0.00% | 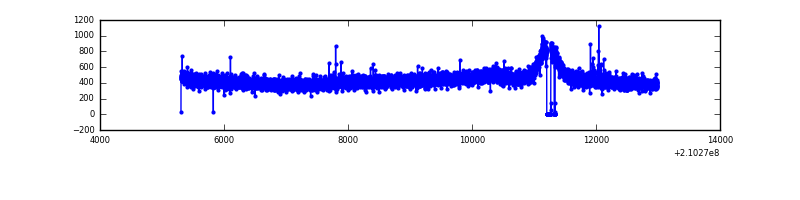 |
| D | 7683 | 7605 | 316 | 316 | 4.11% | 4.16% | 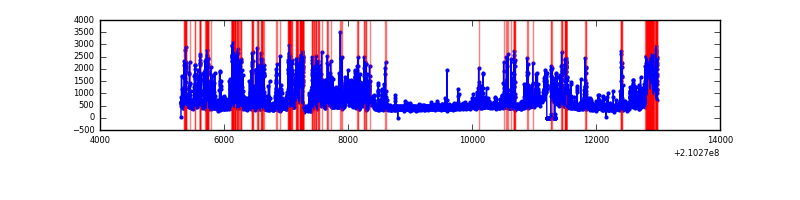 |
Top three noisy pixels from each quadrant. If the there are fewer than three noisy pixels in the level2.evt file, extra rows are filled as -1
| Pixel properties | Quadrant properties | ||||||
|---|---|---|---|---|---|---|---|
| Quadrant | DetID | PixID | Counts | Sigma | Mean | Median | Sigma |
| A | 13 | 251 | 68878 | 382.35 | 873 | 854 | 177.9 |
| A | 0 | 50 | 22482 | 121.57 | 873 | 854 | 177.9 |
| A | 12 | 194 | 8948 | 45.49 | 873 | 854 | 177.9 |
| B | 15 | 204 | 289713 | 1707.6 | 877 | 857 | 169.2 |
| B | 0 | 219 | 116445 | 683.31 | 877 | 857 | 169.2 |
| B | 4 | 80 | 49169 | 285.6 | 877 | 857 | 169.2 |
| C | 13 | 61 | 7010 | 31.39 | 849 | 852 | 196.2 |
| C | 1 | 16 | 5850 | 25.47 | 849 | 852 | 196.2 |
| C | 12 | 4 | 3802 | 15.04 | 849 | 852 | 196.2 |
| D | 13 | 235 | 1232201 | 5956.07 | 834 | 805 | 206.7 |
| D | 2 | 33 | 472849 | 2283.2 | 834 | 805 | 206.7 |
| D | 12 | 233 | 223140 | 1075.4 | 834 | 805 | 206.7 |
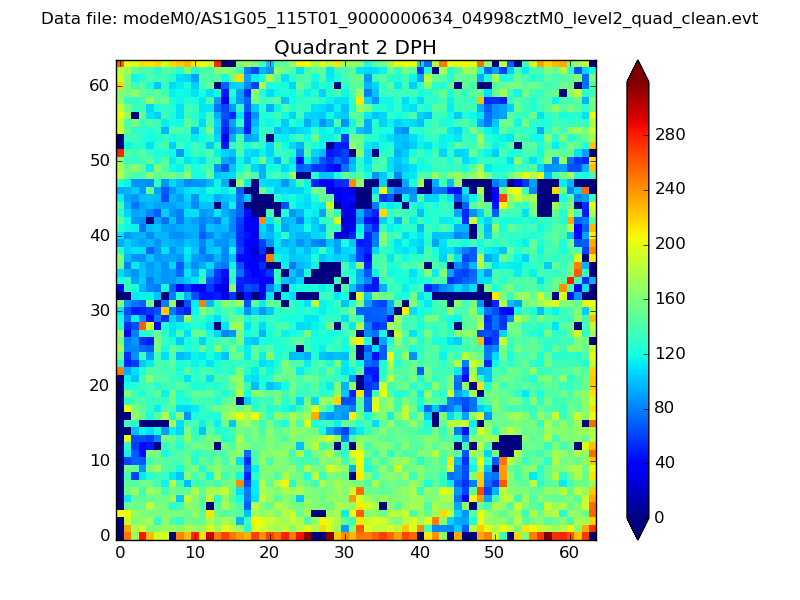
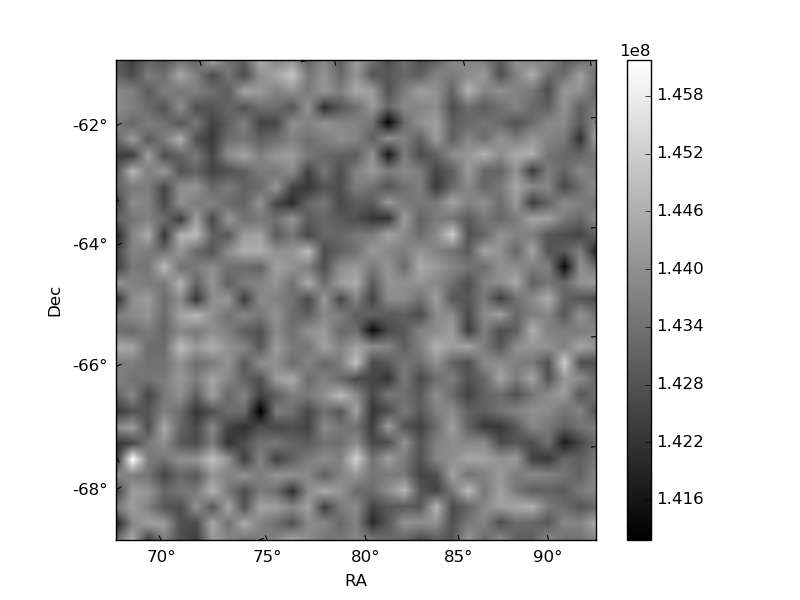
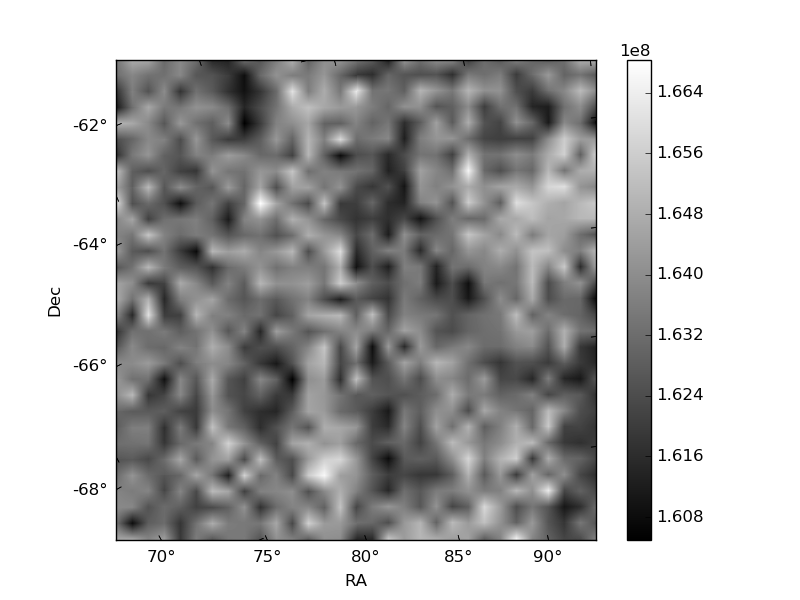
Histogram calculated using DETX and DETY for each event in the final _common_clean file
| Quadrant A | 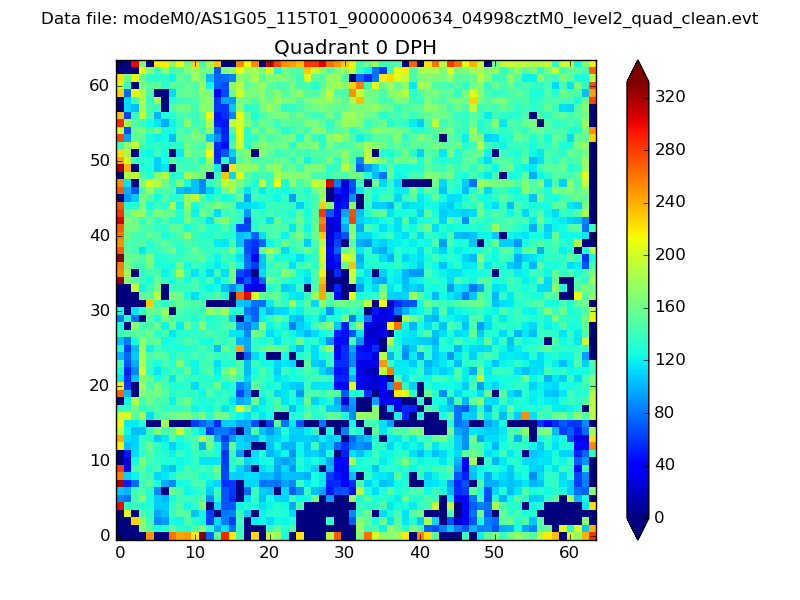 |
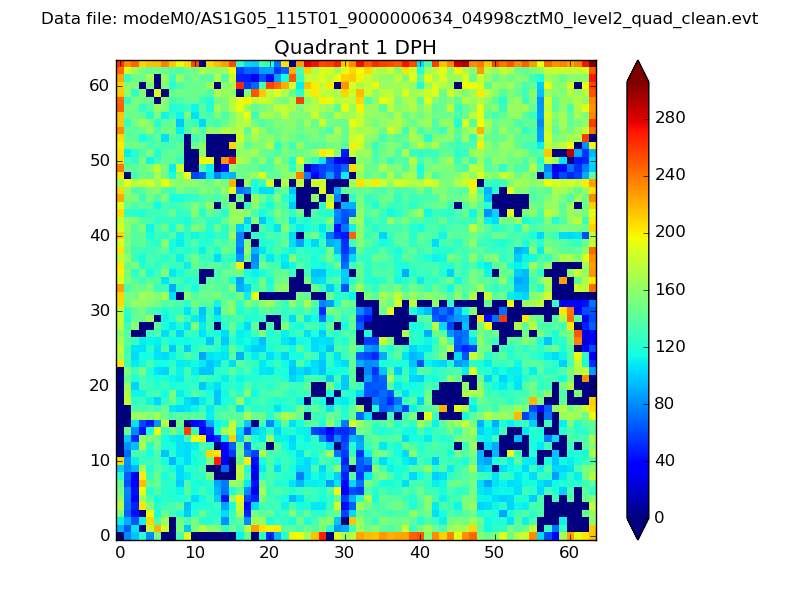 |
Quadrant B |
|---|---|---|---|
| Quadrant D | 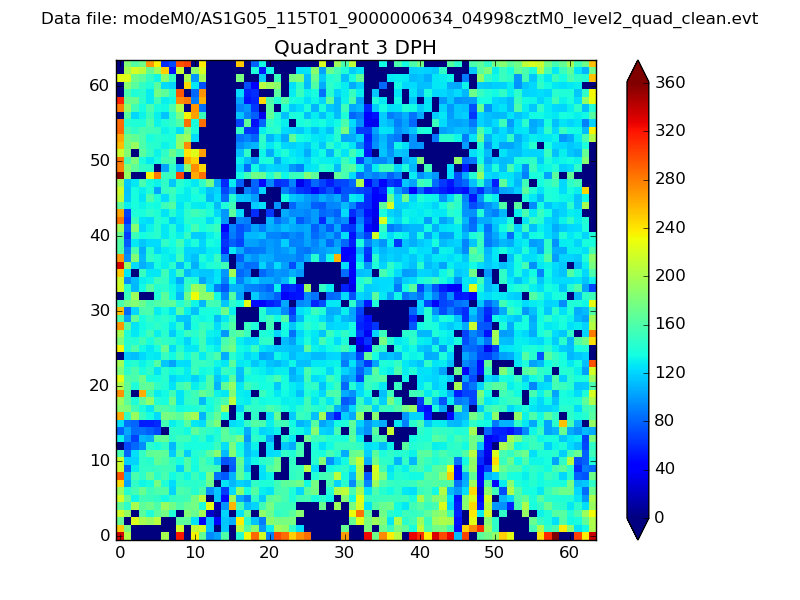 |
 |
Quadrant C |
| Plot type | Count rate plots | Images |
|---|---|---|
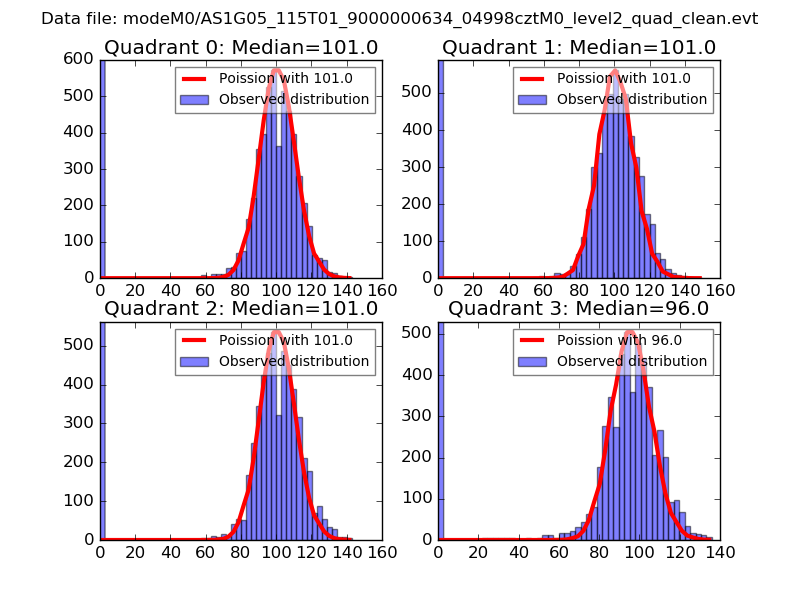
| Comparison with Poisson distribution Blue bars denote a histogram of data divided into 1 sec bins. Red curve is a Poisson curve with rate = median count rate of data. |
 |
 |
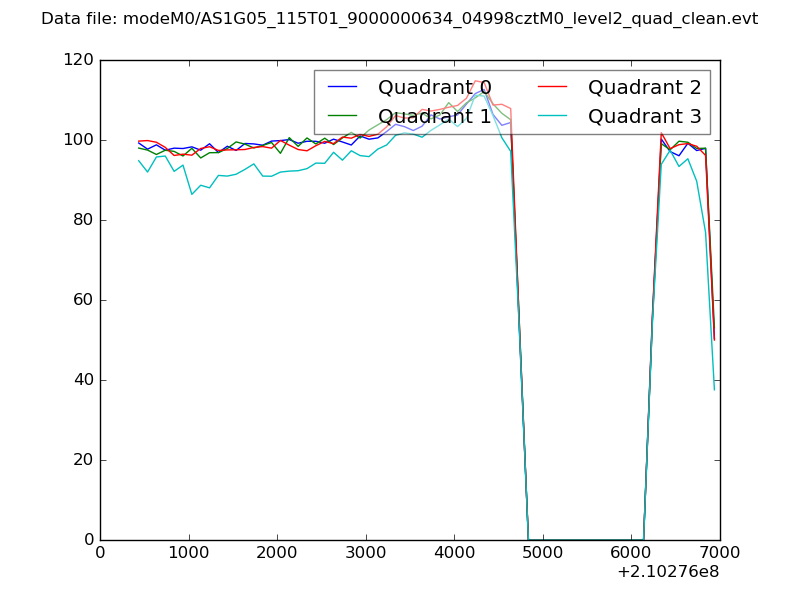
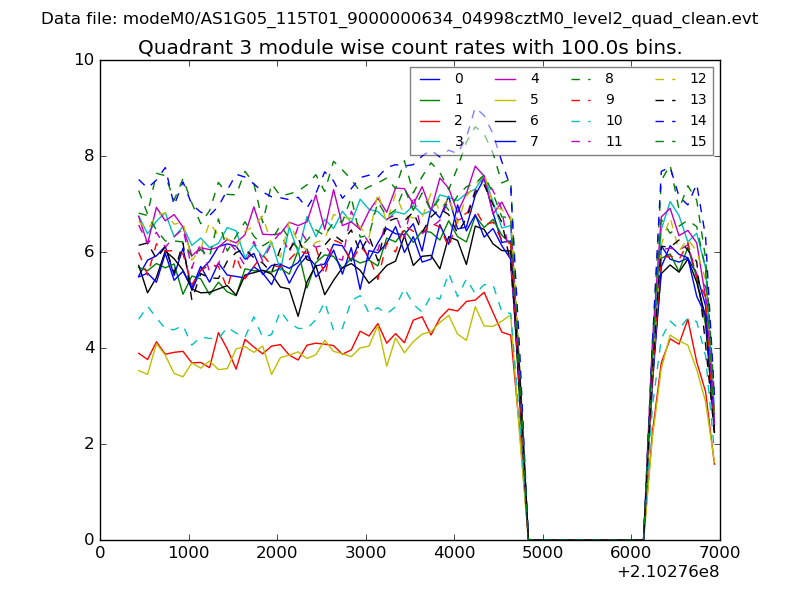
| Quadrant-wise count rates Data is divided into 100 sec bins |
 |
|
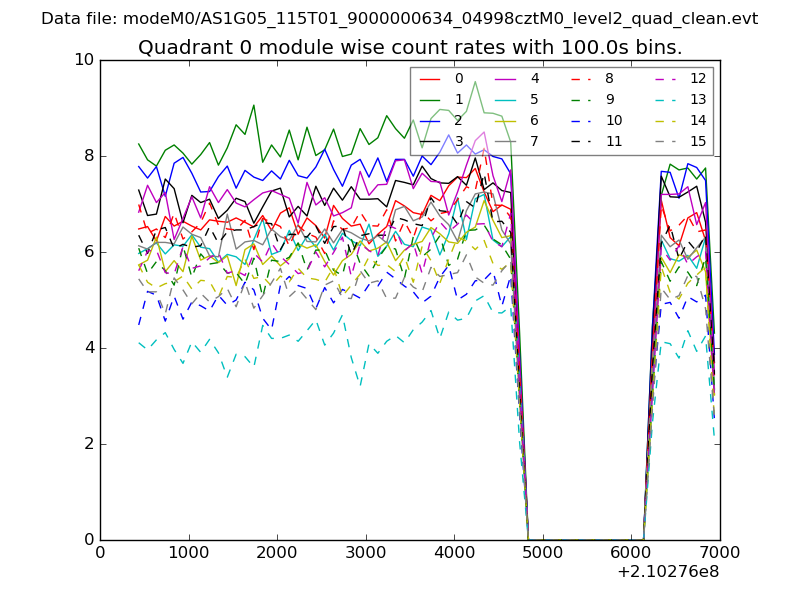
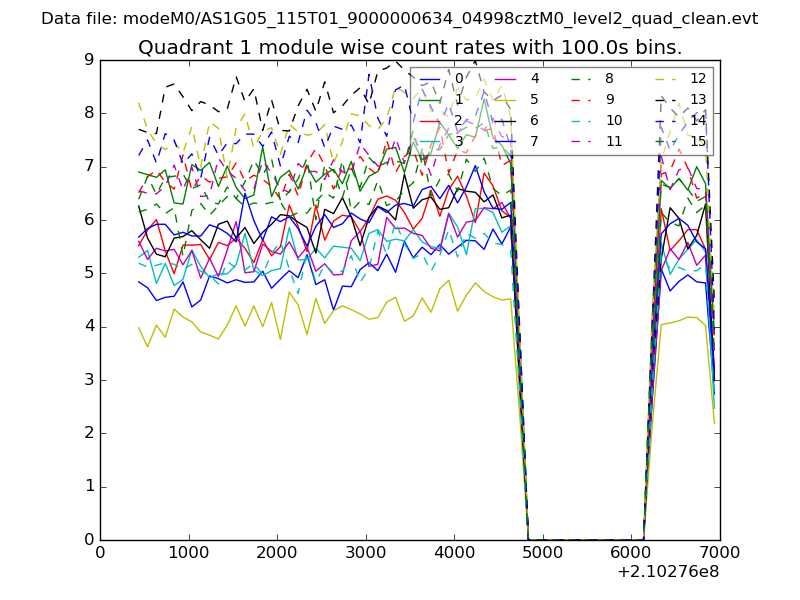
| Module-wise count rates for Quadrant A Data is divided into 100 sec bins |
 |
 |
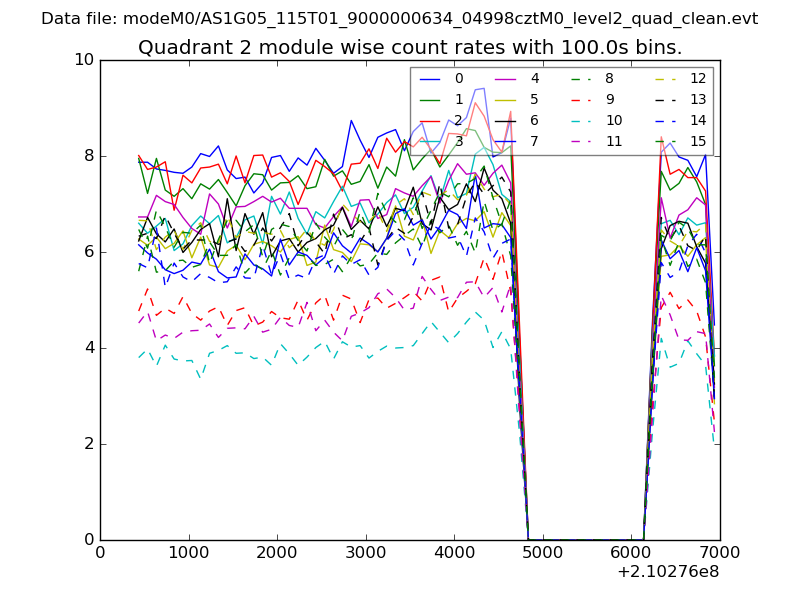
| Module-wise count rates for Quadrant B Data is divided into 100 sec bins |
 |
 |
| Module-wise count rates for Quadrant C Data is divided into 100 sec bins |
 |
 |
| Module-wise count rates for Quadrant D Data is divided into 100 sec bins |
 |
 |
| Parameter | Plot |
|---|---|
| CZT HV Monitor | 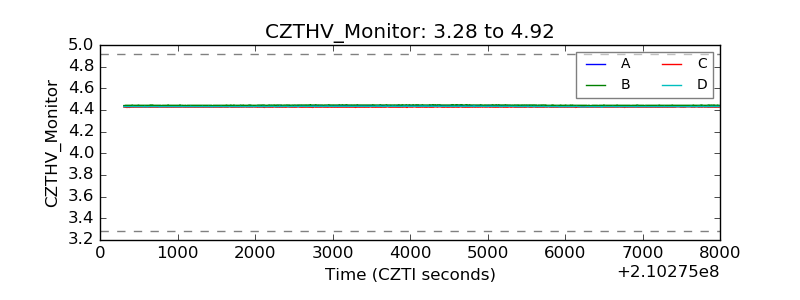 |
| D_VDD | 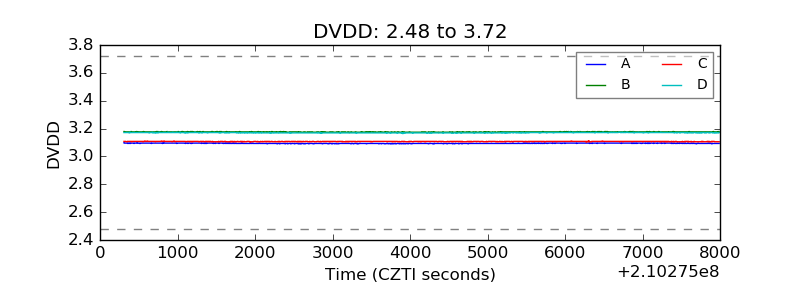 |
| Temperature 1 | 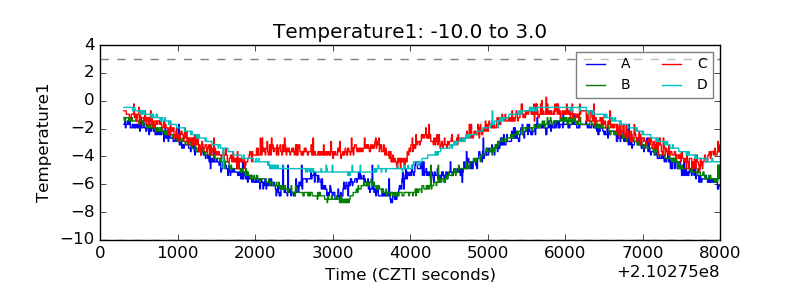 |
| Veto HV Monitor | 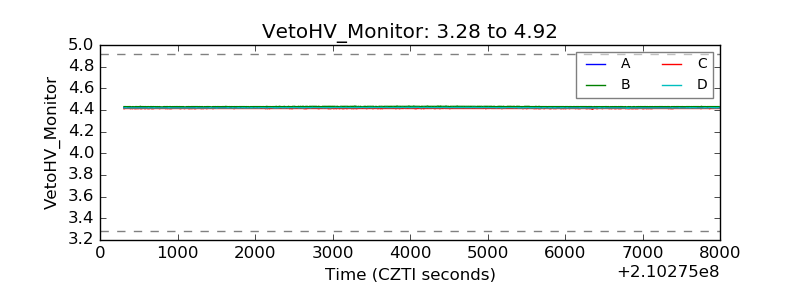 |
| Veto LLD | 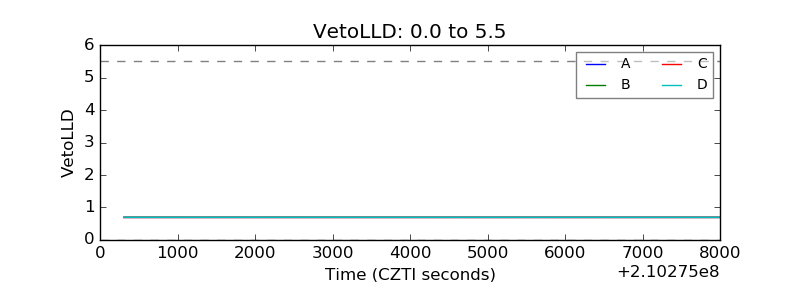 |
| Alpha Counter | 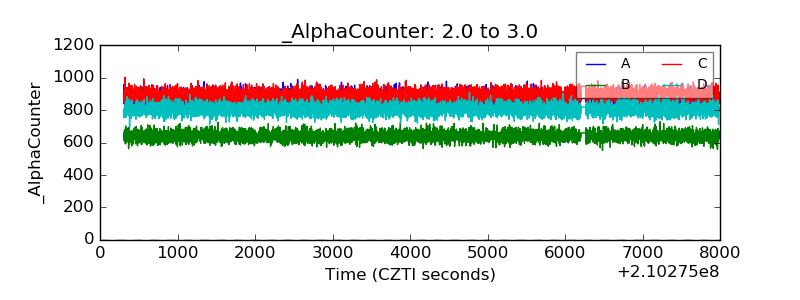 |
| _CPM_Rate | 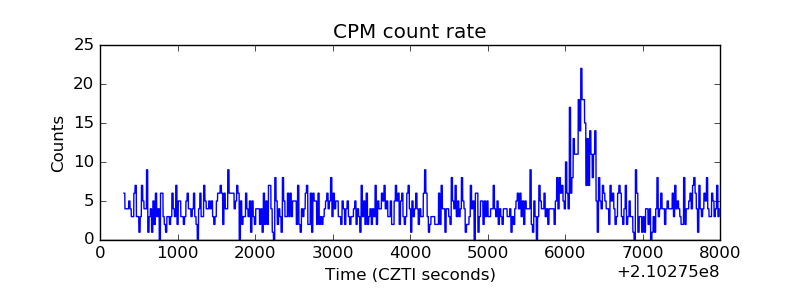 |
| CZT Counter | 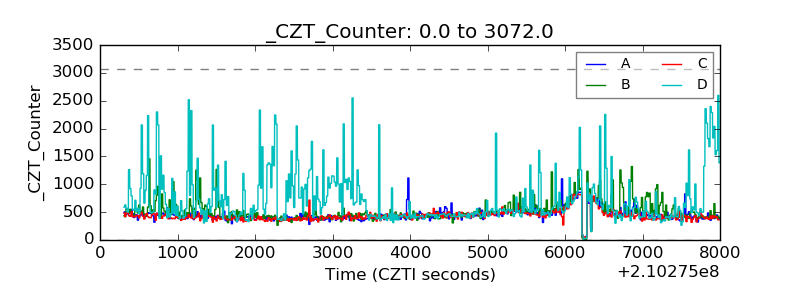 |
| +2.5 Volts monitor | 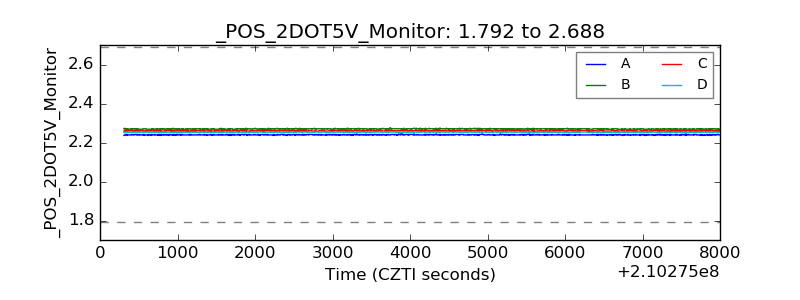 |
| +5 Volts monitor |  |
| _ROLL_ROT | 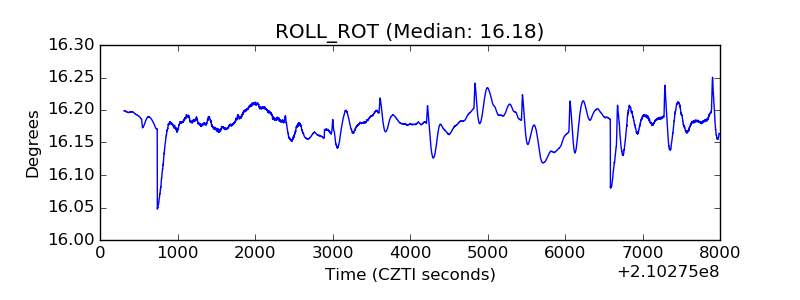 |
| _Roll_DEC | 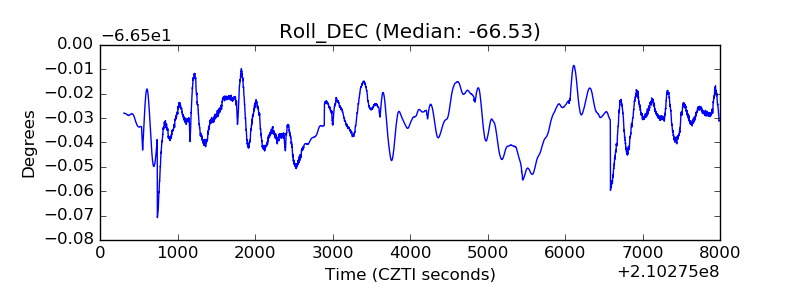 |
| _Roll_RA | 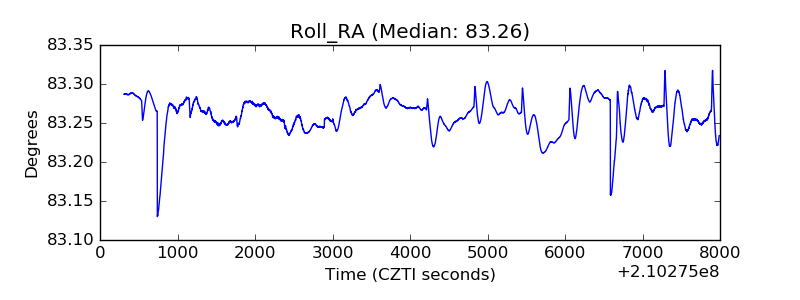 |
| Veto Counter | 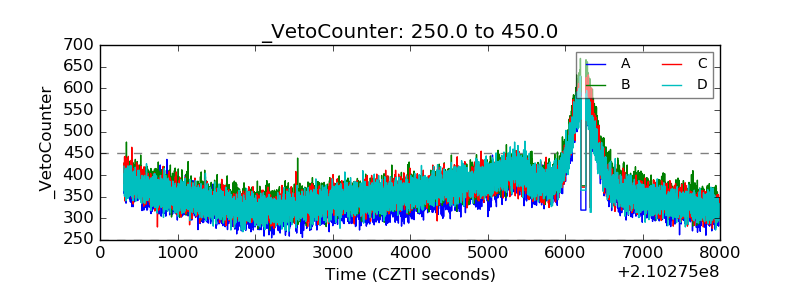 |