| Param | Original file | Final file |
|---|---|---|
| Filename | modeM0/AS1G05_115T01_9000000634_04999cztM0_level2.evt | modeM0/AS1G05_115T01_9000000634_04999cztM0_level2_quad_clean.evt |
| Size (bytes) | 232,125,120 | 46,396,800 |
| Size | 221.4 MB | 44.2 MB |
| Events in quadrant A | 1,550,993 | 293,159 |
| Events in quadrant B | 1,755,769 | 292,093 |
| Events in quadrant C | 1,534,059 | 294,076 |
| Events in quadrant D | 1,939,471 | 268,084 |
| Mode M0 | |||
|---|---|---|---|
| Quadrant | BADHDUFLAG | Total packets | Discarded packets |
| A | 0 | 9148 | 1728 |
| B | 0 | 9834 | 2031 |
| C | 0 | 9090 | 1714 |
| D | 0 | 11731 | 3386 |
| Mode SS | |||
|---|---|---|---|
| Quadrant | BADHDUFLAG | Total packets | Discarded packets |
| A | 0 | 90 | 22 |
| B | 0 | 90 | 12 |
| C | 0 | 90 | 16 |
| D | 0 | 90 | 18 |
| Quadrant | Total seconds | Saturated seconds | Saturation percentage |
|---|---|---|---|
| A | 3676 | 2 | 0.054407% |
| B | 3619 | 10 | 0.276319% |
| C | 3676 | 1 | 0.027203% |
| D | 3513 | 91 | 2.590379% |
Noise dominated data is calculated using 1-second bins in cleaned event files. If a bin has >2000 counts, and if more than 50% of those come from <1% of pixels, then it is considered to be noise-dominated and hence unusable.
| Quadrant | # 1 sec bins | Bins with >0 counts | Bins with >2000 counts | High rate bins dominated by noise | Noise dominated (total time) | Noise dominated (detector-on time) | Marked lightcurve |
|---|---|---|---|---|---|---|---|
| A | 4533 | 4268 | 0 | 0 | 0.00% | 0.00% | 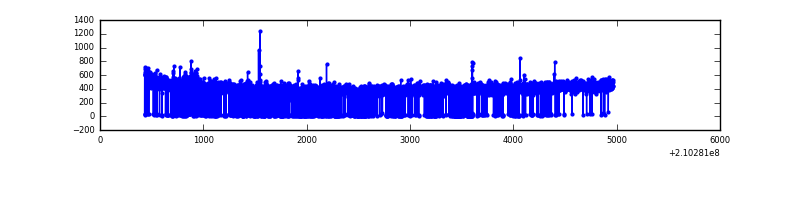 |
| B | 4531 | 4249 | 1 | 1 | 0.02% | 0.02% |  |
| C | 4533 | 4271 | 0 | 0 | 0.00% | 0.00% | 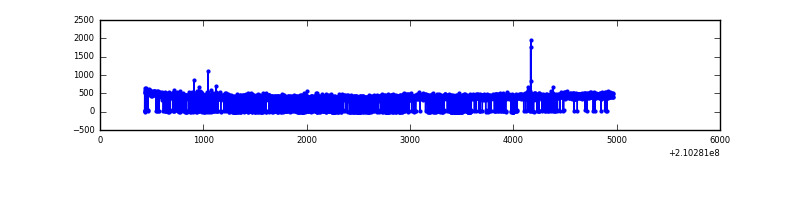 |
| D | 4533 | 4113 | 69 | 69 | 1.52% | 1.68% | 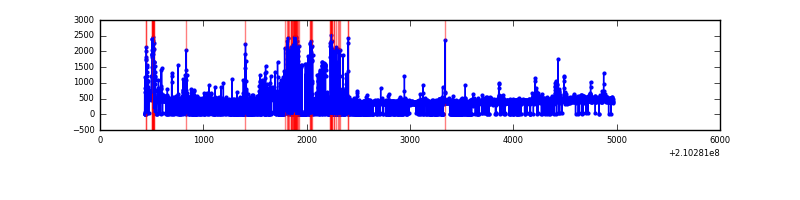 |
Top three noisy pixels from each quadrant. If the there are fewer than three noisy pixels in the level2.evt file, extra rows are filled as -1
| Pixel properties | Quadrant properties | ||||||
|---|---|---|---|---|---|---|---|
| Quadrant | DetID | PixID | Counts | Sigma | Mean | Median | Sigma |
| A | 13 | 251 | 14114 | 164.97 | 397 | 388 | 83.2 |
| A | 0 | 50 | 5260 | 58.55 | 397 | 388 | 83.2 |
| A | 12 | 194 | 3999 | 43.4 | 397 | 388 | 83.2 |
| B | 15 | 204 | 136051 | 1755.78 | 397 | 387 | 77.3 |
| B | 0 | 219 | 55685 | 715.67 | 397 | 387 | 77.3 |
| B | 8 | 3 | 11610 | 145.25 | 397 | 387 | 77.3 |
| C | 1 | 16 | 9405 | 99.17 | 390 | 390 | 90.9 |
| C | 13 | 61 | 3211 | 31.03 | 390 | 390 | 90.9 |
| C | 12 | 4 | 1727 | 14.71 | 390 | 390 | 90.9 |
| D | 13 | 235 | 268318 | 2913.59 | 369 | 357 | 92.0 |
| D | 2 | 33 | 97402 | 1055.19 | 369 | 357 | 92.0 |
| D | 2 | 63 | 62352 | 674.08 | 369 | 357 | 92.0 |
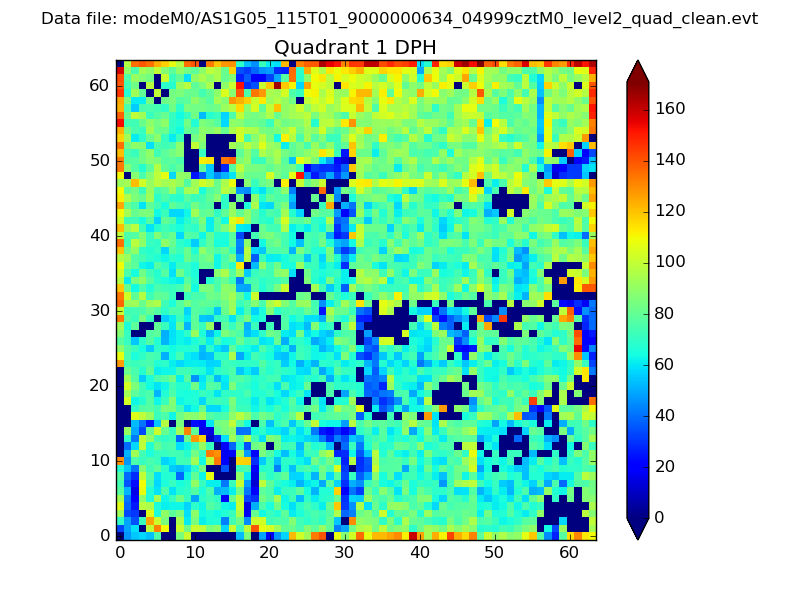
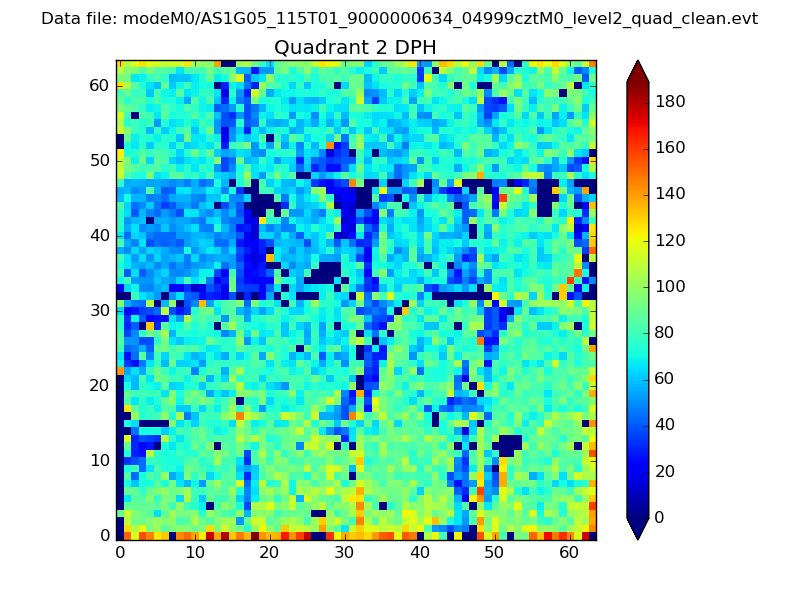
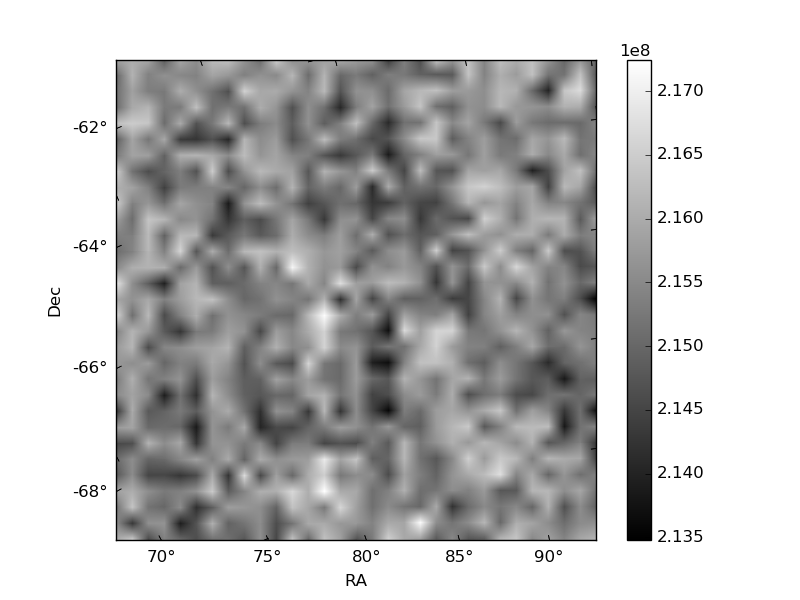
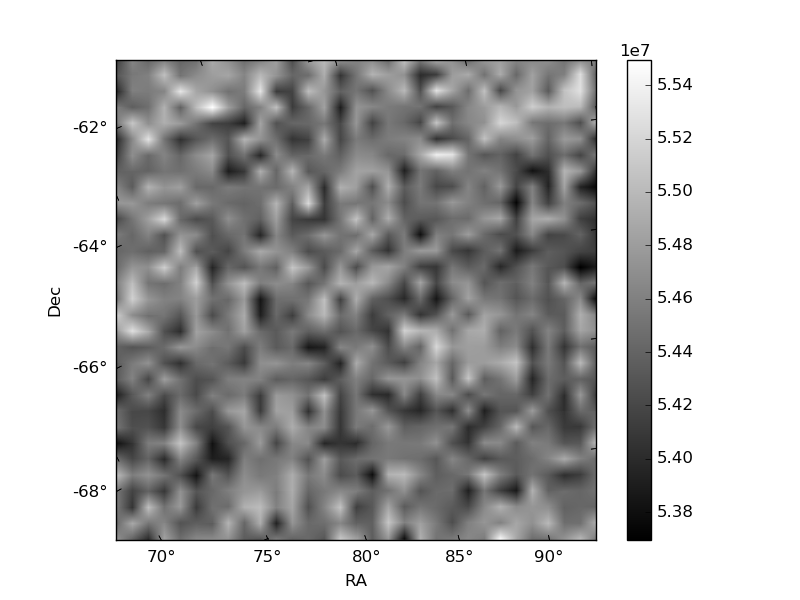
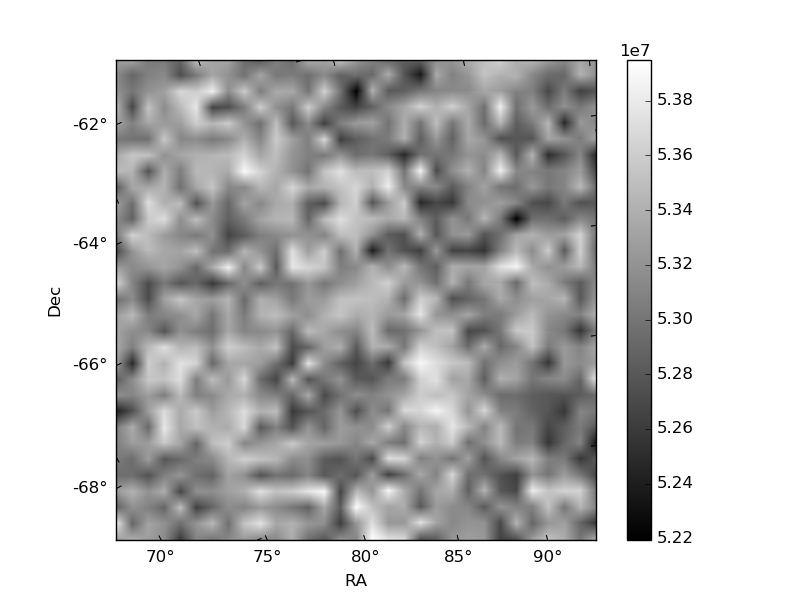
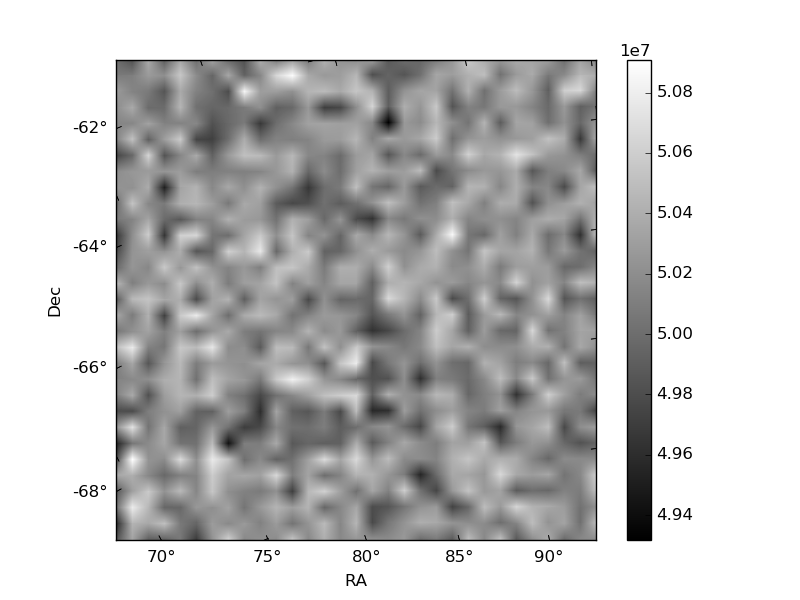
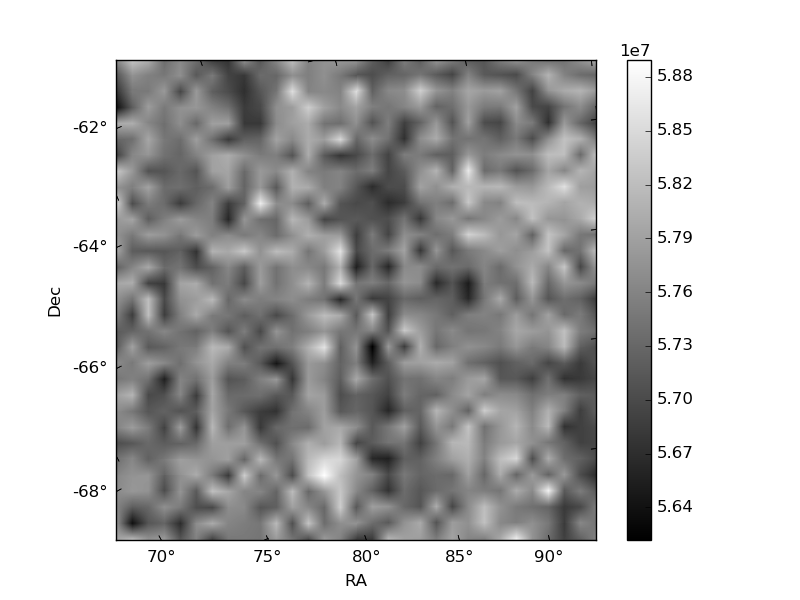
Histogram calculated using DETX and DETY for each event in the final _common_clean file
| Quadrant A | 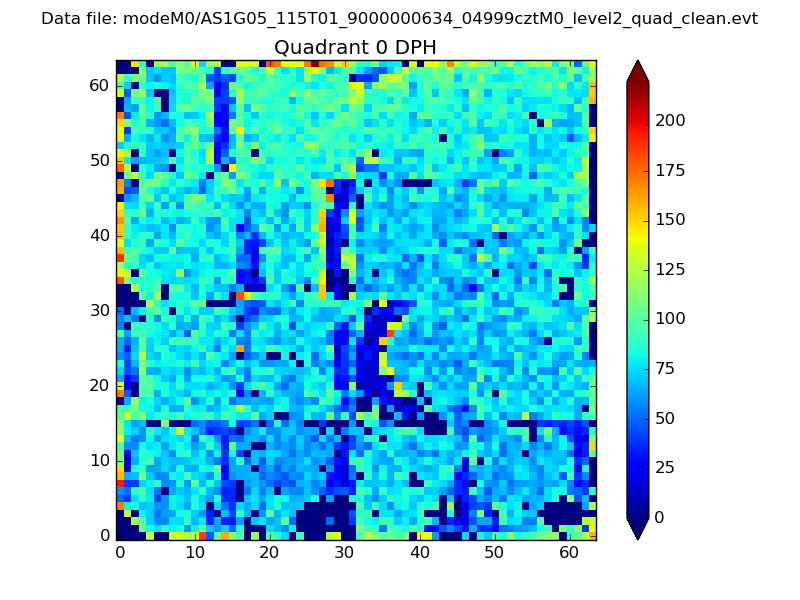 |
 |
Quadrant B |
|---|---|---|---|
| Quadrant D | 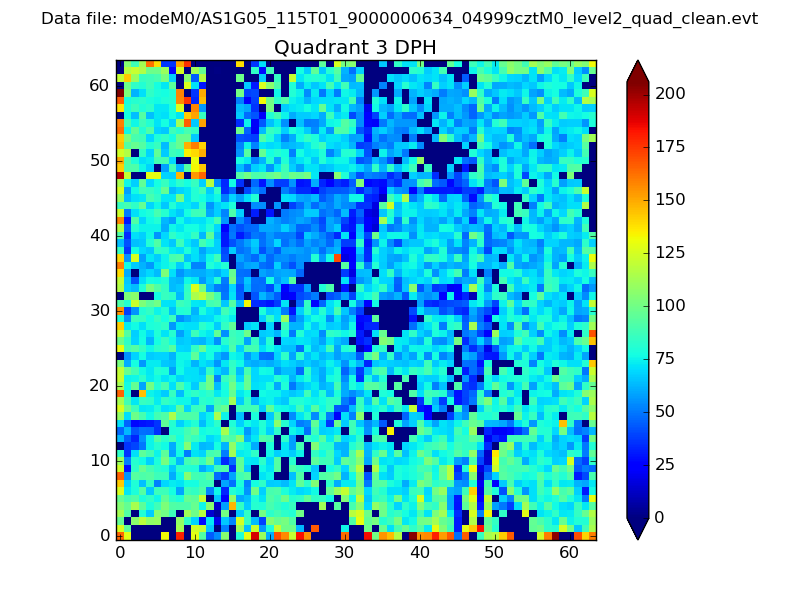 |
 |
Quadrant C |
| Plot type | Count rate plots | Images |
|---|---|---|
| Comparison with Poisson distribution Blue bars denote a histogram of data divided into 1 sec bins. Red curve is a Poisson curve with rate = median count rate of data. |
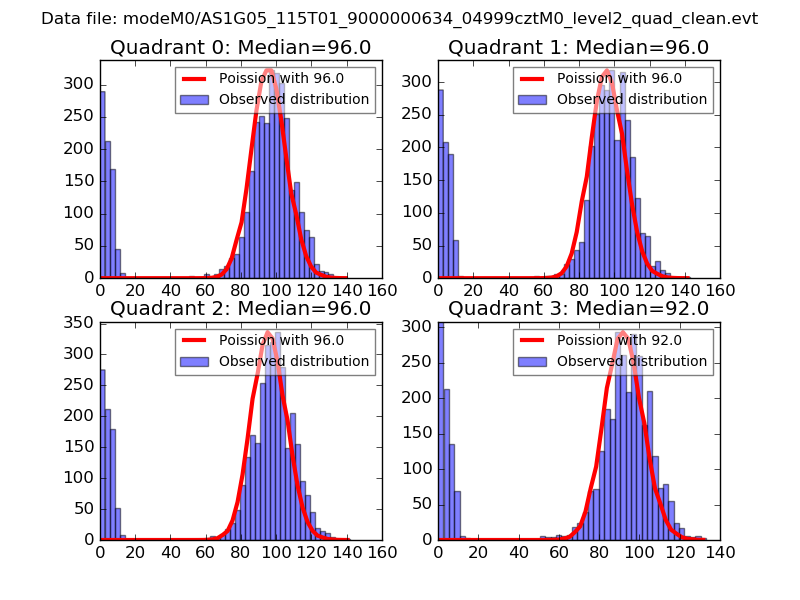 |
 |
| Quadrant-wise count rates Data is divided into 100 sec bins |
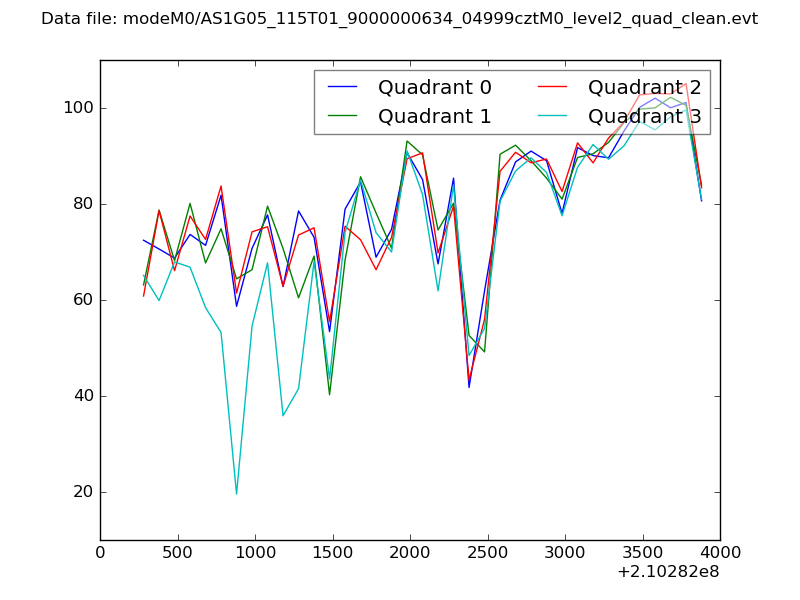 |
|
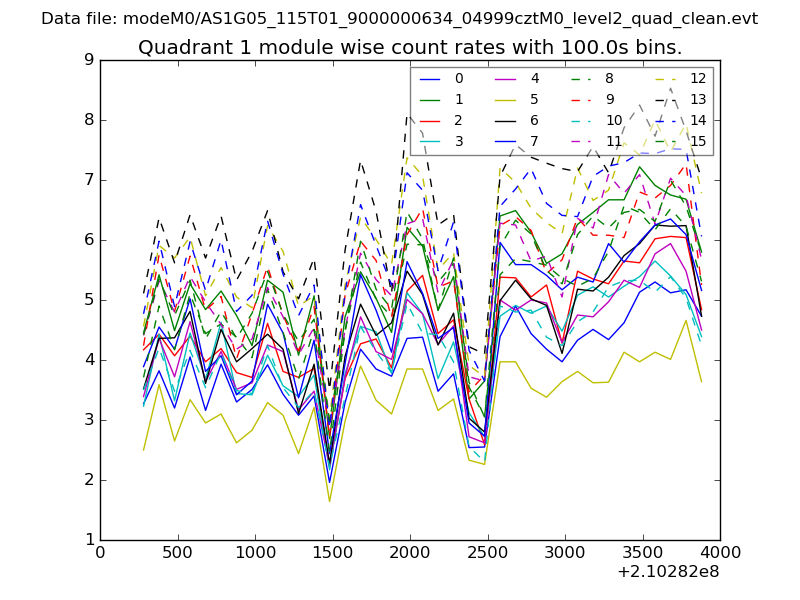
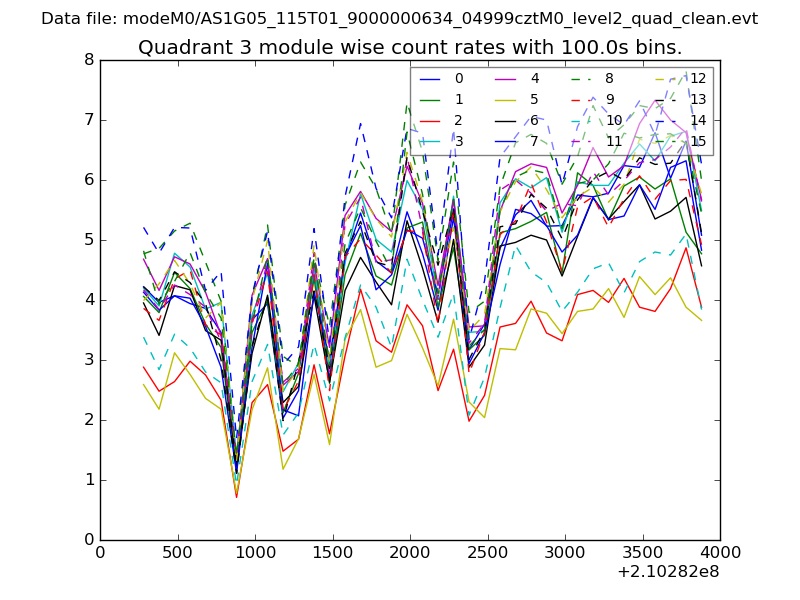
| Module-wise count rates for Quadrant A Data is divided into 100 sec bins |
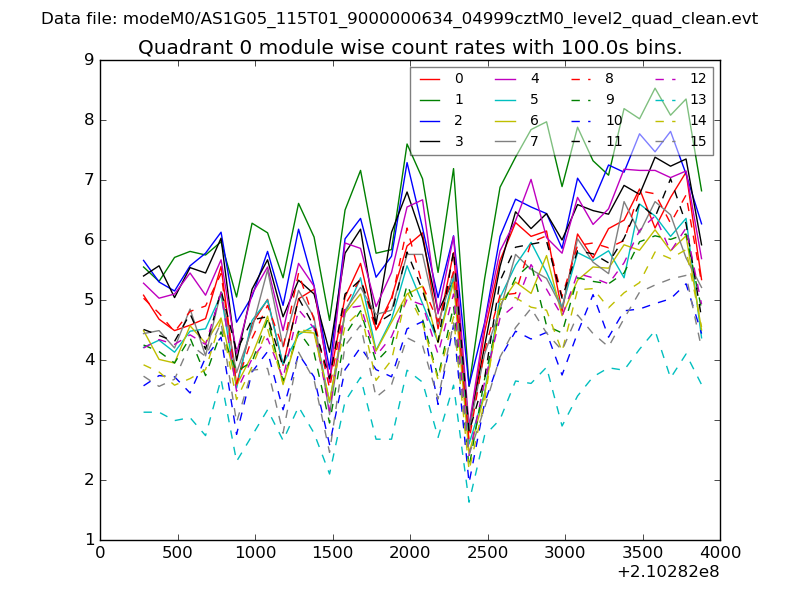 |
 |
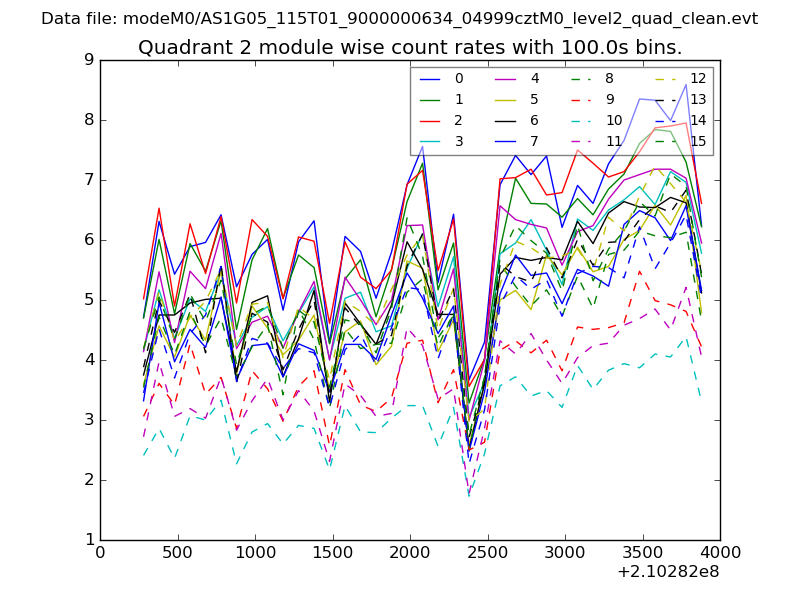
| Module-wise count rates for Quadrant B Data is divided into 100 sec bins |
 |
 |
| Module-wise count rates for Quadrant C Data is divided into 100 sec bins |
 |
 |
| Module-wise count rates for Quadrant D Data is divided into 100 sec bins |
 |
 |
| Parameter | Plot |
|---|---|
| CZT HV Monitor | 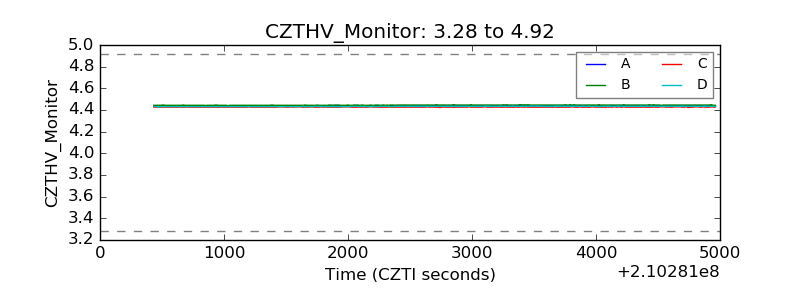 |
| D_VDD | 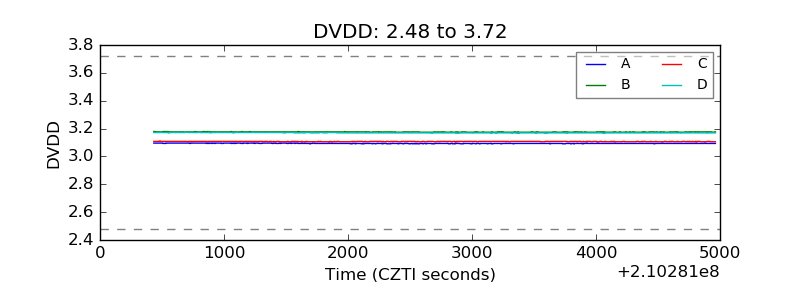 |
| Temperature 1 | 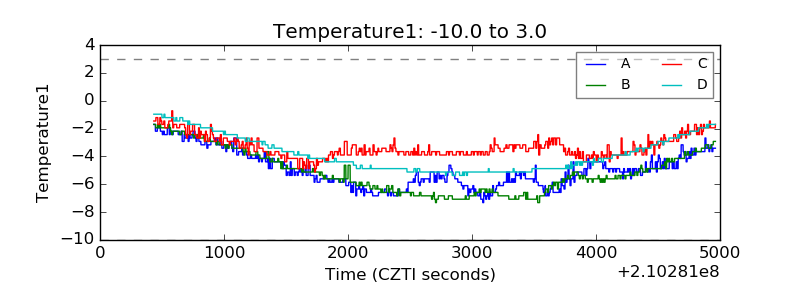 |
| Veto HV Monitor | 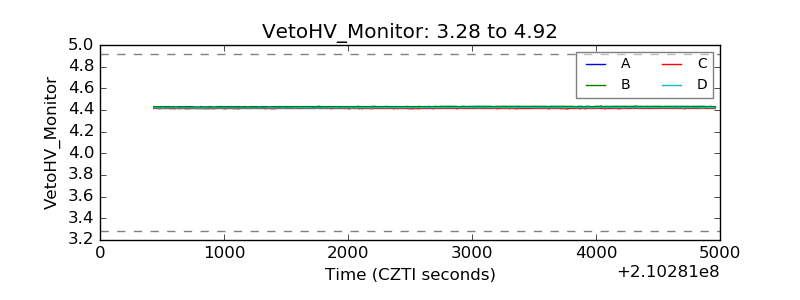 |
| Veto LLD | 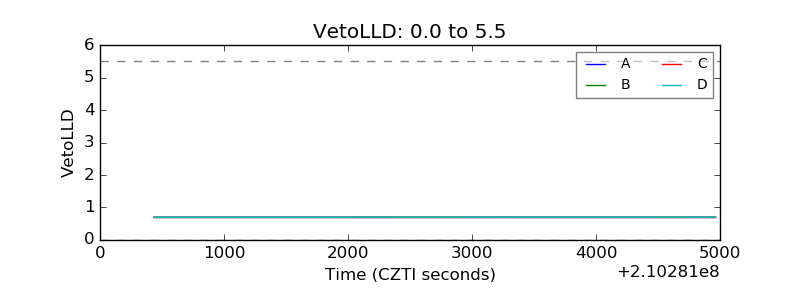 |
| Alpha Counter | 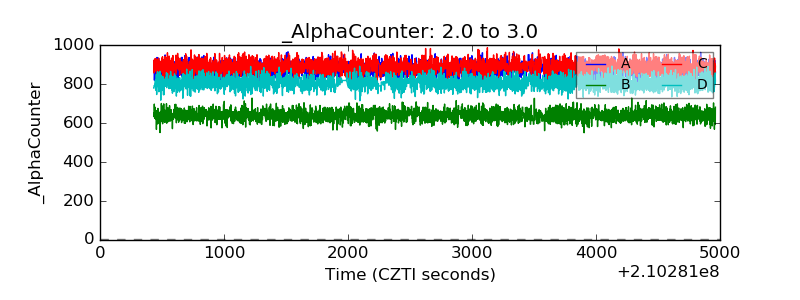 |
| _CPM_Rate |  |
| CZT Counter | 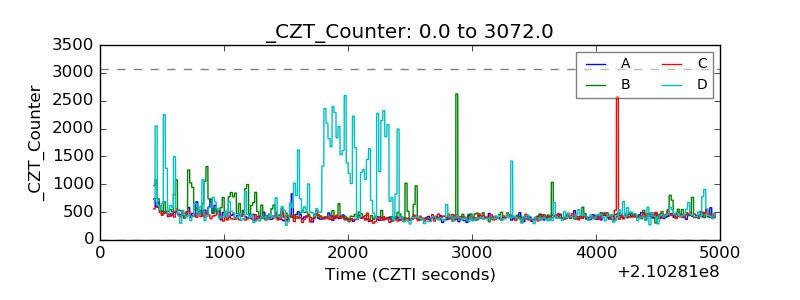 |
| +2.5 Volts monitor |  |
| +5 Volts monitor | 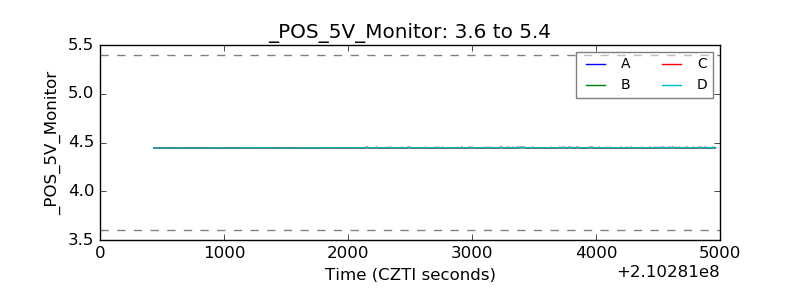 |
| _ROLL_ROT | 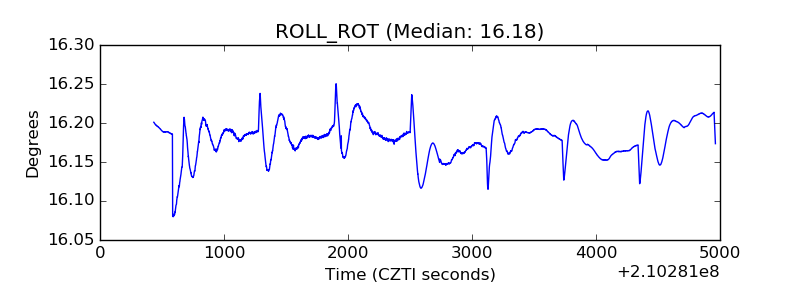 |
| _Roll_DEC |  |
| _Roll_RA | 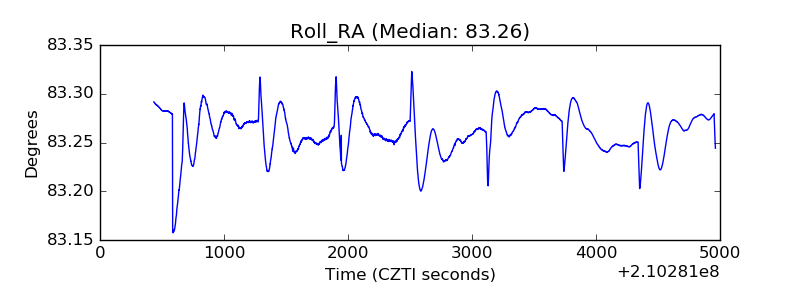 |
| Veto Counter |  |