| Param | Original file | Final file |
|---|---|---|
| Filename | modeM0/AS1G05_115T01_9000000634_05007cztM0_level2.evt | modeM0/AS1G05_115T01_9000000634_05007cztM0_level2_quad_clean.evt |
| Size (bytes) | 216,506,880 | 51,056,640 |
| Size | 206.5 MB | 48.7 MB |
| Events in quadrant A | 1,358,993 | 331,188 |
| Events in quadrant B | 1,474,992 | 332,077 |
| Events in quadrant C | 1,372,546 | 331,213 |
| Events in quadrant D | 2,120,636 | 313,597 |
| Mode M0 | |||
|---|---|---|---|
| Quadrant | BADHDUFLAG | Total packets | Discarded packets |
| A | 0 | 6711 | 0 |
| B | 0 | 6855 | 0 |
| C | 0 | 6725 | 0 |
| D | 0 | 8826 | 0 |
| Mode SS | |||
|---|---|---|---|
| Quadrant | BADHDUFLAG | Total packets | Discarded packets |
| A | 0 | 66 | 0 |
| B | 0 | 66 | 0 |
| C | 0 | 66 | 0 |
| D | 0 | 66 | 0 |
| Quadrant | Total seconds | Saturated seconds | Saturation percentage |
|---|---|---|---|
| A | 3351 | 1 | 0.029842% |
| B | 3351 | 2 | 0.059684% |
| C | 3351 | 2 | 0.059684% |
| D | 3351 | 166 | 4.953745% |
Noise dominated data is calculated using 1-second bins in cleaned event files. If a bin has >2000 counts, and if more than 50% of those come from <1% of pixels, then it is considered to be noise-dominated and hence unusable.
| Quadrant | # 1 sec bins | Bins with >0 counts | Bins with >2000 counts | High rate bins dominated by noise | Noise dominated (total time) | Noise dominated (detector-on time) | Marked lightcurve |
|---|---|---|---|---|---|---|---|
| A | 3351 | 3351 | 0 | 0 | 0.00% | 0.00% | 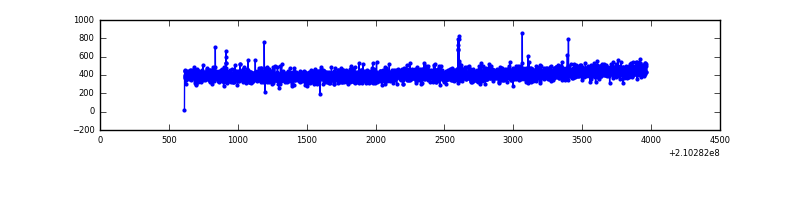 |
| B | 3351 | 3351 | 1 | 1 | 0.03% | 0.03% |  |
| C | 3351 | 3351 | 2 | 2 | 0.06% | 0.06% | 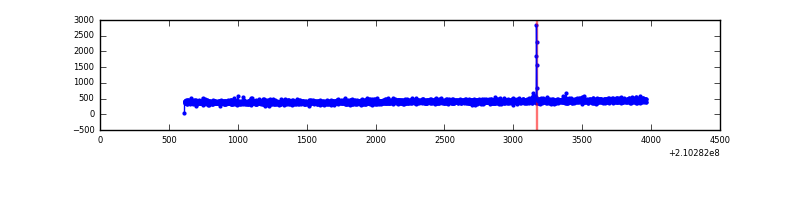 |
| D | 3351 | 3351 | 200 | 200 | 5.97% | 5.97% | 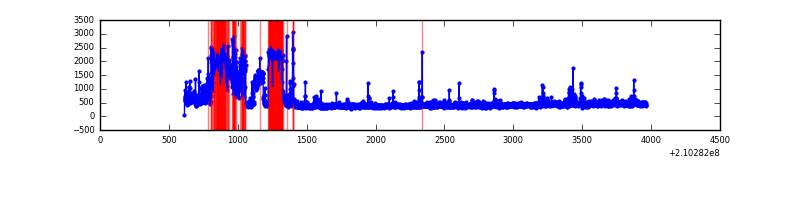 |
Top three noisy pixels from each quadrant. If the there are fewer than three noisy pixels in the level2.evt file, extra rows are filled as -1
| Pixel properties | Quadrant properties | ||||||
|---|---|---|---|---|---|---|---|
| Quadrant | DetID | PixID | Counts | Sigma | Mean | Median | Sigma |
| A | 0 | 50 | 6868 | 88.95 | 351 | 343 | 73.4 |
| A | 12 | 194 | 3479 | 42.75 | 351 | 343 | 73.4 |
| A | 0 | 226 | 3316 | 40.53 | 351 | 343 | 73.4 |
| B | 0 | 219 | 62720 | 891.86 | 358 | 350 | 69.9 |
| B | 15 | 204 | 13066 | 181.83 | 358 | 350 | 69.9 |
| B | 0 | 229 | 7954 | 108.73 | 358 | 350 | 69.9 |
| C | 1 | 16 | 10935 | 128.94 | 348 | 349 | 82.1 |
| C | 13 | 61 | 2805 | 29.92 | 348 | 349 | 82.1 |
| C | 3 | 202 | 835 | 5.92 | 348 | 349 | 82.1 |
| D | 13 | 235 | 645282 | 7600.04 | 341 | 331 | 84.9 |
| D | 2 | 63 | 49551 | 580.0 | 341 | 331 | 84.9 |
| D | 2 | 33 | 33904 | 395.62 | 341 | 331 | 84.9 |
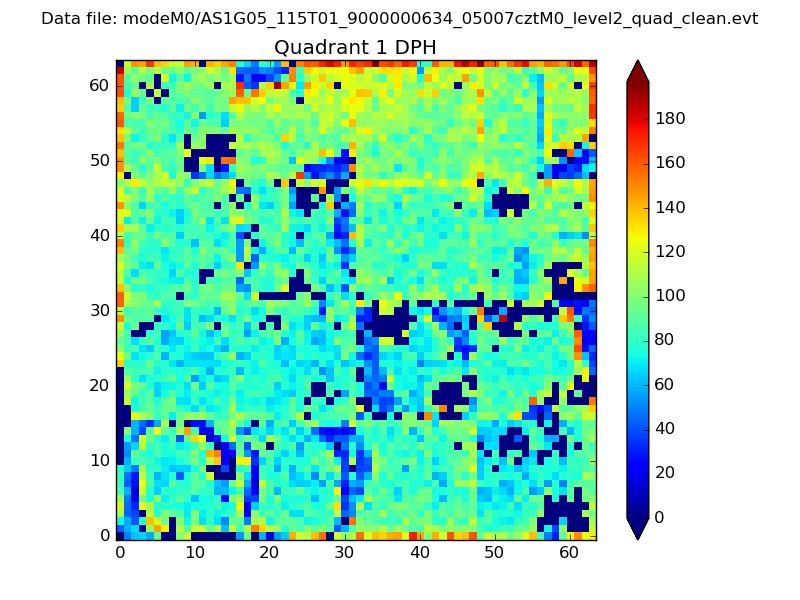
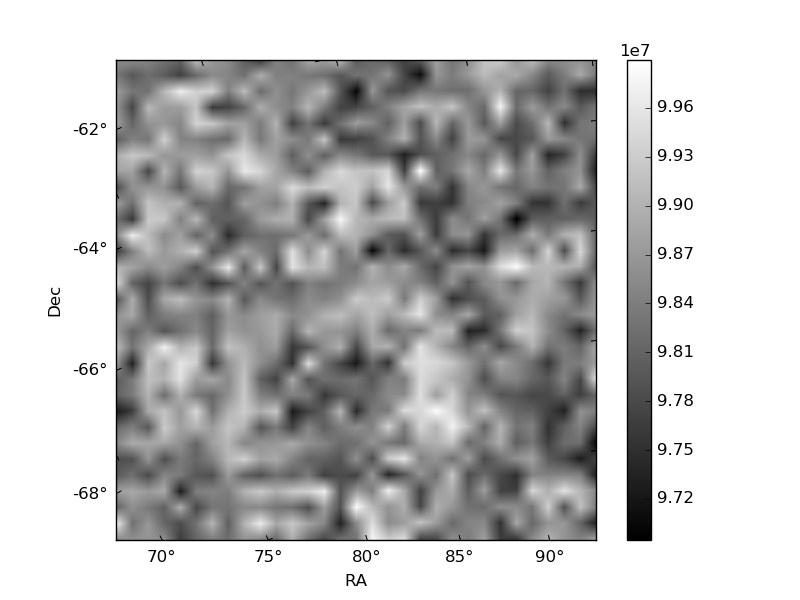
Histogram calculated using DETX and DETY for each event in the final _common_clean file
| Quadrant A | 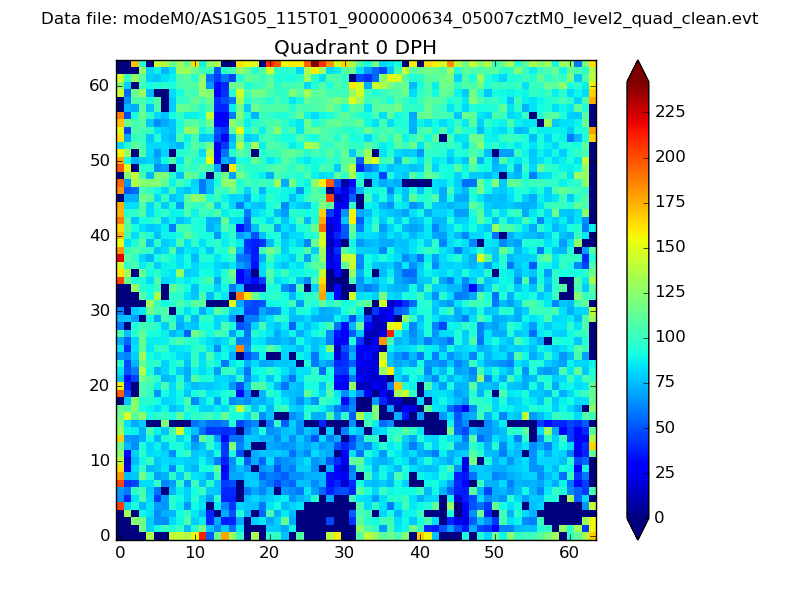 |
 |
Quadrant B |
|---|---|---|---|
| Quadrant D | 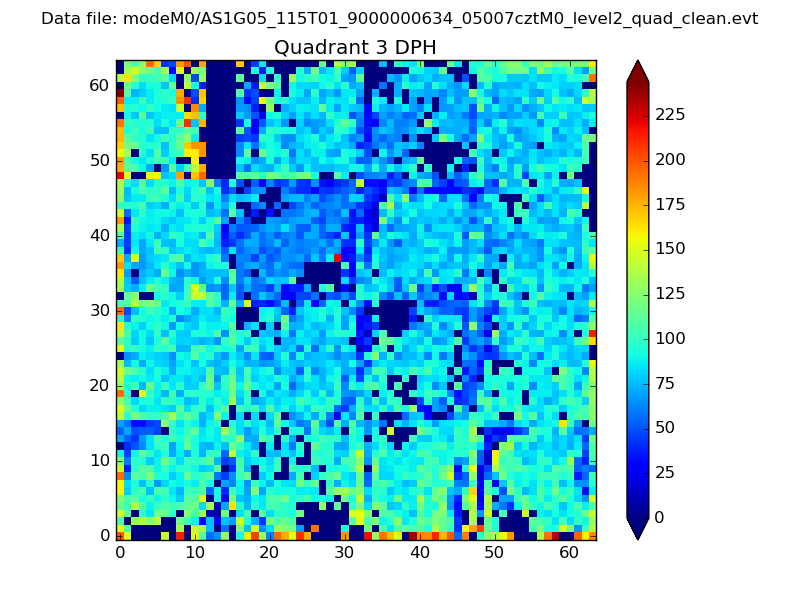 |
 |
Quadrant C |
| Plot type | Count rate plots | Images |
|---|---|---|
| Comparison with Poisson distribution Blue bars denote a histogram of data divided into 1 sec bins. Red curve is a Poisson curve with rate = median count rate of data. |
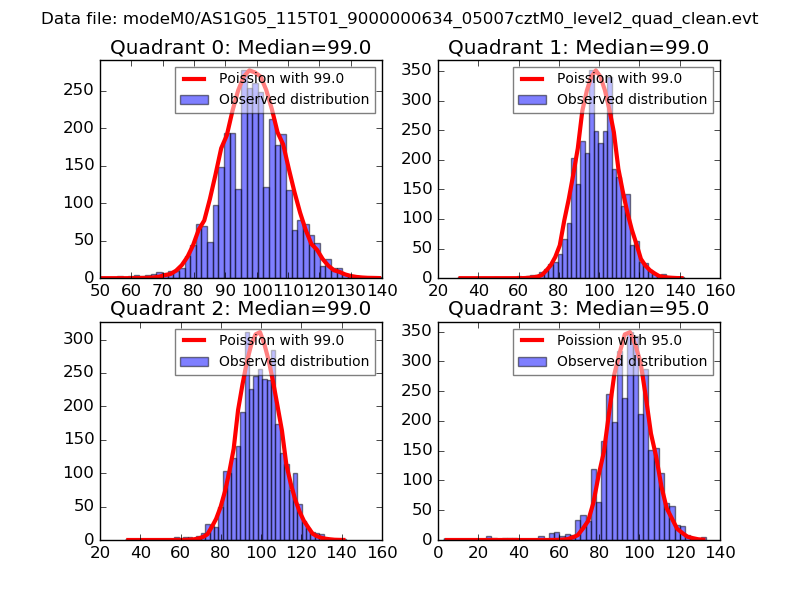 |
 |
| Quadrant-wise count rates Data is divided into 100 sec bins |
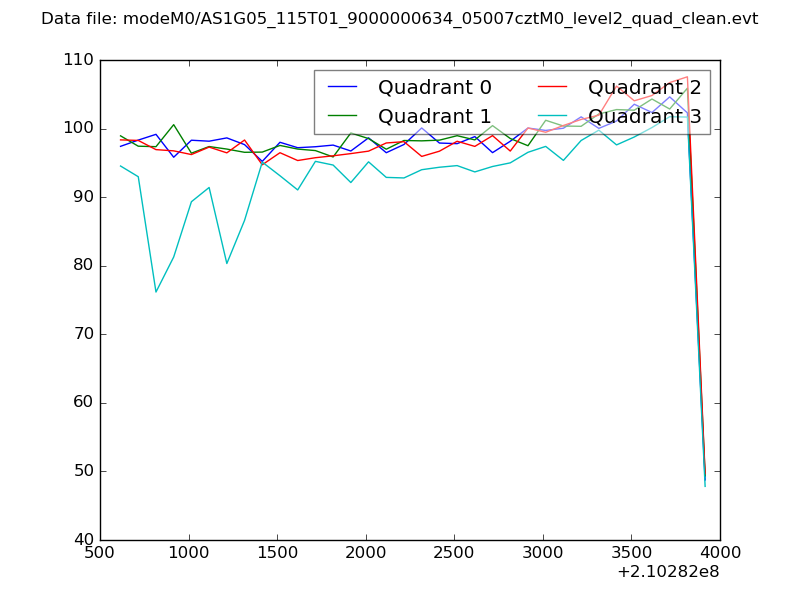 |
|
| Module-wise count rates for Quadrant A Data is divided into 100 sec bins |
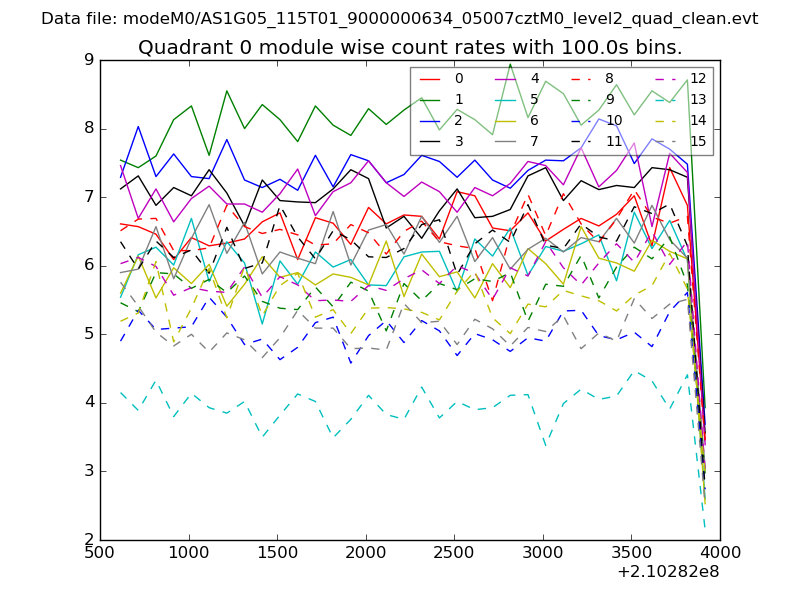 |
 |
| Module-wise count rates for Quadrant B Data is divided into 100 sec bins |
 |
 |
| Module-wise count rates for Quadrant C Data is divided into 100 sec bins |
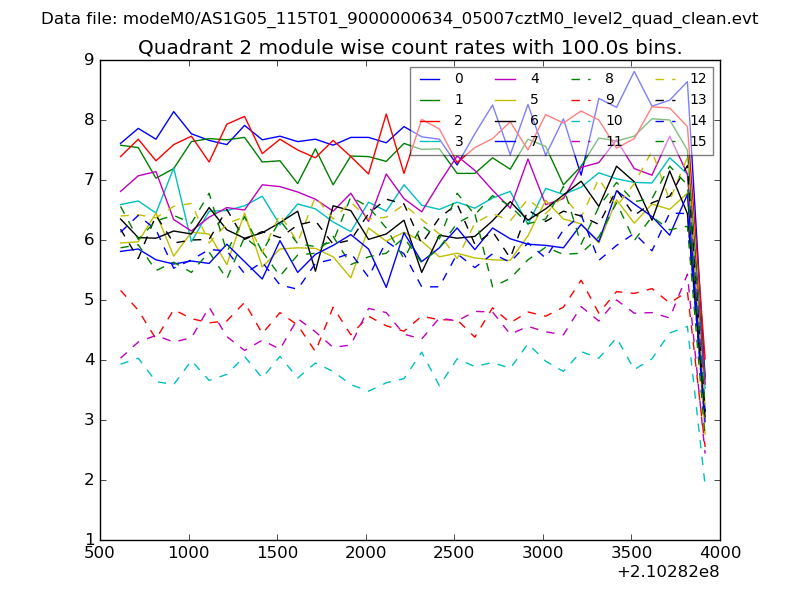 |
 |
| Module-wise count rates for Quadrant D Data is divided into 100 sec bins |
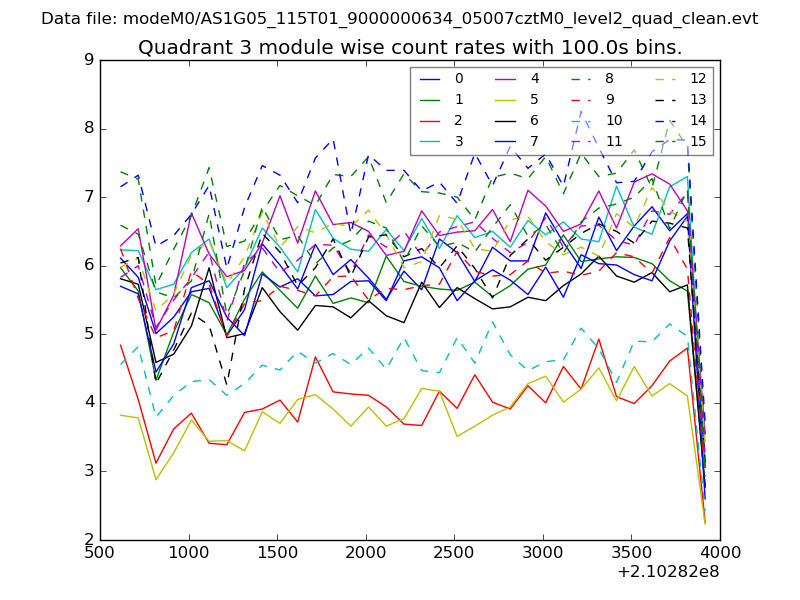 |
 |
| Parameter | Plot |
|---|---|
| CZT HV Monitor | 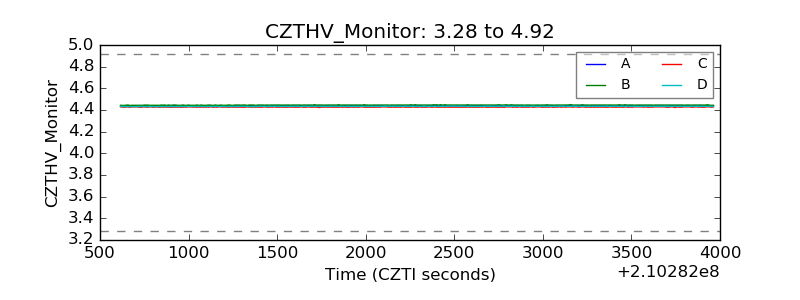 |
| D_VDD | 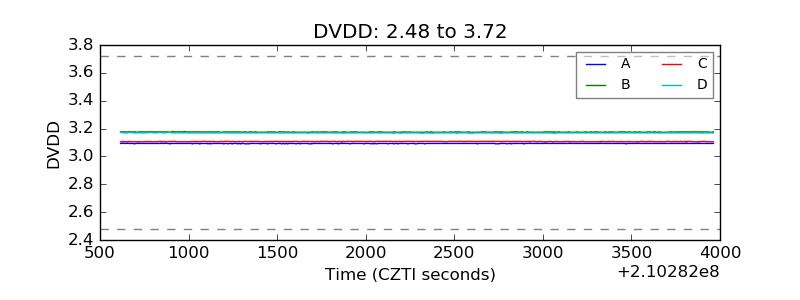 |
| Temperature 1 | 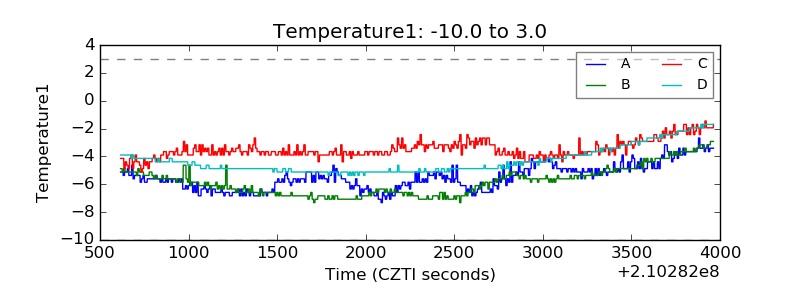 |
| Veto HV Monitor | 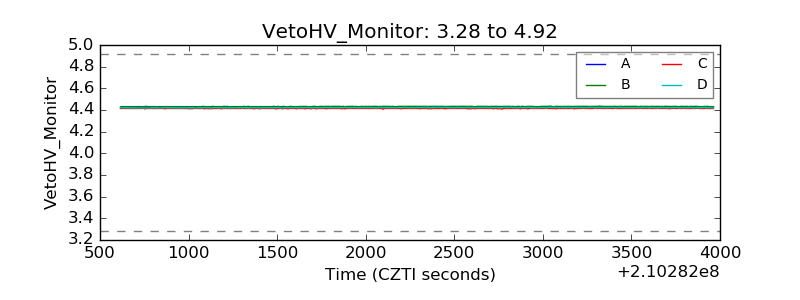 |
| Veto LLD | 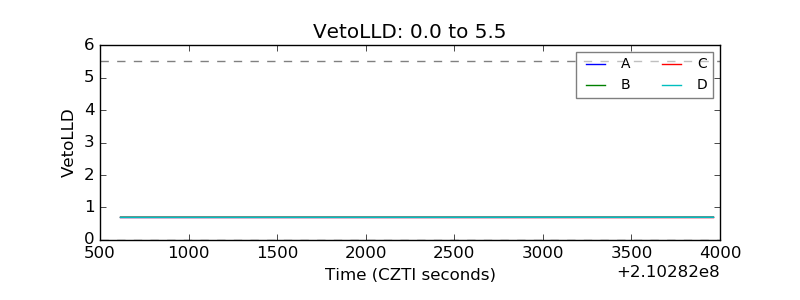 |
| Alpha Counter | 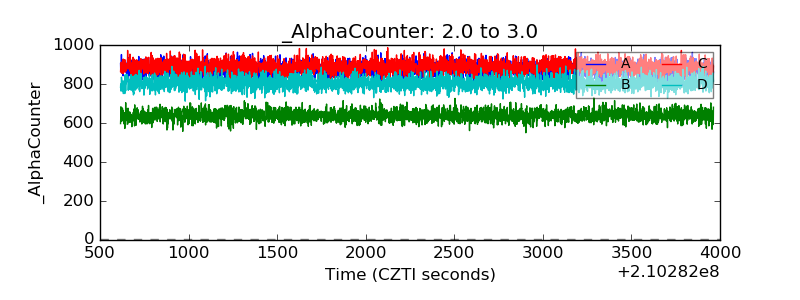 |
| _CPM_Rate | 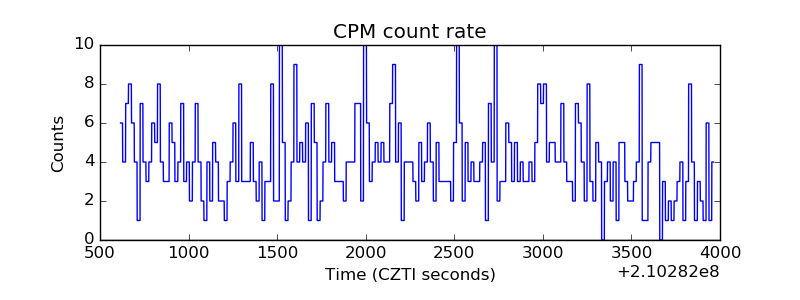 |
| CZT Counter |  |
| +2.5 Volts monitor |  |
| +5 Volts monitor | 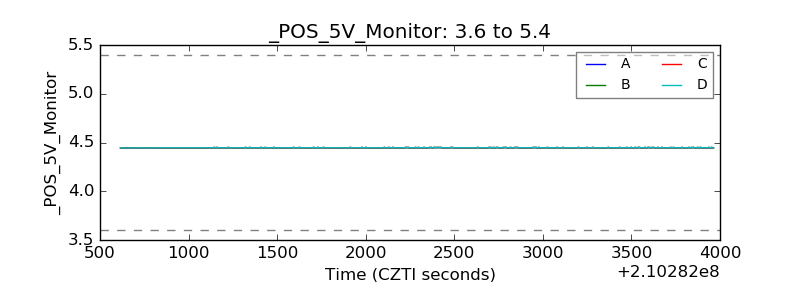 |
| _ROLL_ROT | 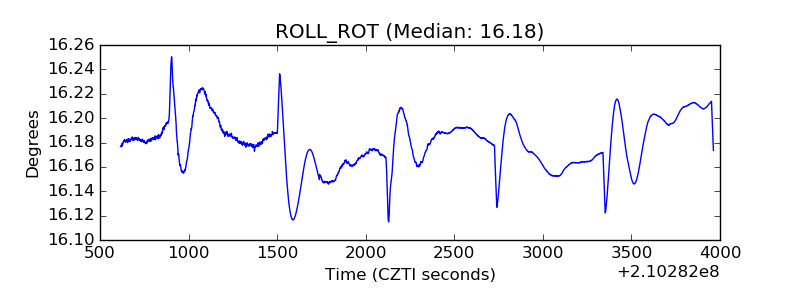 |
| _Roll_DEC | 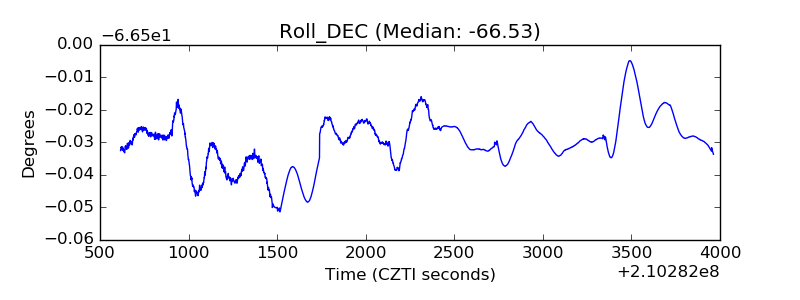 |
| _Roll_RA | 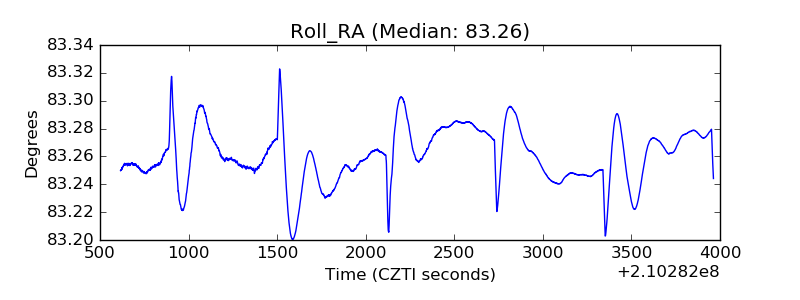 |
| Veto Counter | 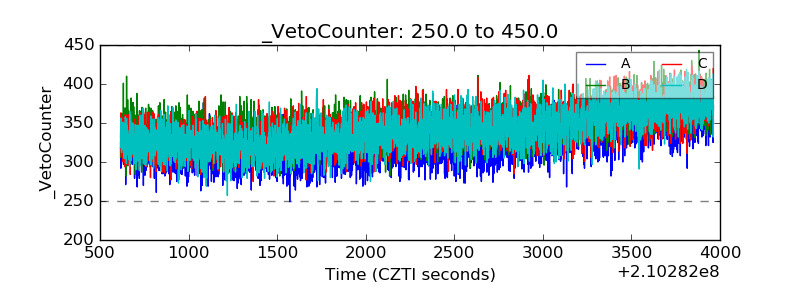 |