| Param | Original file | Final file |
|---|---|---|
| Filename | modeM0/AS1T01_135T01_9000000632_04981cztM0_level2.evt | modeM0/AS1T01_135T01_9000000632_04981cztM0_level2_quad_clean.evt |
| Size (bytes) | 245,327,040 | 28,998,720 |
| Size | 234.0 MB | 27.7 MB |
| Events in quadrant A | 1,445,105 | 178,432 |
| Events in quadrant B | 1,497,901 | 179,286 |
| Events in quadrant C | 1,481,906 | 171,757 |
| Events in quadrant D | 2,807,638 | 142,601 |
| Mode M0 | |||
|---|---|---|---|
| Quadrant | BADHDUFLAG | Total packets | Discarded packets |
| A | 0 | 6098 | 2 |
| B | 0 | 6226 | 1 |
| C | 0 | 6273 | 1 |
| D | 0 | 10244 | 1 |
| Mode SS | |||
|---|---|---|---|
| Quadrant | BADHDUFLAG | Total packets | Discarded packets |
| A | 0 | 60 | 0 |
| B | 0 | 60 | 0 |
| C | 0 | 60 | 0 |
| D | 0 | 60 | 0 |
| Mode M9 | |||
|---|---|---|---|
| Quadrant | BADHDUFLAG | Total packets | Discarded packets |
| A | 0 | 9 | 0 |
| B | 0 | 9 | 0 |
| C | 0 | 9 | 0 |
| D | 0 | 9 | 0 |
| Quadrant | Total seconds | Saturated seconds | Saturation percentage |
|---|---|---|---|
| A | 2872 | 107 | 3.725627% |
| B | 2872 | 115 | 4.004178% |
| C | 2872 | 111 | 3.864903% |
| D | 2872 | 572 | 19.916435% |
Noise dominated data is calculated using 1-second bins in cleaned event files. If a bin has >2000 counts, and if more than 50% of those come from <1% of pixels, then it is considered to be noise-dominated and hence unusable.
| Quadrant | # 1 sec bins | Bins with >0 counts | Bins with >2000 counts | High rate bins dominated by noise | Noise dominated (total time) | Noise dominated (detector-on time) | Marked lightcurve |
|---|---|---|---|---|---|---|---|
| A | 3797 | 2872 | 1 | 1 | 0.03% | 0.03% | 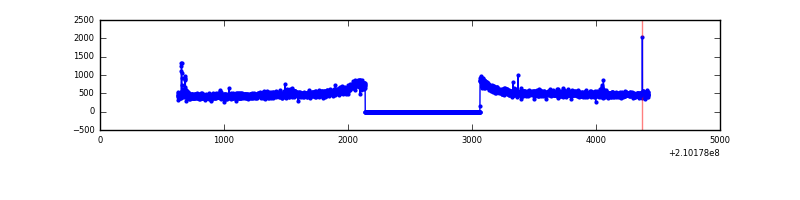 |
| B | 3797 | 2872 | 0 | 0 | 0.00% | 0.00% | 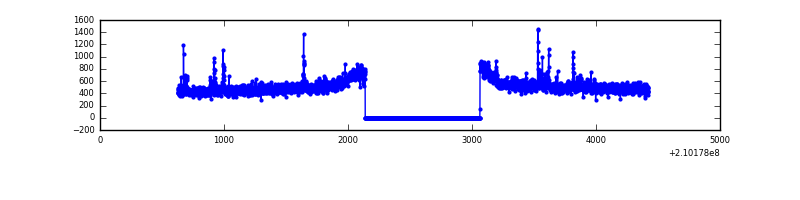 |
| C | 3797 | 2872 | 11 | 11 | 0.29% | 0.38% | 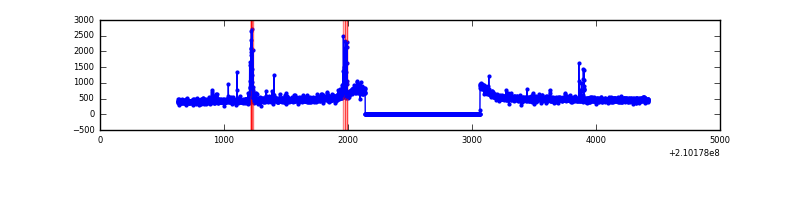 |
| D | 3797 | 2872 | 492 | 492 | 12.96% | 17.13% | 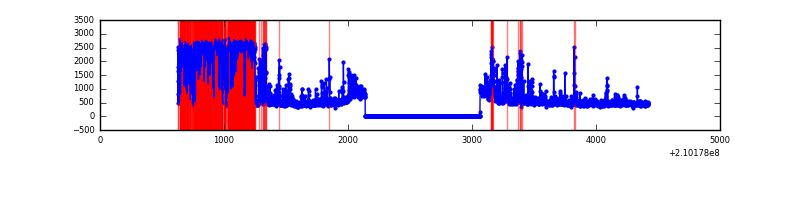 |
Top three noisy pixels from each quadrant. If the there are fewer than three noisy pixels in the level2.evt file, extra rows are filled as -1
| Pixel properties | Quadrant properties | ||||||
|---|---|---|---|---|---|---|---|
| Quadrant | DetID | PixID | Counts | Sigma | Mean | Median | Sigma |
| A | 0 | 50 | 11142 | 138.78 | 371 | 363 | 77.7 |
| A | 8 | 15 | 5042 | 60.24 | 371 | 363 | 77.7 |
| A | 12 | 194 | 3638 | 42.16 | 371 | 363 | 77.7 |
| B | 0 | 219 | 39565 | 531.15 | 374 | 364 | 73.8 |
| B | 12 | 111 | 6813 | 87.38 | 374 | 364 | 73.8 |
| B | 15 | 54 | 6141 | 78.27 | 374 | 364 | 73.8 |
| C | 1 | 16 | 79381 | 925.9 | 357 | 358 | 85.3 |
| C | 10 | 21 | 9688 | 109.32 | 357 | 358 | 85.3 |
| C | 13 | 61 | 2941 | 30.26 | 357 | 358 | 85.3 |
| D | 4 | 95 | 1402647 | 16880.05 | 336 | 326 | 83.1 |
| D | 13 | 235 | 60877 | 728.87 | 336 | 326 | 83.1 |
| D | 2 | 234 | 15308 | 180.34 | 336 | 326 | 83.1 |
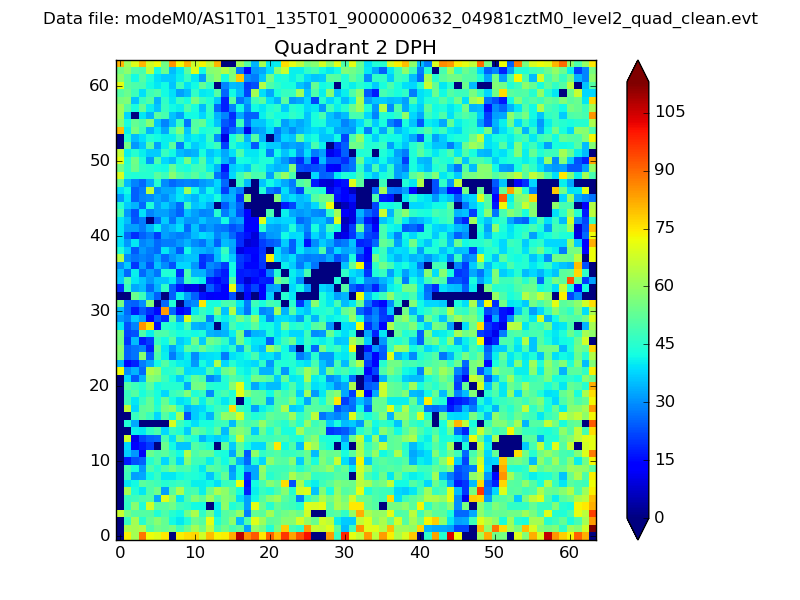
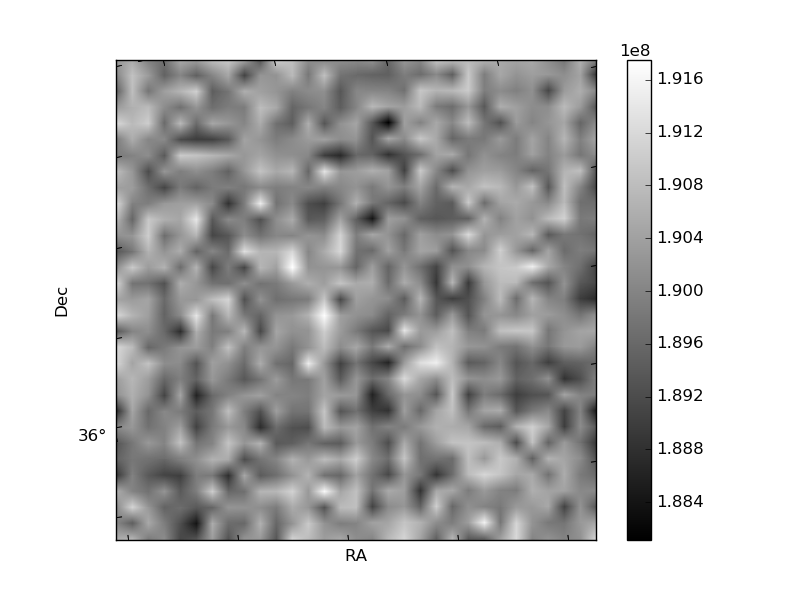
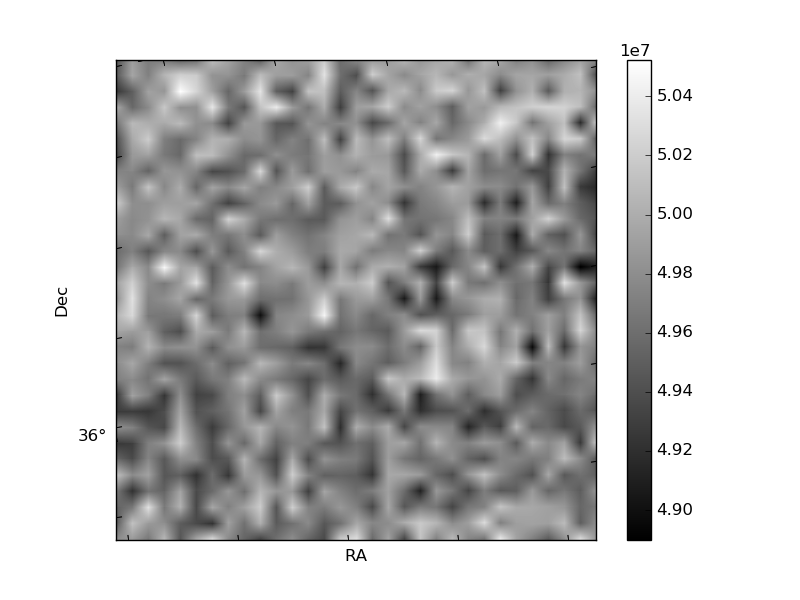
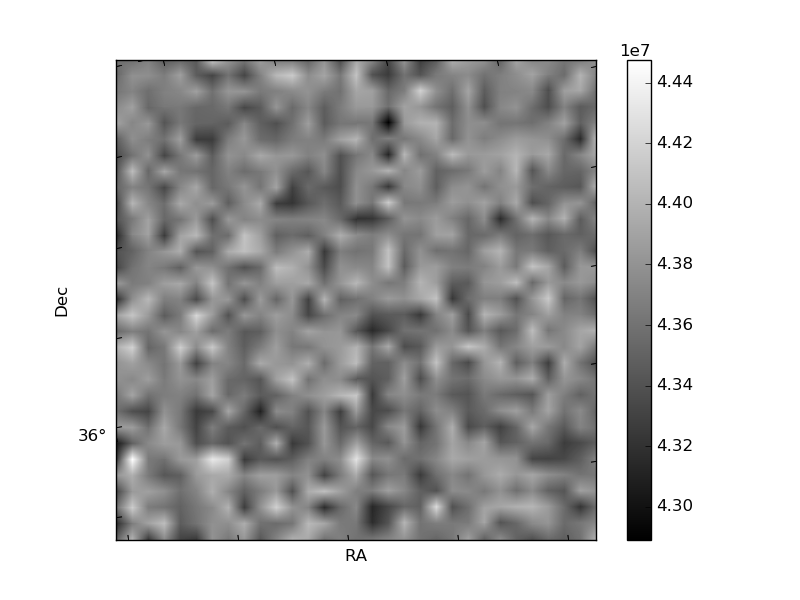
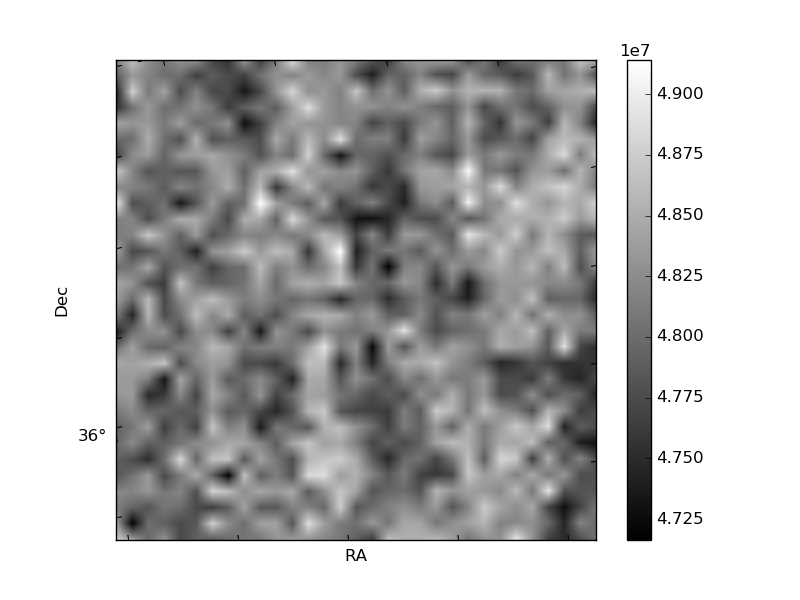
Histogram calculated using DETX and DETY for each event in the final _common_clean file
| Quadrant A | 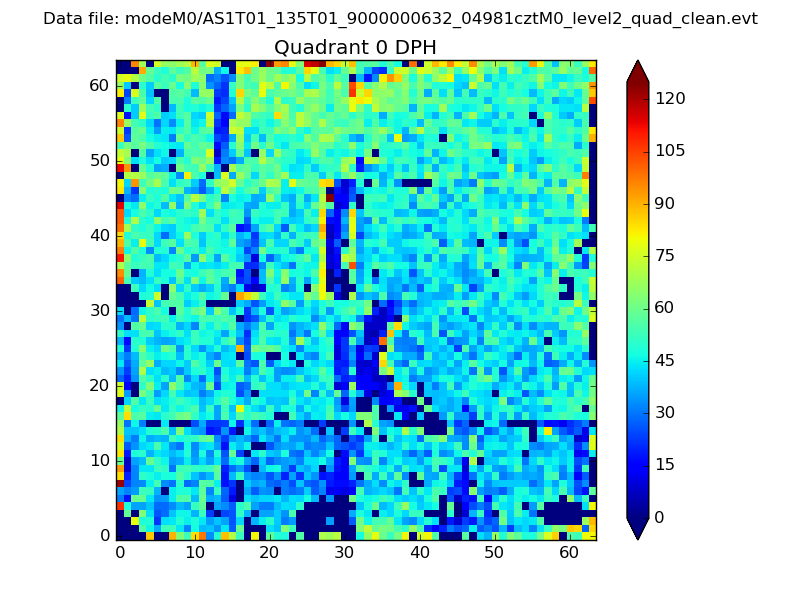 |
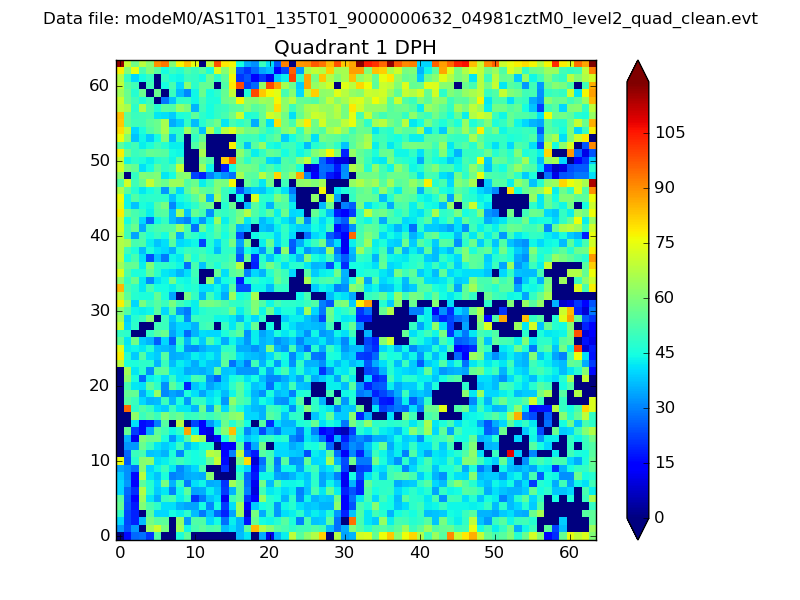 |
Quadrant B |
|---|---|---|---|
| Quadrant D | 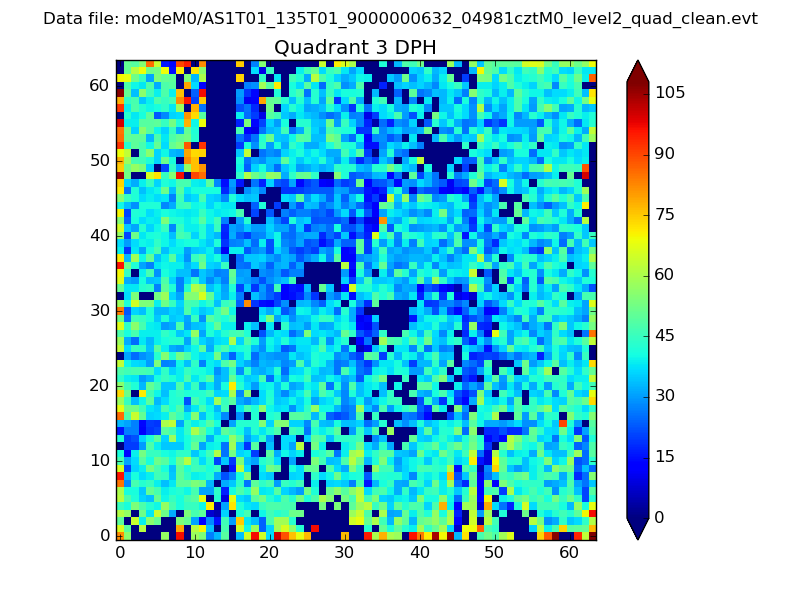 |
 |
Quadrant C |
| Plot type | Count rate plots | Images |
|---|---|---|
| Comparison with Poisson distribution Blue bars denote a histogram of data divided into 1 sec bins. Red curve is a Poisson curve with rate = median count rate of data. |
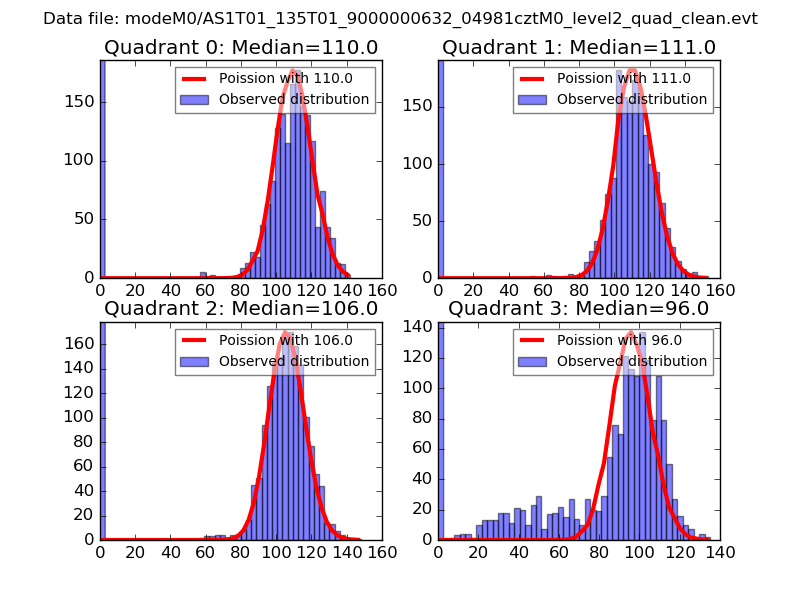 |
 |
| Quadrant-wise count rates Data is divided into 100 sec bins |
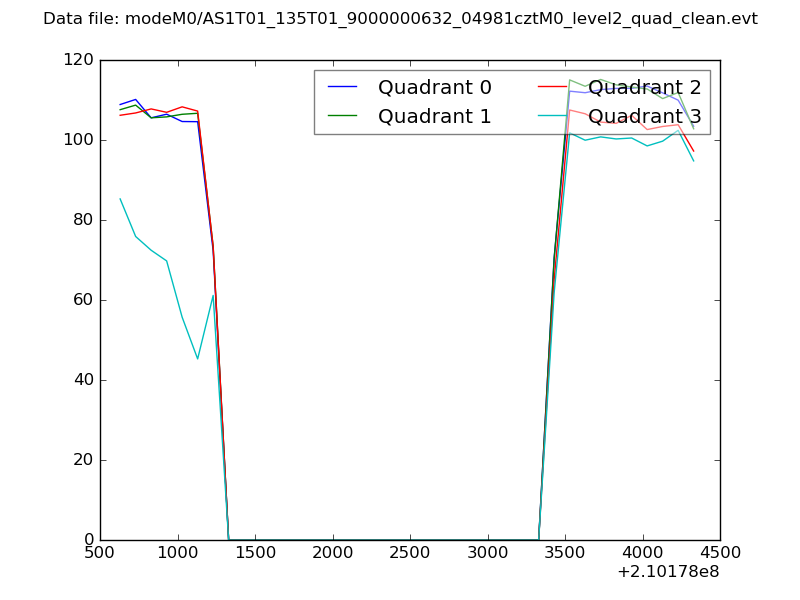 |
|
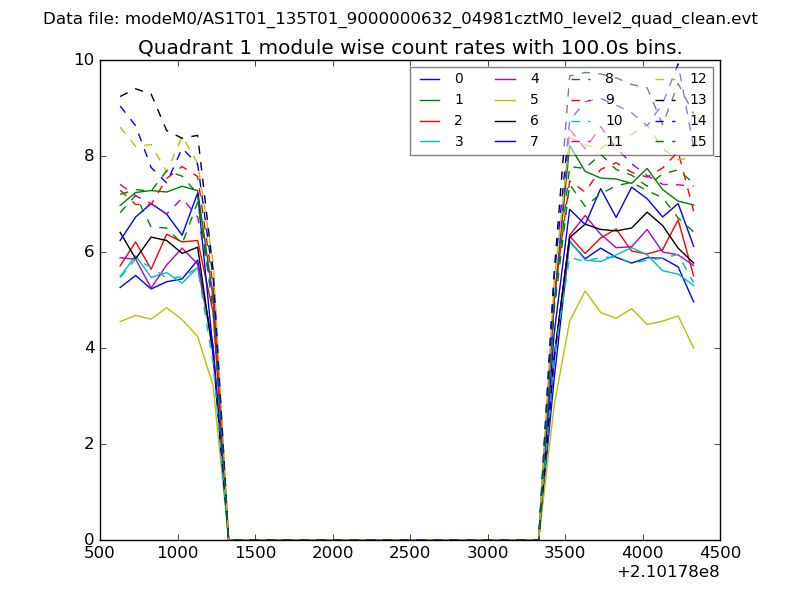
| Module-wise count rates for Quadrant A Data is divided into 100 sec bins |
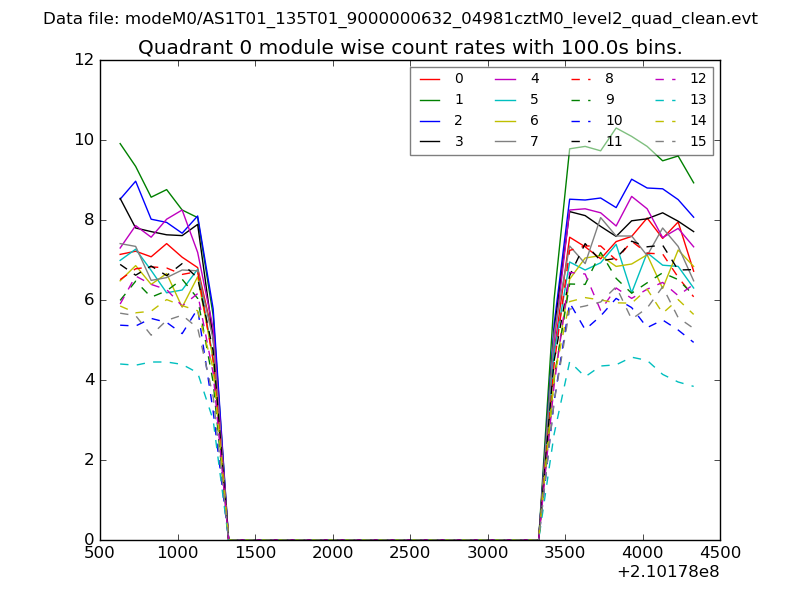 |
 |
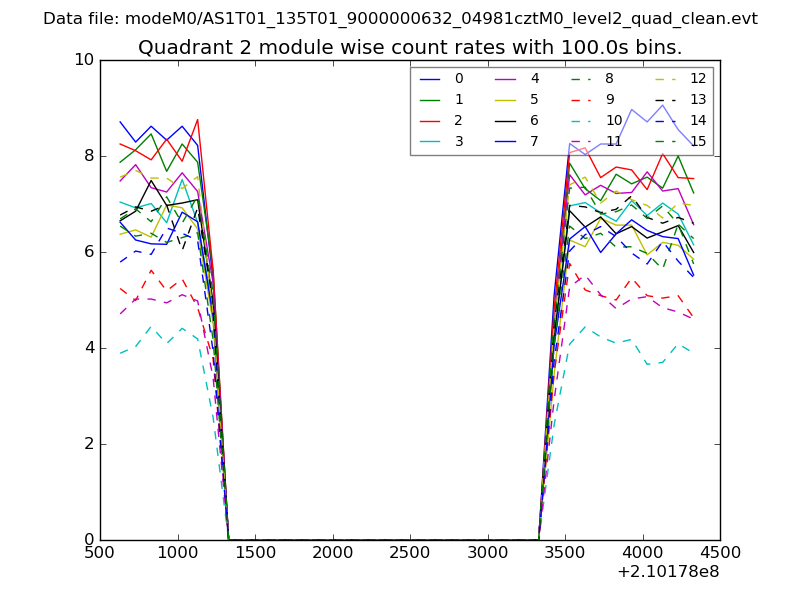
| Module-wise count rates for Quadrant B Data is divided into 100 sec bins |
 |
 |
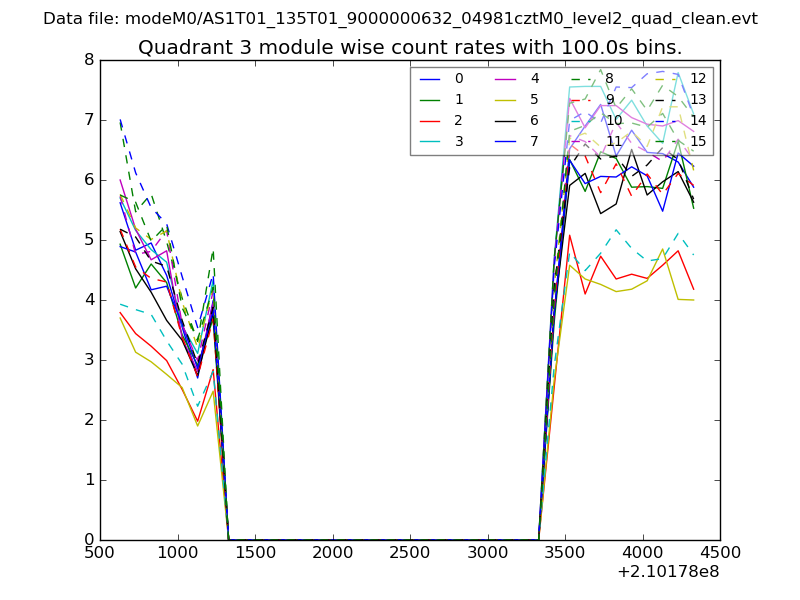
| Module-wise count rates for Quadrant C Data is divided into 100 sec bins |
 |
 |
| Module-wise count rates for Quadrant D Data is divided into 100 sec bins |
 |
 |
| Parameter | Plot |
|---|---|
| CZT HV Monitor | 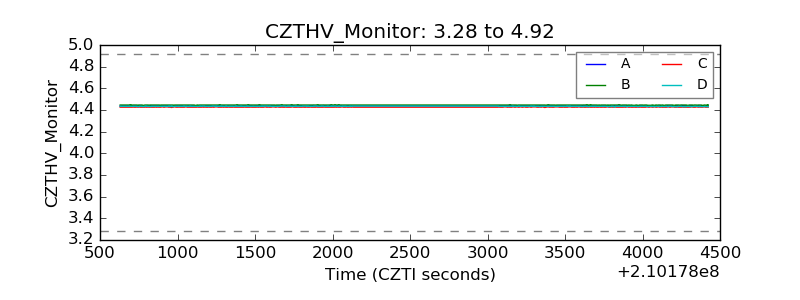 |
| D_VDD | 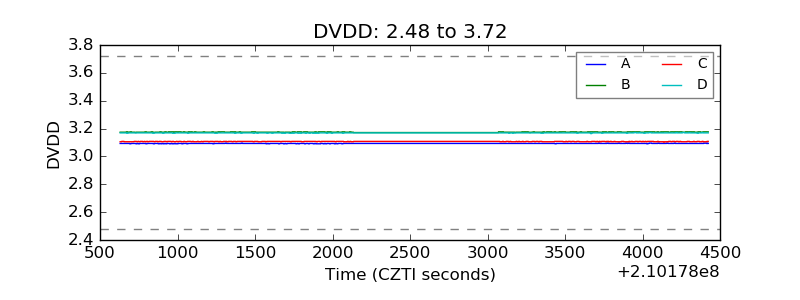 |
| Temperature 1 | 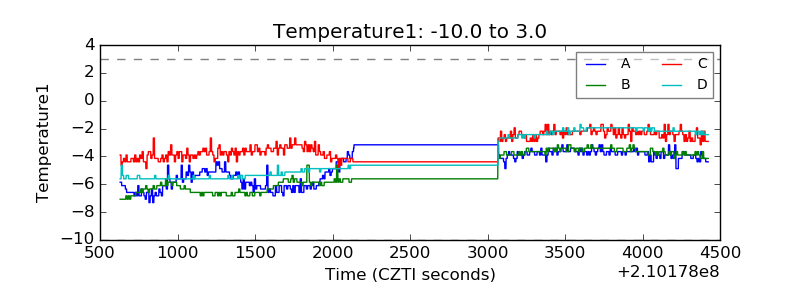 |
| Veto HV Monitor | 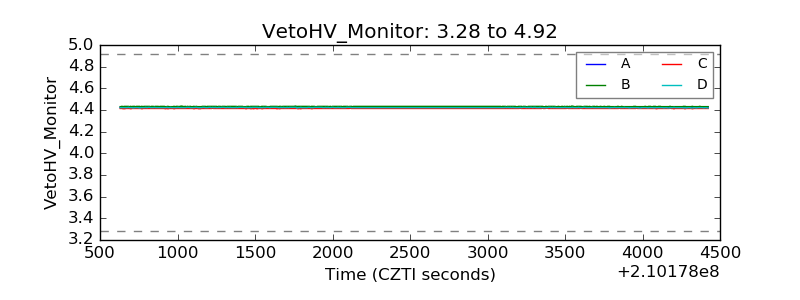 |
| Veto LLD | 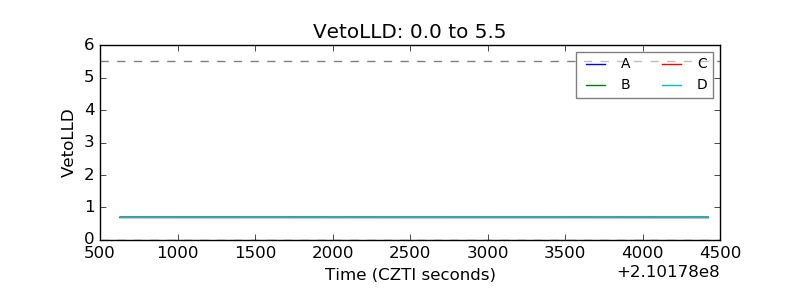 |
| Alpha Counter | 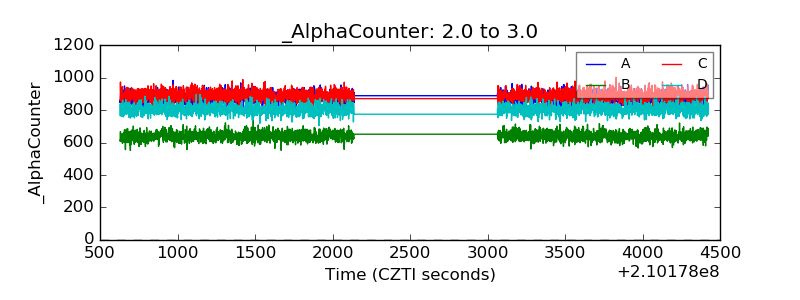 |
| _CPM_Rate | 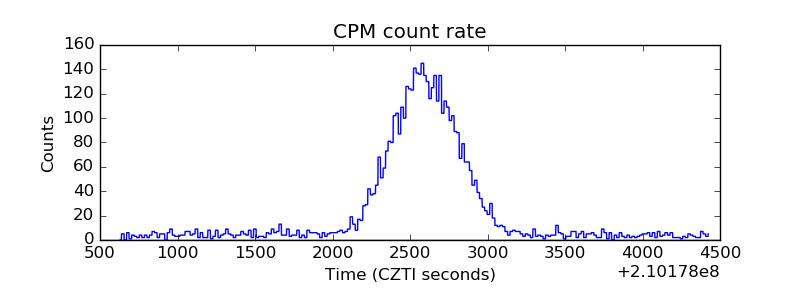 |
| CZT Counter | 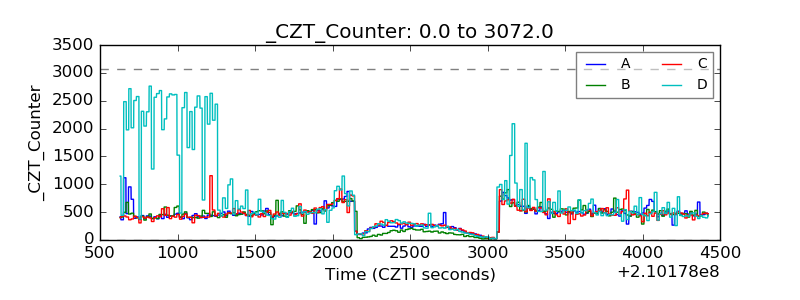 |
| +2.5 Volts monitor | 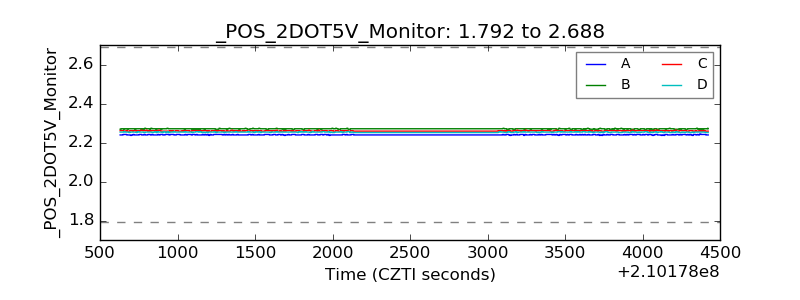 |
| +5 Volts monitor | 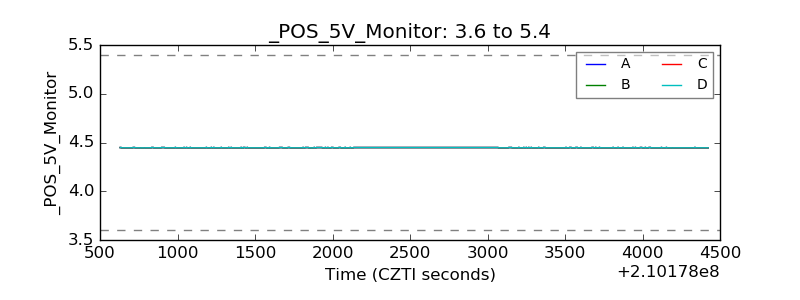 |
| _ROLL_ROT | 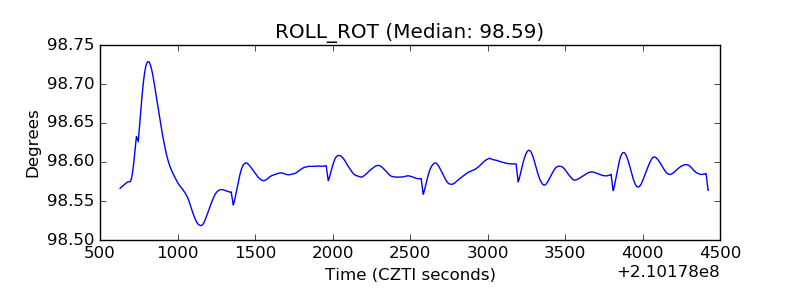 |
| _Roll_DEC | 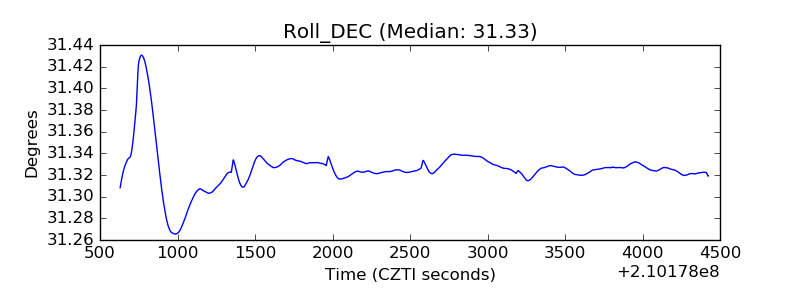 |
| _Roll_RA |  |
| Veto Counter | 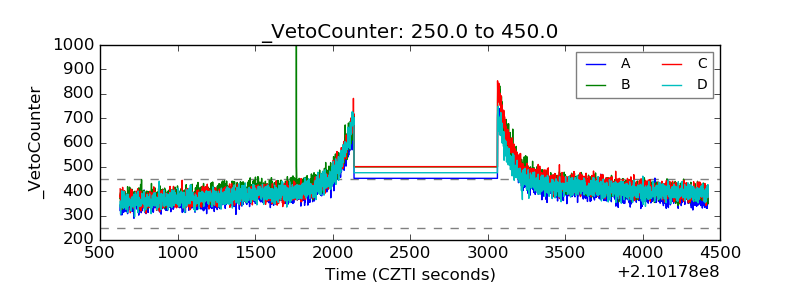 |